Production downtime is any period when manufacturing equipment, a production line, or an entire facility stops producing output. According to a McKinsey analysis of industrial manufacturers, unplanned downtime costs the sector an estimated $50 billion per year — with individual plants losing anywhere from $10,000 to over $250,000 for every hour the line stops. For maintenance and operations teams, reducing production downtime is not a maintenance goal: it is a direct revenue and profitability priority. A well-implemented CMMS combined with structured maintenance strategies can reduce unplanned downtime by 30–50% within the first year of deployment.
Key Takeaways
Unplanned downtime costs 3–5× more than planned: Emergency repairs, idle labour, and reactive parts sourcing compound the cost of every unexpected stoppage far beyond the repair itself.
Equipment failure causes 42% of unplanned downtime: The majority of stoppages trace back to deferred or missed preventive maintenance — a problem directly within the maintenance team’s control.
MTTR, MTBF, and OEE are the three numbers that matter most: Plants that track these KPIs at the asset level identify their worst performers and fix the right problems first.
Root cause analysis prevents repeat failures: Every breakdown that closes without a formal 5 Whys investigation has a high probability of recurring within 90 days on the same asset.
What Is Production Downtime?
Production downtime is any scheduled or unscheduled period during which a manufacturing process, machine, or production line is not producing output. It is one of the most direct and measurable drains on productivity, profitability, and Overall Equipment Effectiveness (OEE). Every minute a line is stopped, the revenue clock runs in reverse: labour is paid, overhead accumulates, and customer commitments erode.
Downtime falls into two categories with very different cost profiles and management approaches. Understanding the difference is the starting point for any downtime reduction programme.
Planned vs Unplanned Downtime
Planned downtime is intentional and anticipated — scheduled maintenance windows, tooling changeovers, quality inspections, and shift handovers. Unplanned downtime happens without warning: a critical pump fails, a conveyor belt snaps, a sensor throws an unexpected fault code. According to Plant Engineering’s annual maintenance survey, unplanned maintenance accounts for roughly 70% of all production stoppages and costs significantly more per hour because the response is reactive, rushed, and expensive.
Factor
Planned Downtime
Unplanned Downtime
Cause
Scheduled maintenance, changeovers, inspections
Equipment failure, process breakdown, supply issues
Warning
Known in advance — production can be rescheduled
No warning — immediate production loss
Relative cost
Lower — parts, labour and sequence are pre-planned
Reduces Availability, Performance, and Quality simultaneously
Prevention method
Schedule optimisation and SMED techniques
Preventive and predictive maintenance programmes
The primary goal of any downtime reduction programme is to convert unplanned stoppages into planned ones — or eliminate them altogether. Even shifting 20% of your unplanned events into the planned category delivers a measurable improvement in cost per downtime hour and team morale.
The Real Cost of Production Downtime
The direct cost of a stoppage — parts and labour for the repair — is typically less than a third of the true cost. The full picture compounds across lost revenue, idle labour, expedited sourcing, quality losses, and downstream supply chain impact.
How to Calculate Your Downtime Cost Per Hour
Use this formula to establish your baseline: Downtime cost per hour = Lost revenue + Idle labour + Emergency repair premium + Scrap and rework costs.
To apply it in practice:
Lost revenue: Take your planned production rate (units per hour), multiply by your net revenue per unit, and multiply by the hours stopped. A line producing 500 units/hour at $20 net revenue per unit loses $10,000 per hour in revenue alone.
Idle labour: Count every worker whose productivity is blocked by the stoppage — not just the maintenance team. On a 50-person line, idle labour at $30/hour fully-loaded is $1,500/hour in sunk cost.
Emergency repair premium: Reactive repairs cost 2–3× planned repairs. Emergency parts sourcing, overtime rates, and expedited freight can easily double the direct repair cost versus the same job done as a scheduled PM.
Scrap and rework: Line restarts frequently generate out-of-spec product — especially in food & beverage, pharmaceutical, and precision manufacturing. Include the cost of scrap batches generated during shutdown and restart.
In automotive manufacturing, a single hour of unplanned downtime on a final assembly line costs $50,000 to $250,000 when all these factors are included. Tracking these costs at the asset level using downtime tracking software transforms the maintenance budget conversation from a cost centre argument into a ROI discussion.
Common Causes of Production Downtime
Understanding the root causes of your production stoppages is the prerequisite for reducing them. Most unplanned downtime in manufacturing traces back to a handful of recurring causes — each with specific preventive interventions.
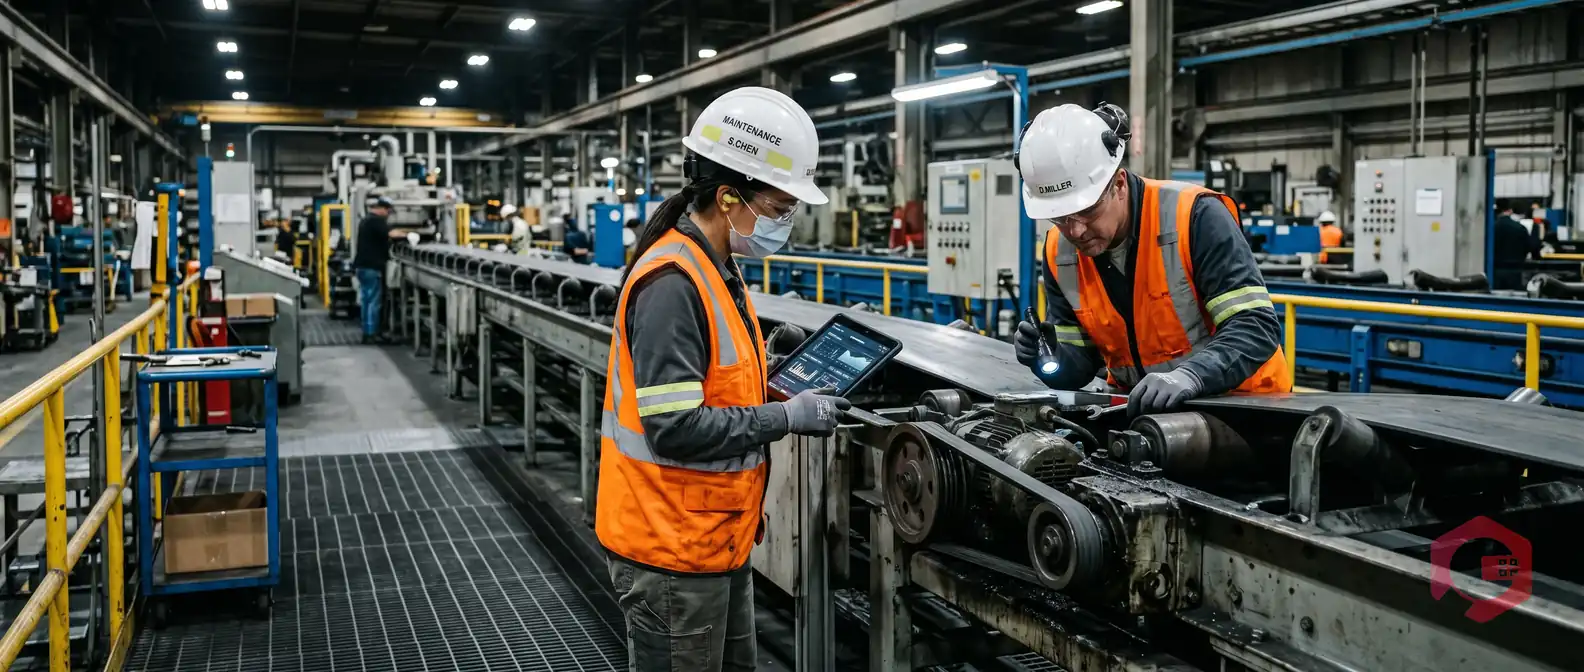
Equipment failure (42% of unplanned events): Bearings wear, seals fail, motors overheat — not because the machines are unreliable, but because preventive maintenance was deferred or missed entirely. Equipment failure is the leading cause of unplanned downtime and also the most directly preventable through consistent PM execution.
Operator errors (23% of events): Incorrect machine settings, missed changeover steps, or skipped startup checks account for roughly one in four unplanned stoppages. These are not competence failures — they are process failures. Operators without standardised digital checklists will inevitably vary in their execution.
Spare parts stockouts: A bearing that costs $15 and takes 20 minutes to replace can stop a line for two days if it’s not in stock. Poor inventory management turns routine repairs into multi-day ordeals. When parts aren’t linked to asset registers with minimum stock alerts, stockouts are inevitable.
Poor shift handover: Information lost at shift change — an emerging vibration on a motor, a recurring fault code, a repair that “almost” stopped the line — surfaces as a breakdown on the next shift. Without a structured digital handover process, this knowledge disappears entirely.
Tooling and changeover failures: Unplanned stoppages during or immediately after changeovers typically trace to incomplete setup verification, worn tooling that wasn’t flagged during the previous cycle, or changeover procedures that exist only in the operator’s memory.
Utility and infrastructure failures: Compressed air pressure drops, electrical supply fluctuations, and cooling system failures are often overlooked in downtime analysis because they don’t show up in the machine’s own fault history. These require IoT monitoring at the utility level, not just the asset level.
How to Reduce Production Downtime: 6 Proven Strategies
These six strategies address the root causes above in order of impact. Implement them sequentially — each one builds on the last.
1. Implement preventive maintenance: PM schedules target the equipment failure cause directly. Consistent PM execution reduces unplanned breakdowns by 30–40% within the first year. Use preventive maintenance software to automate scheduling — time-based, metre-based, and condition-based triggers — so PMs fire automatically at the right interval without manual chasing.
2. Adopt predictive maintenance with IoT: Vibration sensors, thermal cameras, and current monitoring detect degradation before it becomes a failure. According to Deloitte’s predictive maintenance analysis, IoT-based predictive maintenance reduces equipment downtime by up to 50% and cuts maintenance costs by 25–30%. The critical step: sensors must integrate with your CMMS so threshold breaches auto-generate work orders, not just alerts that get ignored.
3. Standardise work order management: Every repair — planned or reactive — should follow a traceable lifecycle: request, assign, parts check, execute, close, and analyse. Digital work orders with mandatory fields (fault description, cause code, parts used, labour time) turn every breakdown into usable data. Ad-hoc WhatsApp repairs leave no institutional knowledge behind.
4. Optimise spare parts inventory: Link your inventory management system directly to your asset register. Every critical asset should have a defined parts list with minimum stock quantities and auto-triggered purchase requests when stock falls below threshold. The goal is to never wait for parts on a critical machine stoppage.
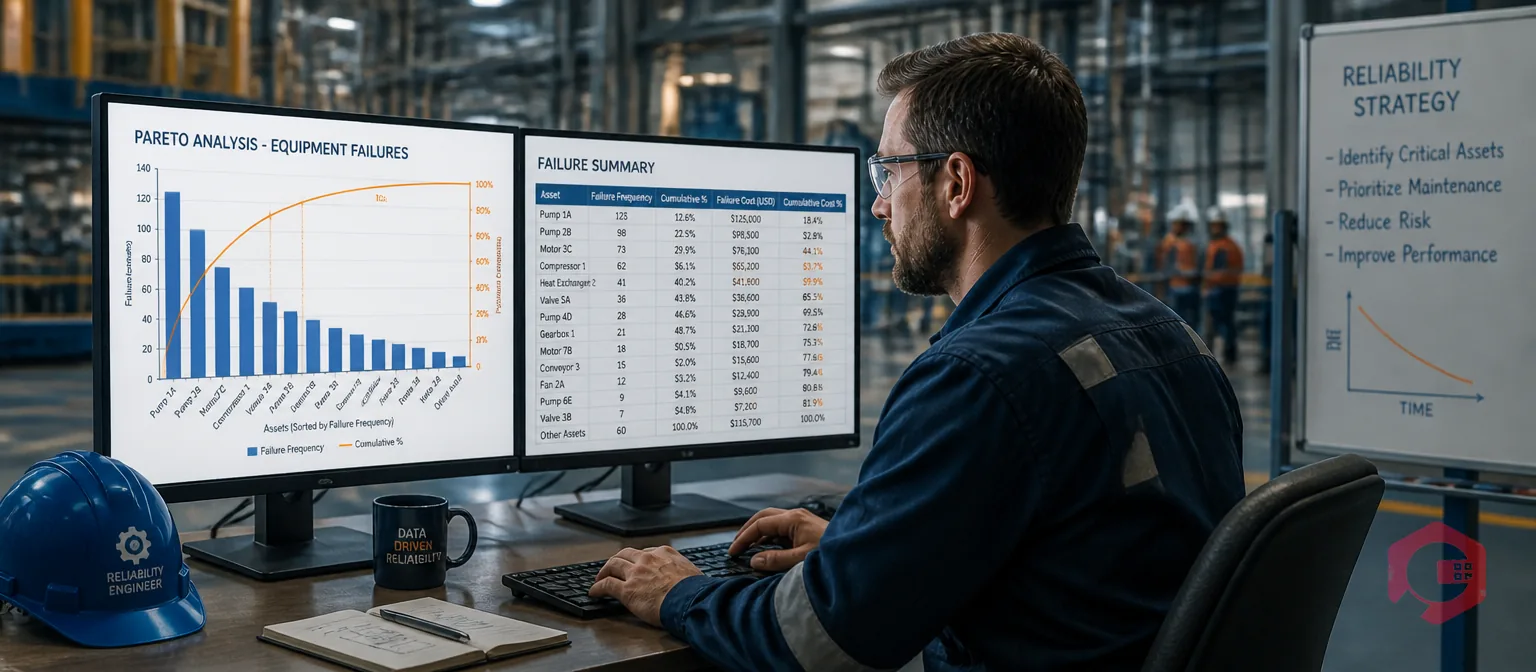
5. Track MTTR, MTBF, and OEE at the asset level: These three KPIs are your downtime reduction dashboard. MTTR tells you how fast your team recovers. MTBF tells you how reliably each machine runs. OEE tells you the combined impact on output. Tracking these per asset — not just plant-wide averages — reveals which machines are driving 80% of your downtime losses.
6. Use root cause analysis on every breakdown: Every breakdown that closes without a formal RCA has a high probability of recurring. The 5 Whys methodology takes 15–30 minutes per incident and systematically prevents repeat failures. Build RCA into your CMMS work order close-out flow so it can’t be skipped.
Use the MTBF calculator to establish your current failure frequency baselines before implementing any of these strategies — so you have a clear before/after measure of improvement.
Key Downtime KPIs: MTTR, MTBF, and OEE
Three KPIs give you the complete picture of your downtime performance. Track all three at the individual asset level — plant-wide averages mask the worst offenders.
MTTR (Mean Time to Repair): The average time from failure detection to production restoration. MTTR measures the speed and effectiveness of your maintenance response — it is influenced by parts availability, technician skill, diagnostic quality, and work order process efficiency. A high MTTR on a specific machine often reveals a parts stocking issue or a skills gap, not just a hard machine problem. World-class MTTR benchmarks vary by industry, but any unplanned repair taking more than 4 hours on a critical asset warrants investigation.
MTBF (Mean Time Between Failures): The average operating time between consecutive unplanned failures on the same asset. MTBF measures how reliably a machine runs — it is the primary output metric of your preventive and predictive maintenance programmes. Increasing MTBF is the goal of every PM schedule optimisation exercise. If MTBF is improving month-over-month, your PM programme is working.
OEE (Overall Equipment Effectiveness): The composite metric combining Availability (what % of scheduled time is the machine running), Performance (what % of theoretical speed is it running at when it is running), and Quality (what % of output meets specification). An OEE of 85% is considered world-class for discrete manufacturing; most plants operate between 60–70%, leaving significant room for improvement. Downtime reduction primarily improves the Availability component, but quality losses during restarts also affect the Quality score.
The relationship between the three: reducing unplanned failures (improving MTBF) reduces how often MTTR events occur. Reducing MTTR shrinks the availability loss per event. Together, they drive OEE upward. This is the core virtuous cycle of any downtime reduction programme.
Root Cause Analysis: The 5 Whys in Practice
When a breakdown occurs, the response should generate institutional knowledge — not just a repair. The 5 Whys methodology traces a failure back to its systemic root cause through five sequential “why” questions. Each answer becomes the subject of the next question, drilling down from symptom to cause.
Here is a worked example from a pump seal failure on a production line:
Why did the line stop? The pump seized and lost flow.
Why did the pump seize? The shaft seal failed and coolant contaminated the bearing.
Why did the seal fail? It was improperly installed — installed dry instead of with the specified lubricant.
Why was it installed incorrectly? The technician followed a verbal instruction instead of the written procedure.
Why was the written procedure not followed? The procedure only exists as a paper document in the maintenance office — not accessible from the machine during the repair.
The root cause is not a seal failure. It is a procedure accessibility problem. Fixing the seal without fixing the process guarantees recurrence — typically within 90 days when the next technician installs the next seal without checking the paper document. The corrective action is to digitise the procedure in the CMMS and attach it to the asset record so it opens automatically in the technician’s work order.
This is why every breakdown work order should have a mandatory RCA field before closure. Skipping RCA turns maintenance into an expensive treadmill — the same failures, the same repairs, the same costs, every quarter.
How Cryotos CMMS Reduces Production Downtime
Managing downtime reduction across a multi-machine production floor with spreadsheets and paper work orders hits a ceiling quickly. The volume of events, the speed of required response, and the complexity of parts tracking and KPI analysis all demand a system built for the purpose. Cryotos’s manufacturing maintenance software delivers five specific capabilities that directly address the causes and costs of production downtime.
Automated PM scheduling: Time-based, metre-based, and condition-based triggers fire work orders automatically — ensuring PM execution rates stay above 95% without manual scheduling effort. Plants consistently executing PM reduce unplanned breakdowns by 30% within the first six months.
Real-time downtime tracking: MTTR, MTBF, and OEE are calculated automatically from work order data — by asset, by line, by plant, and by shift. No manual spreadsheet consolidation. Live dashboards show which assets are your biggest downtime contributors right now.
IoT integration for predictive alerts: Connect sensors to Cryotos via SCADA, PLC, or edge device. When a vibration, temperature, or pressure reading breaches a defined threshold, a work order is auto-created and assigned — before the failure occurs. The technician arrives with the diagnosis already done.
Built-in 5 Whys RCA: The RCA module is embedded in the failure work order close-out flow. Technicians cannot close a reactive work order without completing a cause code and RCA summary. Every failure becomes a searchable record in the asset’s history — feeding future PM interval improvements.
Smart inventory management: Parts are linked to asset records with defined minimum stock quantities. When stock falls below threshold, purchase requests trigger automatically. The system tracks parts consumption by asset and work order, giving you real cost-per-asset visibility and eliminating the stockout-driven multi-day repair delays.
Cryotos customers in manufacturing typically see 30% reduction in unplanned downtime and 25% faster repair cycles within six months of full deployment across their production assets.
Frequently Asked Questions
What is the difference between planned and unplanned downtime?
Planned downtime is any intentional production stoppage scheduled in advance — maintenance windows, changeovers, and inspections. Unplanned downtime is any unexpected stoppage caused by equipment failure, supply issues, or process breakdowns. Unplanned downtime is significantly more costly because the response is reactive, disruptive, and often causes secondary damage that extends the stoppage beyond the initial failure.
How do you calculate production downtime cost?
Downtime cost = (revenue lost per hour) + (idle labour costs) + (emergency repair premium) + (scrap and rework). For a precise figure, track your planned production rate, your revenue or margin per unit, and your fully-loaded labour cost for the affected workforce. The emergency repair premium — including expedited parts and overtime — typically adds 50–100% to the direct repair cost of an unplanned event versus the same job as a scheduled PM.
How does a CMMS reduce production downtime?
A CMMS reduces downtime by automating PM scheduling to prevent failures before they occur, providing real-time asset health visibility through IoT integration, linking spare parts inventory to work orders to eliminate stockout delays, and capturing failure history for Root Cause Analysis so repeat breakdowns are investigated and eliminated. With structured work order management, every repair generates data that improves the next maintenance decision.
What are good benchmarks for MTTR and MTBF in manufacturing?
Benchmarks vary significantly by industry and asset type, so asset-specific trending is more useful than industry averages. As a general guide: world-class MTTR for critical production assets runs under 2 hours; plants with strong PM programmes achieve MTBF improvements of 20–40% year-over-year; OEE above 85% is considered world-class for discrete manufacturing. The most important metric is your own trend — is MTBF increasing and MTTR decreasing quarter-over-quarter?
Every hour of unplanned production downtime is preventable revenue loss — and the data to prevent it is already sitting in your maintenance history. Schedule a free demo to see how Cryotos gives manufacturing teams the real-time visibility, automated PM scheduling, and RCA tools to systematically drive unplanned downtime toward zero.