
CMMS KPIs — key performance indicators tracked inside your Computerised Maintenance Management System — are the clearest way to prove that your maintenance software investment is delivering real returns. When you can show that Mean Time Between Failures improved by 22%, that PM compliance hit 91%, or that cost per work order dropped by $47, you are no longer defending a software budget — you are presenting a business case. According to an Aberdeen Group study, organisations that actively track maintenance KPIs report 25% lower MRO costs and 18% higher asset availability than those that do not.
This guide walks you through the 10 CMMS KPIs that most directly prove ROI — complete with formulas, industry benchmarks, and the specific ROI calculation for each. Whether you are building a case for your CFO or setting up your first KPI dashboard, this is the framework maintenance managers rely on.
A CMMS KPI is a quantifiable metric for your maintenance software tracks automatically — drawn from work order history, asset records, inventory logs, and technician timesheets. Unlike gut-feel reports or monthly anecdotes, KPIs give you a number you can compare against last month, last quarter, or against industry benchmarks.
They prove ROI because every maintenance KPI ties to a cost or a revenue line. A 10% improvement in MTBF means fewer emergency callouts. A 5-point gain in PM compliance means fewer catastrophic failures. A $20 drop in cost per work order, multiplied across 400 work orders a month, is $8,000 saved. The KPI is the bridge between "our CMMS is working" and "here is exactly how much money it saved us."
Most maintenance teams only track lagging indicators — metrics that tell you what already happened. These are important, but they are rear-view-mirror numbers. Leading indicators tell you where you are headed before failures occur.
A strong CMMS KPI dashboard tracks both. Leading indicators let you course-correct before an expensive failure. Lagging indicators give you the hard numbers to show management that the course correction worked.
Your CMMS software should make this automatic — scheduled reports delivered to inboxes, not spreadsheets someone has to build by hand.
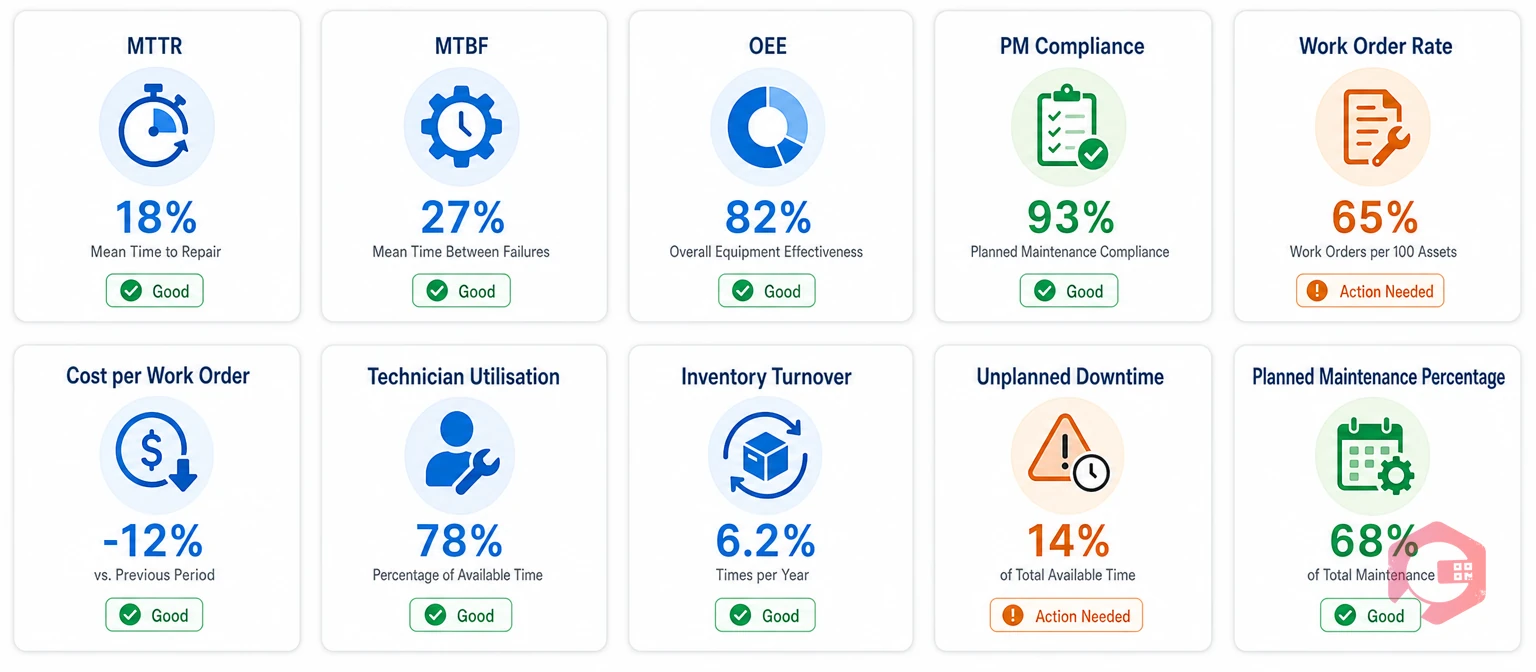
Each KPI below includes its formula, the industry target to aim for, and the direct ROI calculation that shows your CFO exactly what the improvement is worth.
| KPI | Formula | Target | ROI Link |
|---|---|---|---|
| MTTR | Total repair time ÷ No. of repairs | < 4 hrs (mfg) | 1hr saved × $1,200 = $1,200/repair |
| MTBF | Uptime ÷ No. of failures | 3–5× industry avg | $3,500/callout × fewer failures |
| PMP | (Planned hrs ÷ Total hrs) × 100 | 85%+ | Planned = 5–8× cheaper than reactive |
| OEE | Availability × Performance × Quality | 85% world-class | 1% OEE = $100K on $10M line |
| WO Completion | (On-time ÷ Total) × 100 | 90%+ | Backlog = asset life reduction |
| PM Compliance | (PMs done ÷ Scheduled) × 100 | 90%+ | 90%+ = 45% fewer critical failures |
| Cost/Work Order | Total cost ÷ WOs completed | $200–$400 (mfg) | $50 saved × 500/mo = $25K/mo |
| Tech Utilisation | (Productive hrs ÷ Available hrs) × 100 | 65–75% | 1–2 hrs/tech/day = $15–$30K/yr |
| Inventory Turnover | Parts consumed ÷ Avg inventory value | > 4× per year | Frees dead MRO stock capital |
| Unplanned Downtime | Sum of unexpected downtime hours | -30% YoY | $800/hr × 200 hrs = $160K/qtr |
Formula: Total repair time ÷ Number of repairs in the period
Target: Industry average is 4–8 hours for most manufacturing environments. World-class teams aim below 2 hours.
ROI link: Every hour shaved off MTTR is an hour of production recovered. If your facility loses $1,200/hour in downtime and you reduce MTTR from 6 hours to 4 hours across 50 breakdowns per year, that is $120,000 returned annually. Cryotos users report a 25% reduction in repair times after implementation — thanks to mobile work order dispatch, technician location tracking, and built-in root cause analysis.
Formula: Total operational time ÷ Number of failures in the period
Target: Higher is always better. Critical production assets should aim for MTBF 3–5× the industry average for that asset class.
ROI link: Doubling MTBF halves your failure frequency. If emergency callouts cost an average of $3,500 each and you reduce failures from 40 to 20 per year, that is $70,000 saved — before accounting for the production revenue those 20 avoided stoppages protect.
Formula: (Planned maintenance hours ÷ Total maintenance hours) × 100
Target: 85% or above. World-class operations run above 90%.
ROI link: Planned maintenance costs 5–8× less than reactive repairs (Plant Engineering). Moving PMP from 60% to 85% converts reactive spend into planned spend — and for every $1 spent on planned maintenance, you avoid $5–8 in emergency repair costs.
Formula: Availability × Performance × Quality (expressed as a percentage)
Target: World-class OEE is 85%. Most manufacturers start around 40–60% and work upward.
ROI link: A 1% OEE improvement on a production line running $10M annually adds $100,000 in output value. OEE is the single most thorough ROI indicator because it combines uptime, speed, and quality into one number.
Formula: (Work orders completed on time ÷ Total work orders created) × 100
Target: 90%+ for a mature maintenance team.
ROI link: Incomplete or late work orders pile into a backlog — missed PMs, compliance gaps, and accelerated asset degradation. Each overdue PM can shorten asset life by months, increasing capital replacement costs.
Formula: (PM tasks completed on schedule ÷ Total PM tasks scheduled) × 100
Target: 90%+ is world-class. Below 80% is where failure rates begin climbing sharply.
ROI link: Organisations with PM compliance above 90% experience 45% fewer critical equipment failures (Reliable Plant). Cryotos automated alerts and calendar scheduling push compliance rates above 90% within the first quarter of implementation.
Formula: Total maintenance costs (labour + parts + overhead) ÷ Total work orders completed
Target: Typical manufacturing facilities aim for $200–$400 per work order. The goal is a consistent downward trend quarter over quarter.
ROI link: This is the one KPI finance teams understand immediately. A $50 reduction in cost per work order across 500 work orders per month is $25,000 saved monthly — $300,000 annually.
Formula: (Productive maintenance hours ÷ Total available technician hours) × 100
Target: 65–75% is realistic and sustainable. Above 80% risks burnout and shortcuts.
ROI link: A CMMS with mobile access, QR code parts lookup, and digital work orders typically recovers 1–2 hours per technician per day — worth $15,000–$30,000 per technician per year in recovered productive time.
Formula: Total parts consumed ÷ Average inventory value held
Target: Aim for turnover above 4× per year for fast-moving MRO parts.
ROI link: Excess MRO inventory is cash sitting on a shelf. A typical mid-size facility carries 20–30% more inventory than needed (Gartner). Cryotos inventory management sets minimum stock thresholds, tracks consumption patterns, and prevents both stockouts and overstocking.
Formula: Sum of all hours assets were down unexpectedly in a given period
Target: A 30% year-on-year reduction is achievable with a CMMS in the first 12 months.
ROI link: If your facility loses $800/hour in downtime and you track 200 unplanned downtime hours per quarter, that is $160,000 per quarter in lost production value. Cryotos reports an average 30% reduction in downtime among its manufacturing customers — translating to $48,000 in recovered production value per quarter.
A 75% PM compliance rate might be acceptable in one industry and a red flag in another. Here are realistic benchmark targets by sector, based on data from the Maintenance Benchmarking Consortium and industry surveys.
| Industry | OEE Target | PM Compliance | MTTR | Cost/Work Order |
|---|---|---|---|---|
| Manufacturing | 75–85% | 88–92% | 2–4 hrs | $200–$350 |
| Healthcare | N/A | 95%+ (regulatory) | < 1 hr (critical) | Near-zero downtime |
| Hospitality/FM | N/A | 80–88% | Per SLA | $150–$280 |
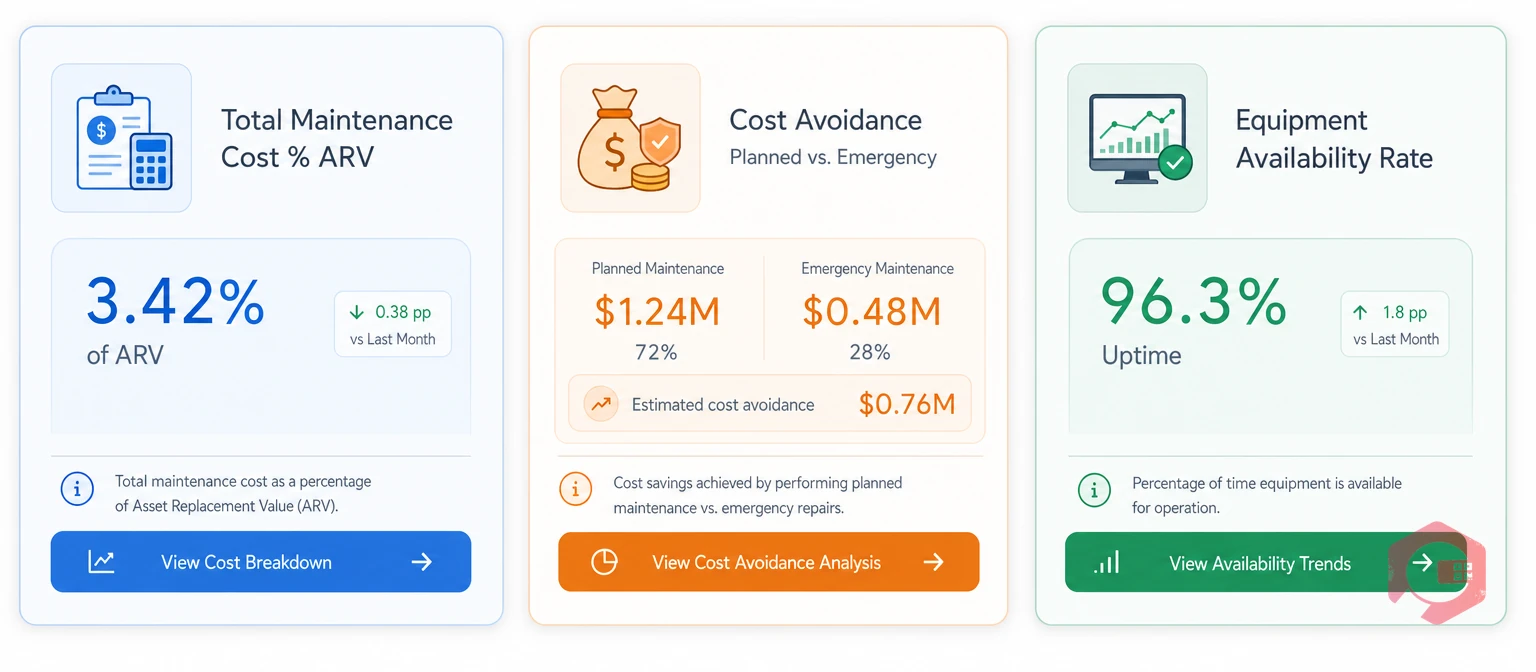
Maintenance managers often track 15-20 KPIs internally. But when you walk into a budget review or a CMMS renewal meeting, most of that detail creates confusion rather than confidence. Finance leaders think in three categories: cost control, asset utilisation, and risk management. Match your CMMS KPI presentation to these three frames.
This single number tells a CFO whether your maintenance programme is proportionate to the value of the assets it protects. World-class maintenance organisations spend 1-3% of ARV annually. If you are spending 5-7%, your CMMS data will help you explain why - and show the plan to bring it down.
Calculate the difference between what emergency repairs actually cost and what scheduled maintenance on those same assets would have cost. A facility that shifted 30% of maintenance work from reactive to planned can typically show $50,000 to $200,000 in annual cost avoidance, depending on asset base size.
Availability = (Total Available Time minus Downtime) divided by Total Available Time x 100. CFOs understand that idle equipment is lost revenue. If your asset management data shows availability climbing from 88% to 94%, that 6-point gain is directly convertible to production hours recovered. Present it in hours and in revenue equivalent, and the conversation shifts from CMMS cost to CMMS payback.
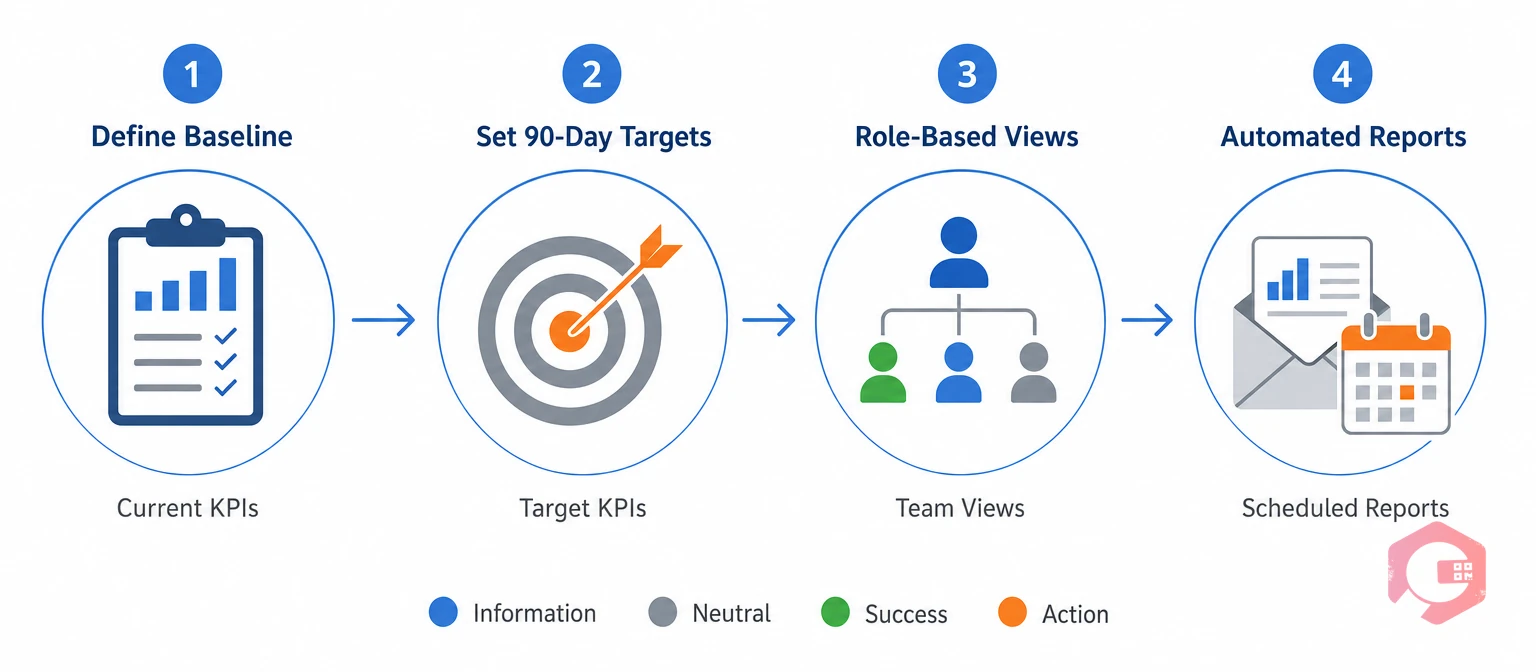
A KPI dashboard is only useful if it shows the right data to the right people at the right time. Here is a practical framework for building one that makes your CMMS investment case automatically, without requiring you to manually compile reports every quarter.
Before your CMMS goes live - or if you are already live, in your first week of serious KPI tracking - document your current state for each of the 10 KPIs above. You cannot prove improvement without a starting point. Export this baseline as a timestamped report and store it.
Do not aim for world-class benchmarks on day one. Set achievable 90-day improvement targets - for example, reduce MTTR from 5 hours to 4 hours or lift PM compliance from 60% to 75%. Achievable targets build momentum and give you early wins to report to leadership.
Technicians need work order status and parts availability. Maintenance managers need PM compliance and work order backlog. Executives need availability rate, cost per work order trends, and downtime cost avoidance. A good CMMS lets you configure role-based dashboard views so each audience sees exactly what they need.
Manual reporting kills the habit of KPI review. Configure your CMMS to email weekly KPI summaries to your maintenance manager and monthly executive summaries to leadership. Automated reports keep KPIs visible without adding administrative burden to your team.
Cryotos CMMS is built around the principle that data should turn automatically into decisions - not sit in spreadsheets waiting to be analysed. Here is how Cryotos handles each of the 10 KPIs above out of the box.
Cryotos also includes 50+ pre-built reports and a custom Report Builder, so you can generate the exact KPI summary your CFO wants without any manual data work. Scheduled reports deliver the numbers to leadership automatically - making your CMMS ROI story tell itself.
According to Cryotos customer data, organisations using the full KPI dashboard suite see an average 30% reduction in downtime and 25% faster repair times within the first six months.
There is no single universal answer, but Planned Maintenance Percentage (PMP) is often cited as the most impactful starting point. It reflects the health of your entire maintenance strategy - high PMP means more work is planned and controlled, which drives down costs, MTTR, and downtime simultaneously.
Start with your baseline KPI data from before CMMS deployment. Then calculate the financial value of improvements: multiply MTTR reduction by your revenue-per-downtime-hour, convert PM compliance gains into avoided emergency repair spend using a 3x cost multiplier for reactive versus planned work, and add the wrench time gain multiplied by average technician hourly cost. Sum these values, subtract your CMMS licence and implementation costs, and divide by total cost.
Start with 5-7 KPIs and add more as your team matures. For most organisations, the highest-value starting stack is MTBF, MTTR, PM Compliance, Work Order Completion Rate, and Cost Per Work Order. These five give you visibility into reliability, responsiveness, discipline, throughput, and cost.
The clearest single signal is PM Compliance Rate. If your CMMS is configured correctly and your team is using it, PM compliance should climb steadily within the first 90 days. A PM compliance rate above 80% after three months of CMMS use is a reliable indicator that the system is working.
Tracking the right CMMS KPIs turns your maintenance software from a scheduling tool into a financial asset. The 10 KPIs in this guide give you the metrics that matter most, the industry benchmarks to calibrate against, and the reporting framework to communicate your results with confidence. If you are ready to see these KPIs in action - automatically tracked, beautifully reported, and connected to every asset, technician, and work order in your operation - explore Cryotos CMMS and request a live demo of the KPI dashboard today.


Cryotos AI predicts failures, automates work orders, and simplifies maintenance—before problems slow you down.


