Energy costs continue to climb across industries - manufacturing plants, commercial buildings, hospitals, and data centres all face growing pressure to reduce consumption without compromising operations. For maintenance and facility managers, the challenge is not just tracking energy use; it is turning raw meter data into decisions that prevent waste, catch anomalies early, and support compliance requirements.
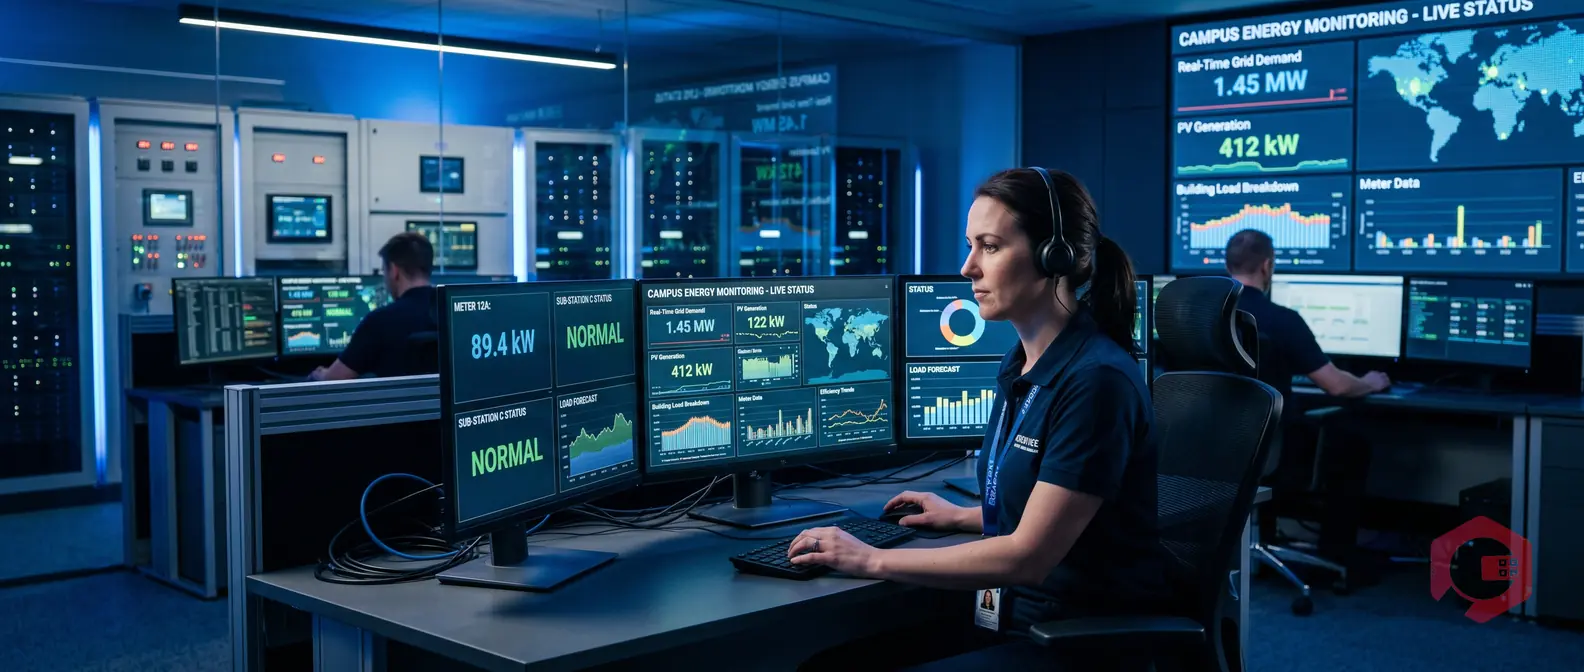
That is where an EMS (Energy Management System) dashboard paired with intelligent alerting makes all the difference. When your dashboard is fed by accurate, timely meter readings, you gain a real-time window into your facility's energy health - not just a monthly utility bill that arrives too late to act on.
Cryotos CMMS brings these capabilities together in one unified platform. Its dedicated Meter Reading module captures readings from electricity, water, gas, and other utility meters, feeding a live dashboard with actionable data and configurable alerts. This guide walks through exactly how the EMS dashboard and alerts work using Cryotos meter reading - and why it should be the backbone of your energy strategy.

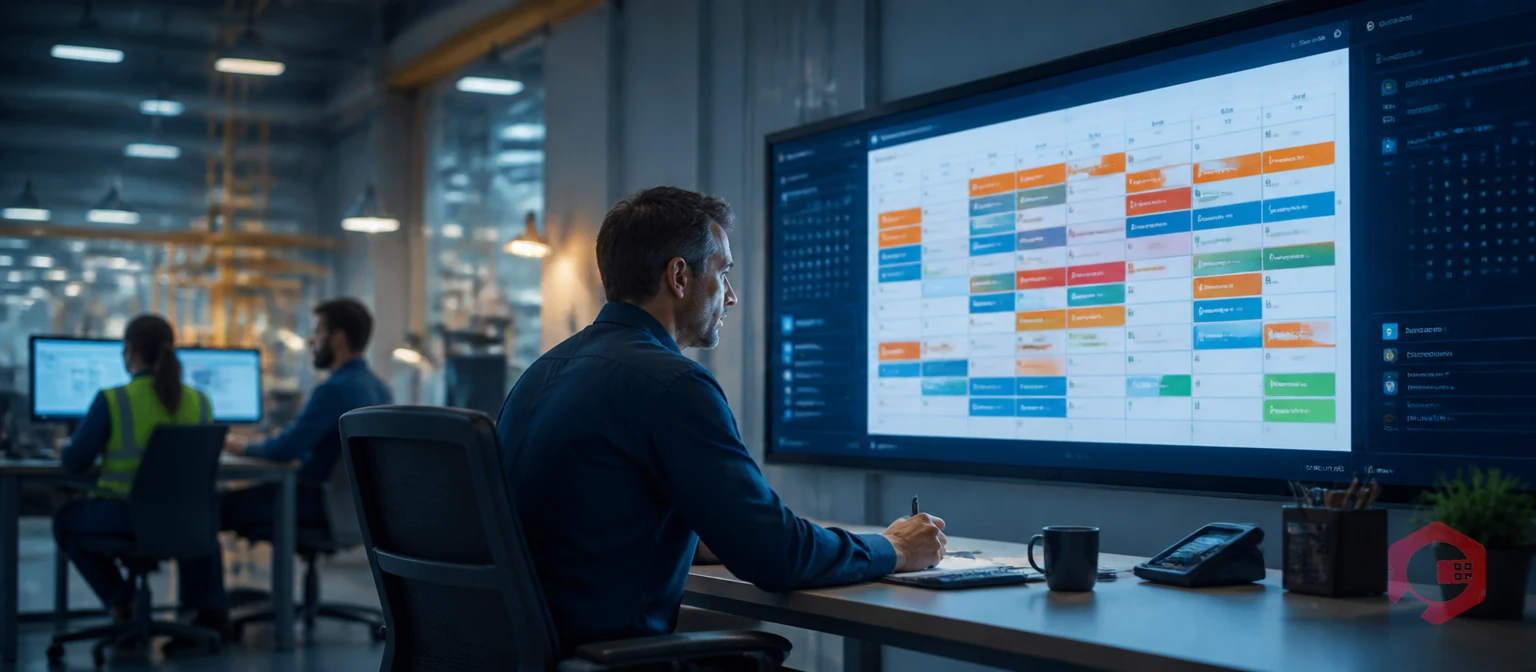
An Energy Management System (EMS) dashboard is a centralised visual interface that aggregates energy consumption data from across a facility - electricity panels, water meters, gas lines, compressed air systems, and more. Rather than manually pulling data from disparate sources, a good EMS dashboard presents everything in a single view: current consumption trends, historical comparisons, cost projections, and threshold breaches.
The value of a well-designed EMS dashboard lies in speed and visibility. According to the International Energy Agency (IEA), commercial and industrial buildings account for nearly 40% of global energy consumption. Organisations that actively monitor and manage energy use typically achieve savings of 10-25% compared to those that do not. But realising those savings requires more than just data collection - it requires a dashboard that converts raw readings into prioritised action.
Without a dashboard, maintenance teams operate reactively: a utility bill spikes, a manager investigates weeks later, and the root cause is long gone. With a live EMS dashboard, anomalies surface in real time. A compressor running at odd hours, a chiller drawing unusually high current, or a water meter logging flow during a planned shutdown - these are the signals that only show up when you are actively watching. Integrating meter reading into your EMS dashboard closes the gap between measurement and action.
Accurate meter reading is the foundation of any credible energy management programme. Without reliable data at the source, dashboard visualisations become meaningless, alerts become noise, and any savings calculations are guesswork. For a broader look at how CMMS platforms handle energy monitoring through dynamic workflows, see our article on energy monitoring in CMMS software through dynamic workflow and automation.
In traditional setups, meter readings are logged manually by technicians who walk the facility on a fixed schedule - weekly, monthly, or even quarterly. This introduces two critical problems: latency (you are always looking at old data) and human error (transposed digits, missed readings, inconsistent timing). Both erode the accuracy of your EMS dashboard and undermine the trust teams place in the numbers they see.
Modern CMMS platforms like Cryotos solve this by digitising the meter reading process end to end. Technicians use the Cryotos mobile app to capture readings on a configured schedule, with GPS tagging, timestamp validation, and the ability to attach photos of the meter display for full audit trails. Readings flow instantly into the system, updating the dashboard in near real time. Cryotos also supports automated meter reading integration via IoT sensors and smart meters, eliminating manual capture entirely for high-frequency monitoring points. Whether your facility uses legacy analogue meters or modern digital sensors, the platform normalises all incoming data into a consistent format that powers your EMS dashboard reliably.

The Cryotos Meter Reading module is purpose-built to collect, validate, and surface energy data across multiple utility types - electricity, water, fuel, steam, and compressed air. Each meter in the facility is registered as an asset within the Cryotos asset management framework, with its own reading schedule, unit of measure, and acceptable value range.
Each meter is configured with a reading frequency - daily, weekly, or at custom intervals. Cryotos automatically generates work orders or inspection tasks for technicians when a reading is due, ensuring nothing falls through the cracks. These tasks are visible on the technician's mobile dashboard, complete with meter location, last recorded value, and any special instructions.
When a technician logs a reading, Cryotos validates it against the configured minimum and maximum range. If a reading falls outside the expected band - for example, a daily electricity reading that is three times the rolling average - the system flags it immediately for supervisor review. This prevents bad data from polluting the EMS dashboard and ensures that alerts triggered downstream are based on real anomalies, not input errors.
Validated readings feed directly into the Cryotos EMS dashboard, updating consumption trend charts, cost tracking graphs, and meter health indicators in real time. Facility managers can view consumption by site, building, floor, or individual meter - enabling granular analysis without the need for external BI tools or spreadsheet exports.
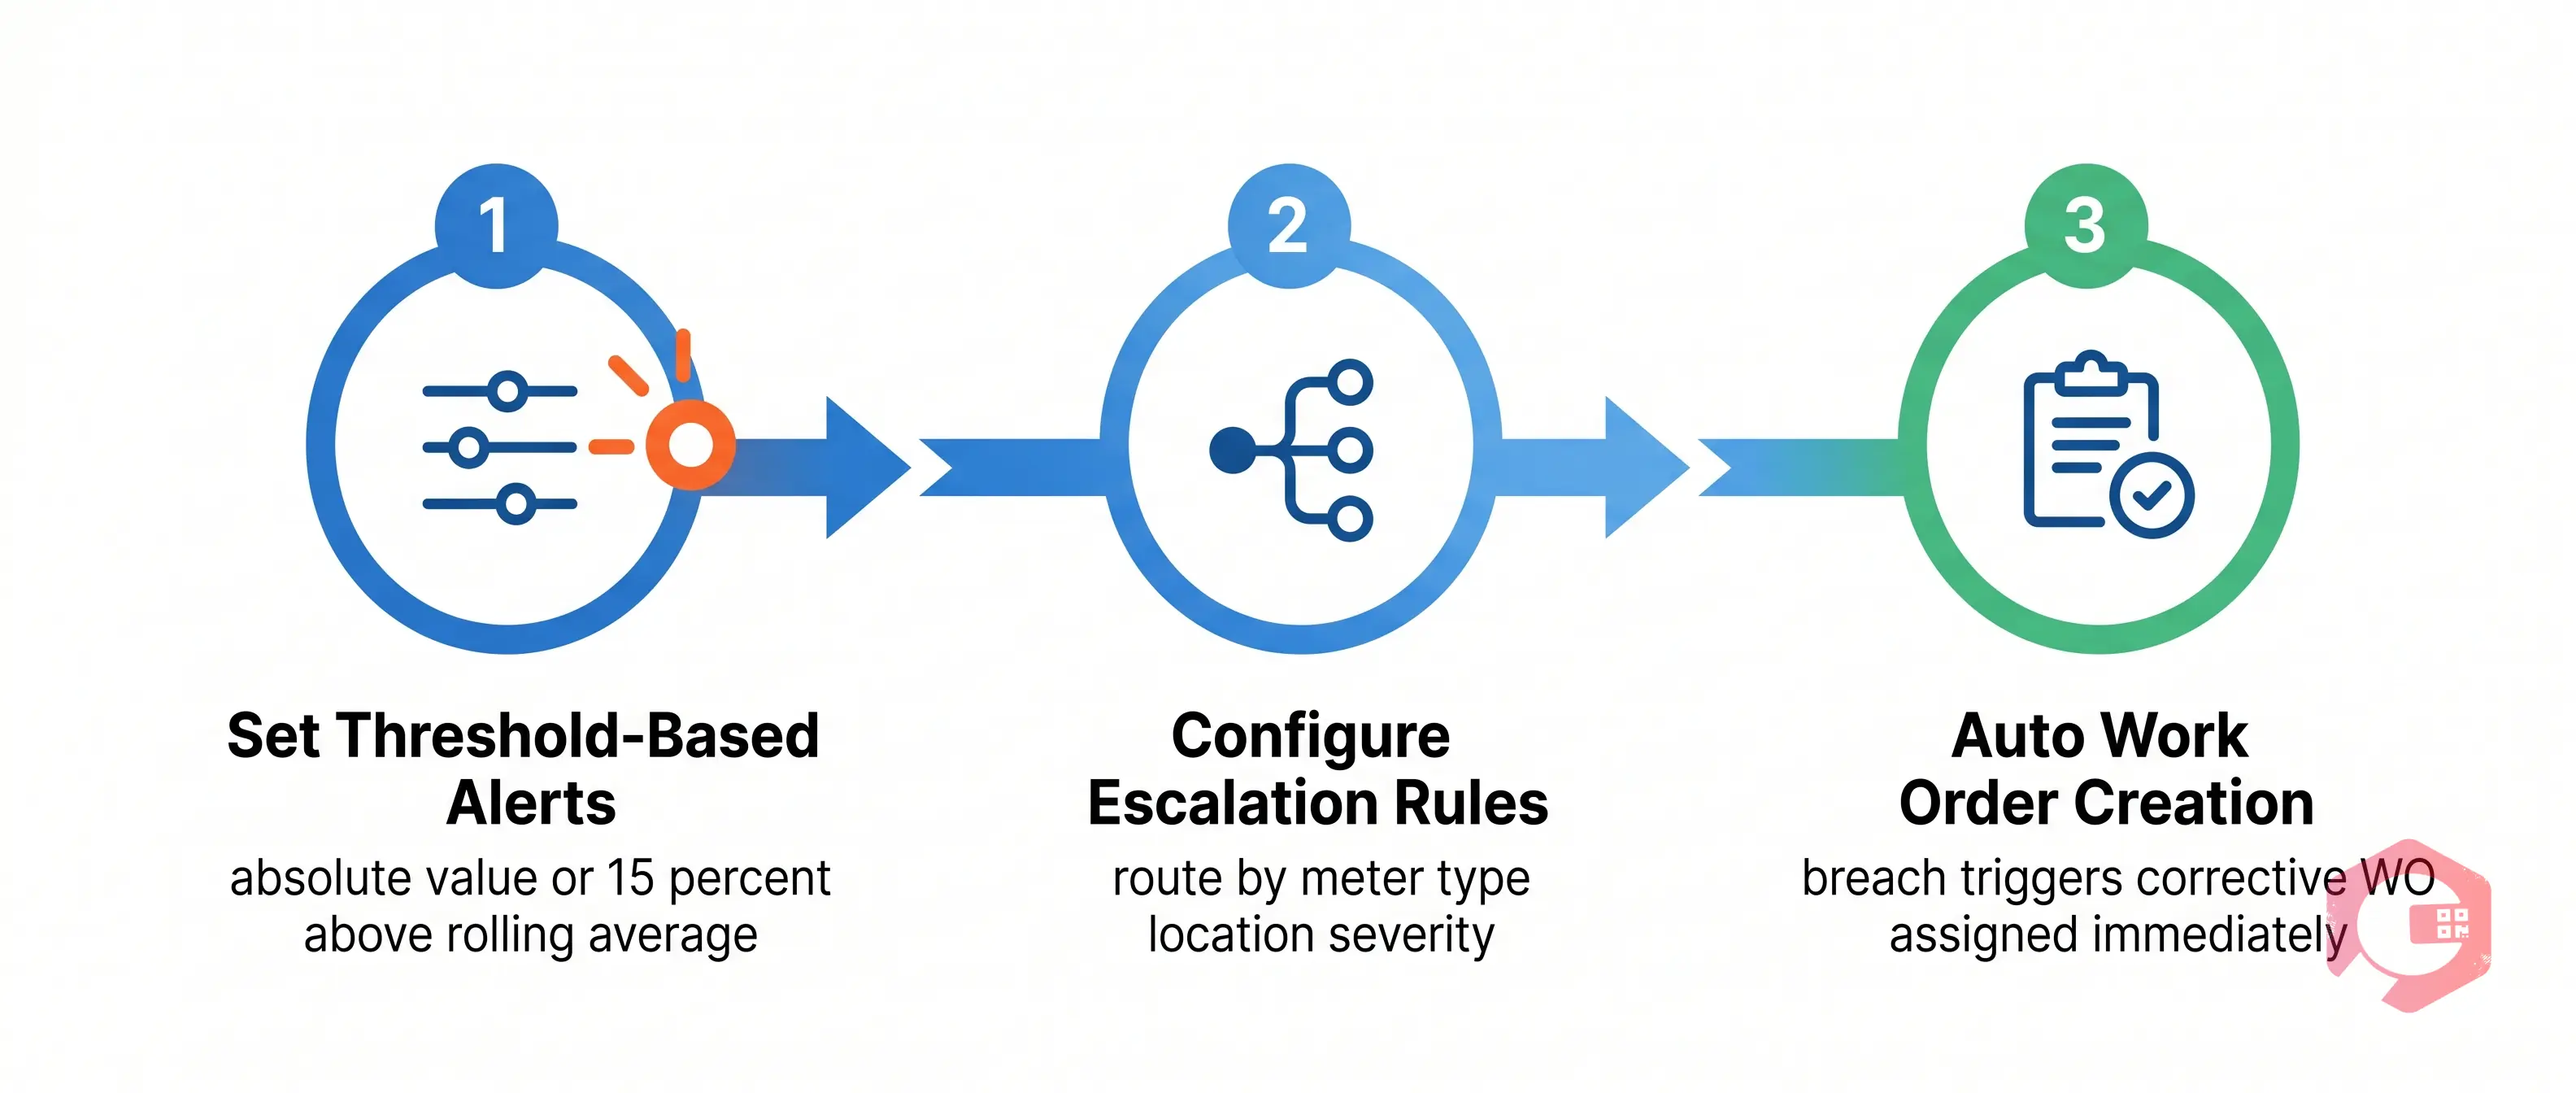
One of the most powerful aspects of the Cryotos EMS module is its configurable alert engine. Rather than waiting for a monthly report to reveal an energy anomaly, alerts deliver notifications the moment a threshold is crossed - giving teams the ability to investigate and act within hours, not weeks.
Cryotos allows facility and energy managers to configure upper and lower thresholds for each meter. When a reading breaches these boundaries, the system automatically triggers an alert. Thresholds can be set as absolute values - for example, daily electricity consumption above 5,000 kWh - or as relative values, such as more than 15% above the 30-day rolling average. This flexibility ensures that alerts are meaningful and context-sensitive, rather than static limits that generate constant false positives.
Alerts in Cryotos can be routed to specific users or teams based on meter type, location, or severity. A water meter breach on the production floor might notify the maintenance supervisor, while an electricity spike in the data centre alerts the facilities head. Multi-level escalation ensures that unacknowledged alerts do not fall through the cracks - if the first recipient does not act within a defined window, the alert escalates automatically to the next level.
Cryotos takes alerting a step further by allowing threshold breaches to automatically create corrective maintenance work orders. When an energy anomaly is detected, a work order is generated, assigned to the appropriate technician, and linked back to the triggering meter reading - creating a complete audit trail from alert to resolution. This integration between energy monitoring and maintenance execution is what sets Cryotos CMMS apart from standalone EMS tools.
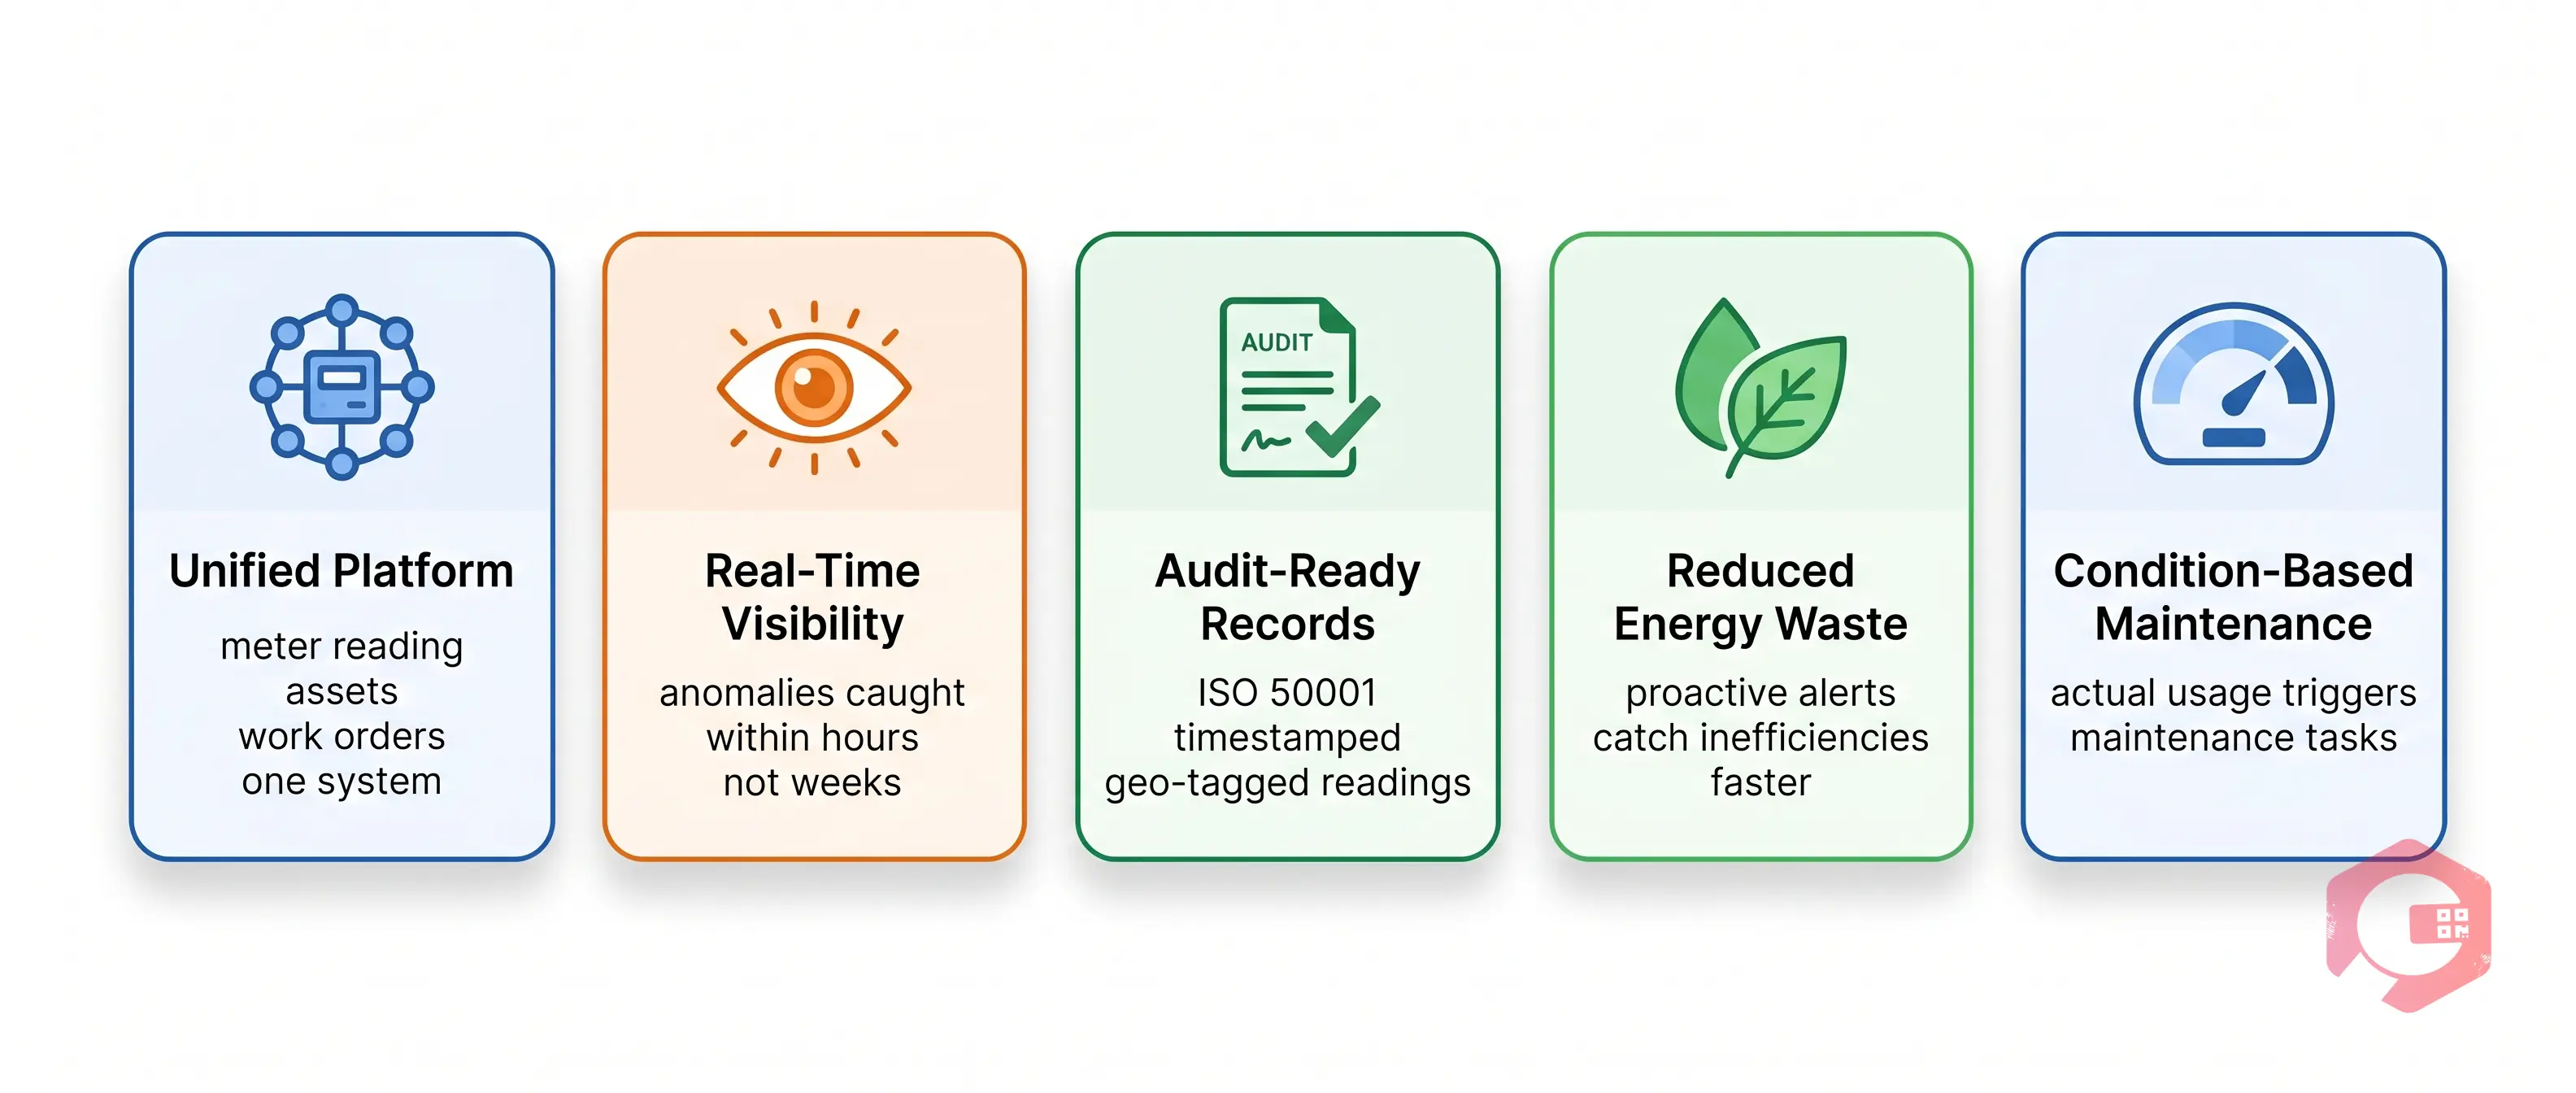
Using Cryotos as the backbone of your EMS dashboard and alert system delivers measurable advantages over standalone energy monitoring tools or manual processes.
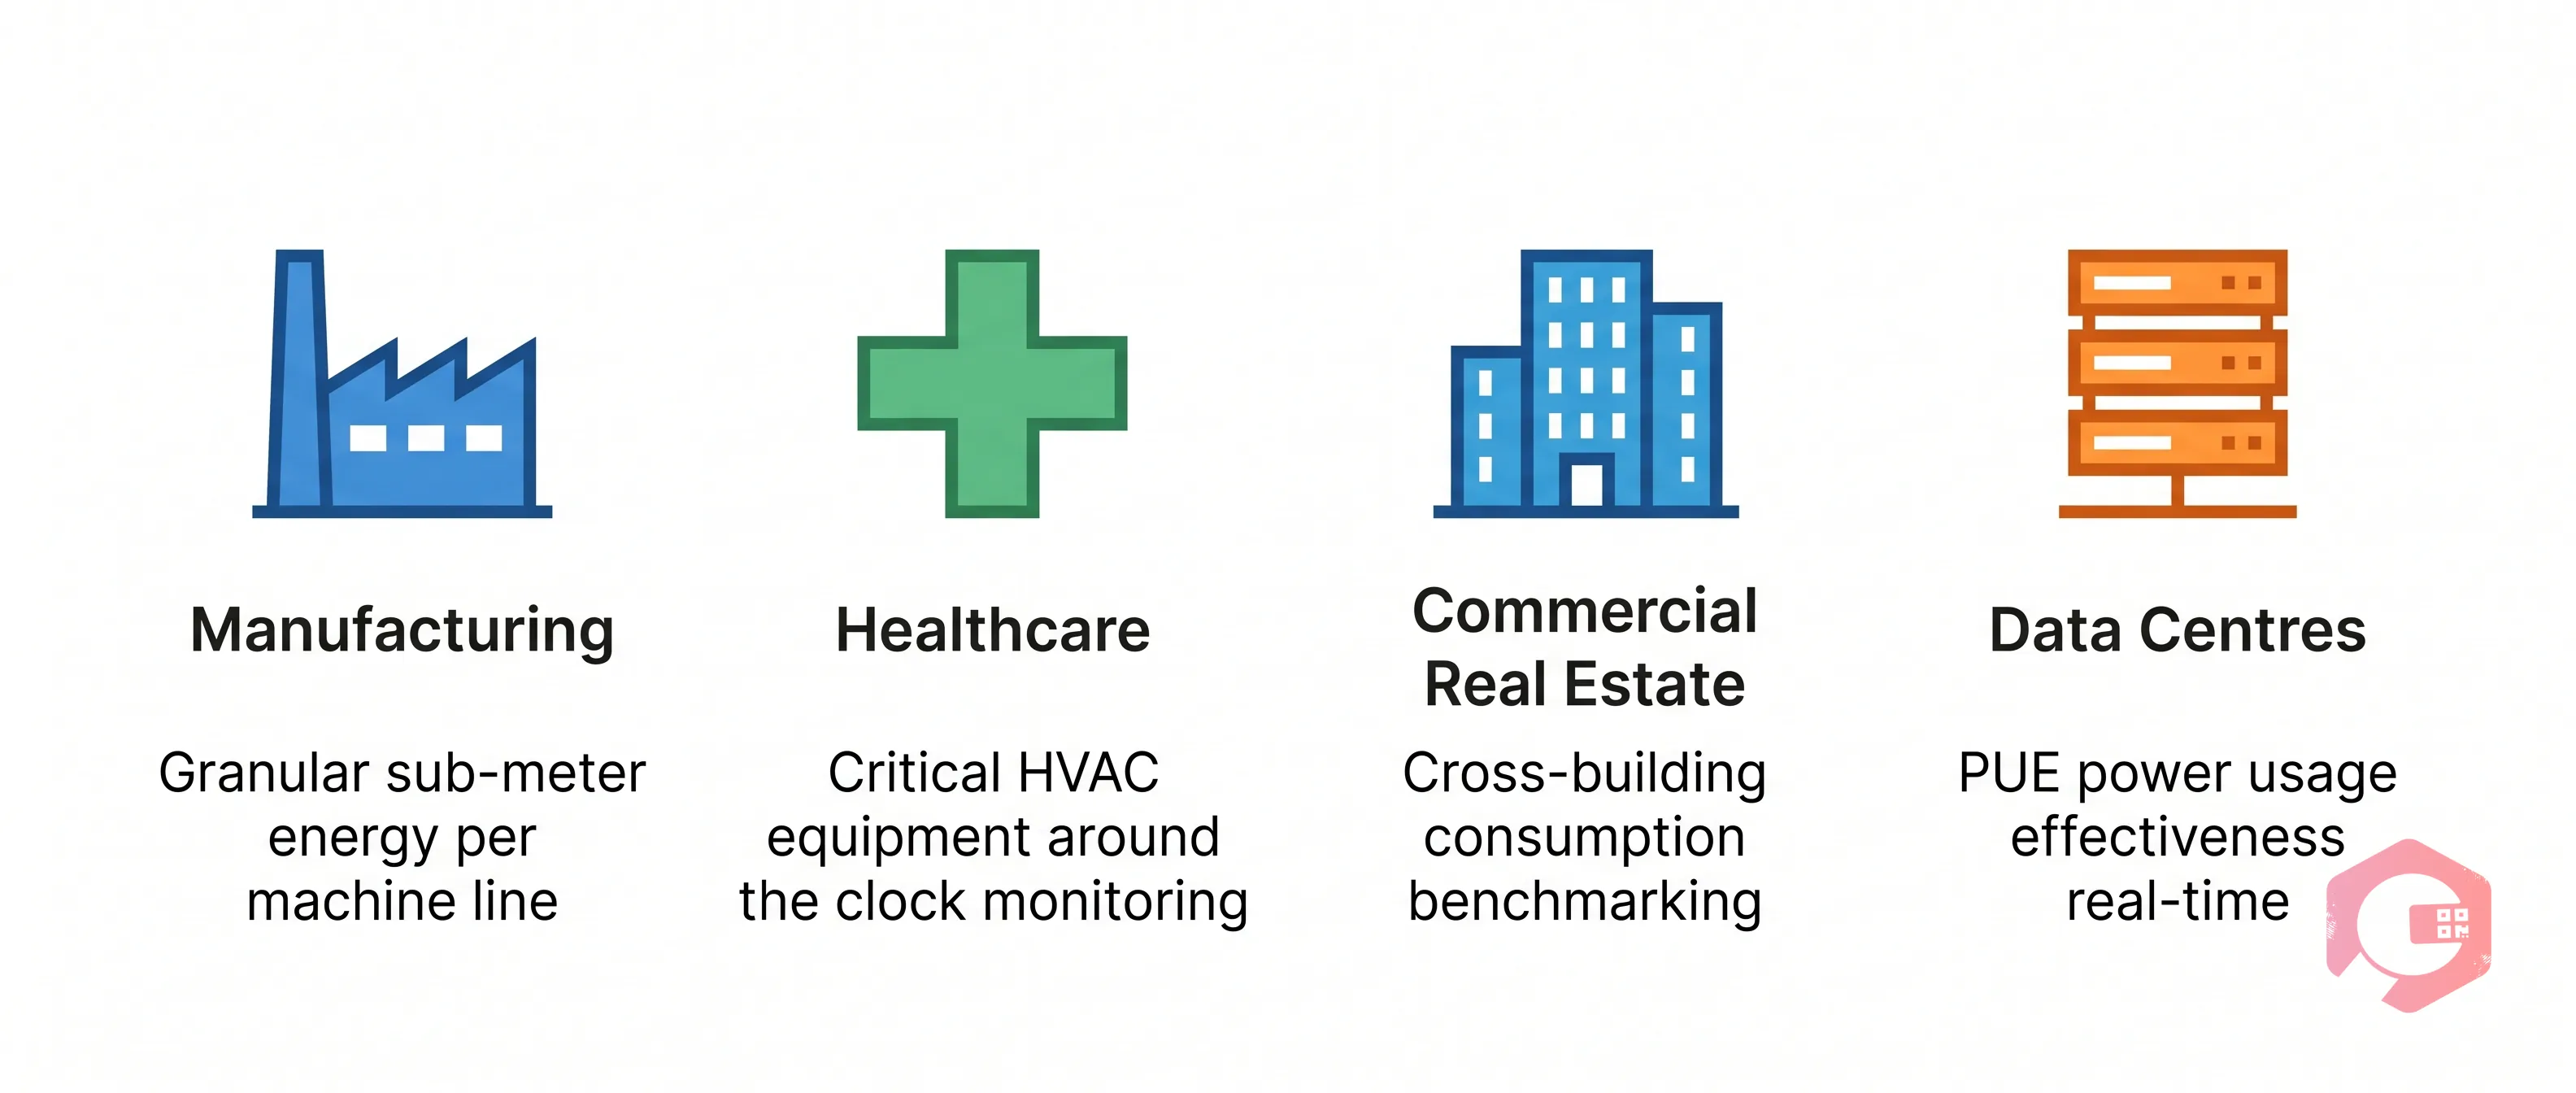
While any facility with utility meters can benefit, certain industries see the greatest return from a robust EMS dashboard paired with Cryotos meter reading and alerts. For industries like solar and renewables, read about how a reliable CMMS is used in the solar and power energy business.
Production facilities often have dozens of sub-meters tracking energy consumption at the machine, line, and plant level. Cryotos enables granular monitoring that ties energy costs directly to production output - helping operations teams identify which processes are most energy-intensive and where efficiency investments will deliver the highest return on investment.
Hospitals run around the clock with critical HVAC, lighting, and medical equipment demands. Energy anomalies can signal equipment failures before they escalate into patient safety issues. Cryotos's alert engine ensures that any unusual consumption pattern triggers immediate investigation, supporting both cost control and operational resilience.
Property managers overseeing multiple buildings benefit from Cryotos's multi-site dashboard view. Consumption benchmarking across properties, automatic alerts for after-hours usage spikes, and streamlined utility reporting make energy management scalable without adding headcount or adopting separate tools for each building.
Power Usage Effectiveness (PUE) is a critical metric for data centre operators. Cryotos meter reading provides the granular consumption data needed to track PUE in real time, with alerts configured to fire when power draw approaches capacity thresholds - enabling proactive load balancing and infrastructure planning.
Building an effective energy management programme starts with getting the data right - and that means investing in a meter reading process that is accurate, consistent, and connected to a live EMS dashboard. The combination of Cryotos's structured Meter Reading module, real-time EMS dashboard, and intelligent alert engine gives maintenance and facility managers the tools they need to stop reacting to energy bills and start proactively managing consumption.
Whether you are looking to cut energy costs, meet sustainability targets, or gain better visibility into your facility's utility usage, Cryotos provides a proven, CMMS-native path forward. Ready to see it in action? Visit Cryotos to schedule a free demo and discover how smarter meter reading can transform your EMS dashboard and alert capabilities today.


Cryotos AI predicts failures, automates work orders, and simplifies maintenance—before problems slow you down.


