
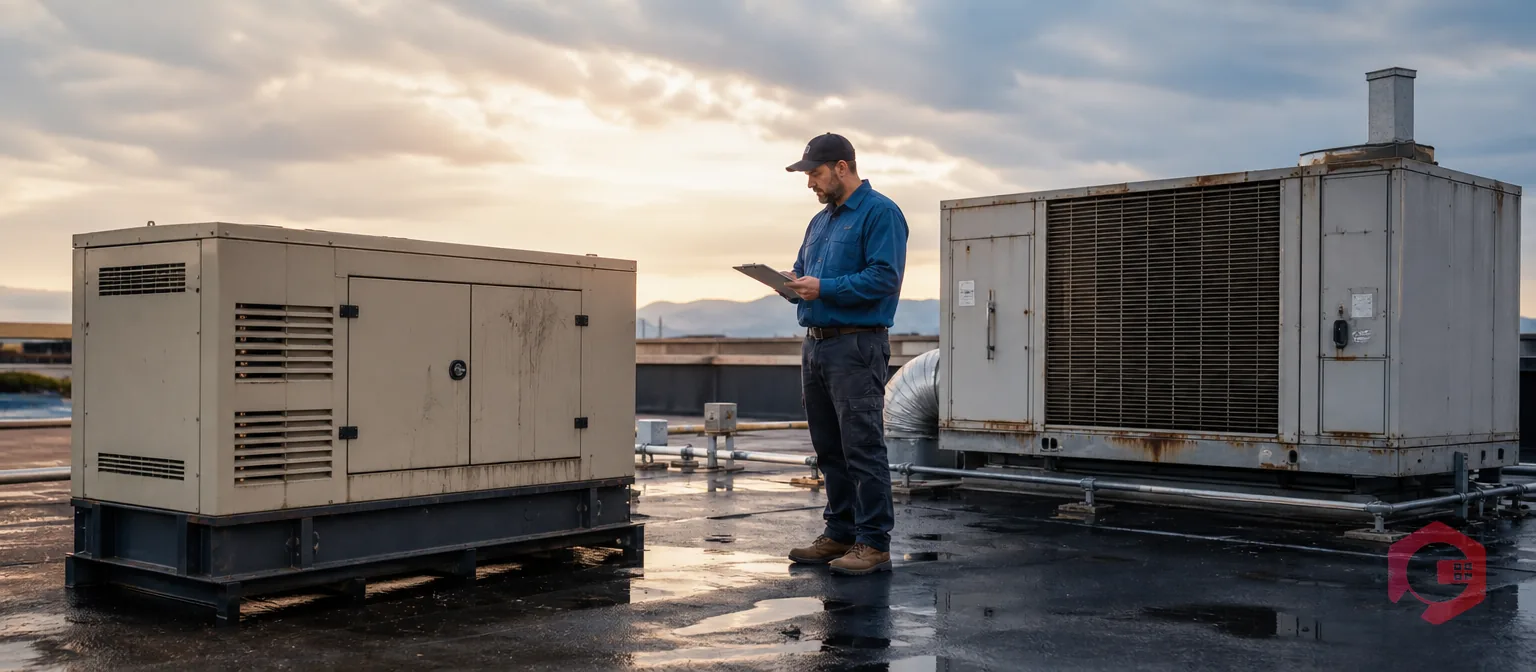
Facility management costs are all the expenses involved in operating, maintaining, and improving a building or portfolio — covering routine repairs, energy bills, staff wages, vendor contracts, and compliance requirements. For most organisations, FM costs run between $8 and $15 per square foot per year for commercial office buildings and $4 to $10 for industrial facilities, according to benchmarking data published by the International Facility Management Association (IFMA) and BOMA International.
The challenge is not the size of the bill — it is the lack of visibility into where it comes from. FM teams that track costs at the category level consistently find 15–30% reduction opportunities hiding in reactive maintenance premiums, vendor contract overlap, and inventory waste. This guide gives you a complete framework: what facility management costs consist of, how to benchmark your spend, and the six strategies that deliver the fastest savings in 2026.
Key Takeaways

Before you can reduce costs, you need to know where the money goes. Every FM budget breaks down into six core categories. The split varies by building type and age, but the categories are consistent across every FM operation.
Without benchmarks, a budget is just a number someone approved last year. The two most widely used FM benchmarking frameworks are cost per square foot (published annually by IFMA and BOMA International) and percentage of Facility Replacement Asset Value (RAV).
The RAV rule is the most practical for internal benchmarking: spend 2–4% of your facility's replacement asset value on maintenance and operations per year. Below 2% typically means deferred maintenance is accumulating — future repair costs are building up invisibly. Above 4% usually means reactive maintenance is dominant — you are paying emergency premiums instead of running scheduled work.
| Building Type | FM Cost ($/sq ft/yr) | Maintenance % of Total FM | Energy % of Total FM |
|---|---|---|---|
| Class A Office | $10–$15 | 28–35% | 22–28% |
| Class B/C Office | $7–$11 | 30–38% | 24–30% |
| Industrial / Manufacturing | $4–$8 | 35–45% | 20–30% |
| Healthcare / Hospital | $15–$25 | 30–40% | 18–24% |
| Retail | $6–$10 | 25–32% | 28–35% |
| Education | $5–$9 | 30–38% | 22–28% |
When you benchmark your own costs, compare at the category level — not just total spend. A facility that looks on-budget overall might be 40% above benchmark on maintenance while 15% below on energy, masking a serious reactive maintenance problem with energy savings.
Use the MTBF Calculator to establish your asset failure frequency baseline — the starting point for any meaningful maintenance cost benchmarking exercise.

The visible line items — energy, labour, contracts — are straightforward to track. The hidden costs are where FM budgets quietly collapse. These are the ones that do not show up as a single line in your ledger but compound silently across every month.
A credible FM budget is built bottom-up from asset data and historical spend — not top-down from last year's number with an inflation adjustment. Here is the four-step process that gives you a defensible, accurate budget that leadership will approve.
Pull 12–24 months of actual spend across all six cost categories. Break it down to cost-per-asset and cost-per-square-foot. The goal is to identify which category is driving variance and which assets are consuming disproportionate maintenance budget. Your work order history is the primary data source for this — if your CMMS captures costs per work order, you can generate this breakdown in minutes rather than manually reconciling invoices.
Compare your per-square-foot costs to IFMA and BOMA benchmarks for your building type. Anything 20% or more above benchmark in a single category is your first priority for cost investigation. Do not benchmark against your own prior-year spend — prior-year spend is just last year's inefficiencies, compounded. External benchmarks tell you what well-run facilities of your type actually spend.
Track at least four FM cost KPIs monthly: PM compliance rate (target ≥90%), reactive-to-planned maintenance ratio (target ≤30% reactive), cost per work order, and energy cost per square foot. Each KPI has a direct link to a cost category — a declining PM compliance rate predicts rising reactive spend within 60–90 days. Build a contingency reserve of 10–15% of your total maintenance budget for unforeseeable events. Facilities without a contingency buffer inevitably raid planned maintenance budgets during emergencies — which makes the next emergency more likely.
Leadership approves FM budgets more readily when requests are framed around business risk rather than operational need. "This £50,000 HVAC preventive maintenance programme prevents an estimated £200,000 in emergency repairs and production downtime over three years" is a more compelling case than "we need £50,000 for HVAC maintenance." The BI Dashboard in Cryotos generates the cost trend and downtime reports that make this ROI case with actual facility data — not estimates.
These six strategies are ranked by typical speed of impact — the first two deliver results within 90 days, the others within 6–12 months.
Reactive maintenance is the most expensive way to maintain any asset. The labour premium for emergency callouts, combined with unplanned downtime costs and expedited parts procurement, makes every reactive job cost 3–5× more than the same job done on a schedule. Moving your top 20 highest-cost assets from reactive to preventive maintenance typically reduces total maintenance spend by 20–30% within 12 months — without touching headcount or vendor rates.
The starting point is your reactive-to-planned ratio. If more than 30% of your work orders are reactive, maintenance is costing significantly more than it should. Cryotos preventive maintenance software automates PM scheduling based on calendar intervals, runtime hours, or IoT sensor thresholds — so planned tasks run without requiring planners to manually trigger them.
Manual work order management — spreadsheets, email threads, paper job cards — creates invisible waste at every step: duplicated jobs, missed follow-ups, parts ordered twice, technician time spent waiting for approvals instead of working. A facility management CMMS eliminates this waste by centralising work order creation, assignment, tracking, and closure in a single system accessible from mobile devices in the field.
FM teams using a CMMS typically recover 15–20% of technician productive time — time previously lost to administrative overhead and coordination delays. At a fully-loaded technician cost of £50,000 per year, recovering 15% of productive time is worth £7,500 per technician annually, before any savings on parts or vendor costs.
Most FM operations with multiple sites or a large building portfolio are paying market rates for services that should attract volume pricing. Consolidating specialist maintenance categories — HVAC, electrical testing, plumbing — to fewer, higher-volume preferred suppliers typically yields 10–15% cost reductions through volume discounts, simplified contract management, and stronger SLA accountability.
Before renegotiating, extract your total spend per vendor category from your CMMS work order history. This gives you a factual basis for volume pricing discussions — and often reveals that you have five contractors doing similar work in the same building, none of whom know about the others.
You cannot manage what you do not measure. Mean Time To Repair (MTTR) and Mean Time Between Failures (MTBF) tell you which assets are costing the most money and why. A high MTTR on a specific asset indicates either a parts availability problem, a technician skill gap, or an asset that needs replacing rather than repairing. A declining MTBF trend on an asset predicts increasing repair frequency — and gives you advance warning to plan either a capital replacement or an intensified PM programme before costs escalate.
Cryotos downtime tracking captures every stoppage event, calculates MTTR and MTBF automatically per asset, and surfaces trending assets through the BI Dashboard — giving maintenance managers the data to make cost-driven decisions rather than reacting to the loudest complaint of the day.
Spare parts inventory is one of the most consistently over- and under-managed cost areas in FM. Overstocked shelves tie up capital in components that sit unused for years. Understocked critical parts cause repair delays that extend downtime and generate emergency procurement costs. The fix is automated minimum-threshold alerts and consumption-based reordering — not manual stocktakes.
Cryotos inventory management tracks every part issued against a work order, automatically alerts when stock falls below minimum thresholds, and provides consumption history per asset to inform reorder quantities. FM teams that implement automated parts management consistently reduce inventory carrying costs by 20–25% while reducing parts-related repair delays.
CapEx decisions made without asset data produce two predictable errors: replacing assets too early (wasting capital on equipment that had remaining useful life) or replacing them too late (paying escalating repair costs on assets that should have been replaced two years ago). Asset lifecycle data from your CMMS — total repair cost over the asset's life, current MTBF trend, maintenance cost as a percentage of replacement value — gives you an evidence-based basis for every replacement decision.
The standard rule: when annual maintenance cost on an asset exceeds 50% of its replacement value, replacement is almost always more economical than continued repair. Without lifecycle data, this calculation is impossible to make accurately.

Every cost reduction strategy in this guide requires one foundational capability: visibility into what is actually happening across your assets, work orders, inventory, and vendor activity. That is what a CMMS provides — and why FM teams without one consistently spend more than those with one, even when running the same maintenance strategies on paper.
Maintenance teams using Cryotos report a 30% reduction in unplanned downtime and 25% faster mean time to repair — outcomes that directly translate into lower FM operating costs across every category in your budget.
Typical FM operating costs run $8–$15 per square foot per year for commercial office buildings and $4–$10 for industrial facilities, based on IFMA and BOMA benchmarking data. Healthcare facilities run higher at $15–$25 per square foot due to regulatory requirements and specialist maintenance needs. These figures cover all FM cost categories — maintenance, energy, labour, contracts, and compliance — and vary significantly based on building age, location, and operational intensity.
The three fastest wins are: (1) audit your vendor contracts for consolidation opportunities — most FM portfolios are paying market rate for services that should attract volume pricing; (2) shift your top 10 highest-cost assets from reactive to scheduled preventive maintenance — this alone typically reduces maintenance spend by 15–20% within 90 days; and (3) implement a CMMS to eliminate work order coordination waste and get visibility into where your maintenance budget is actually going.
The industry standard is 2–4% of Facility Replacement Asset Value (RAV) per year for maintenance and operations spend. Spending below 2% RAV consistently leads to deferred maintenance accumulation — where visible costs appear low but the facility is deteriorating and future repair bills are growing. Spending above 4% RAV typically signals that reactive maintenance is dominant, with emergency repair premiums inflating every maintenance job.
Track four KPIs monthly: PM compliance rate (percentage of planned maintenance tasks completed on schedule — target ≥90%), reactive-to-planned maintenance ratio (target ≤30% reactive), cost per work order (broken down by asset and category), and energy cost per square foot. These four metrics give you early warning of cost overruns — a declining PM compliance rate predicts rising reactive spend within 60–90 days, before it appears in the budget.
A CMMS reduces FM costs through four mechanisms: automating PM scheduling so planned work happens consistently rather than being manually triggered; creating a complete cost record per asset so CapEx decisions are data-driven; integrating inventory management to eliminate parts stockouts and overstock; and tracking vendor SLA performance to support contract renegotiation. FM teams using a CMMS consistently report 20–30% reductions in maintenance spend within 12 months — primarily from the shift in reactive-to-planned ratio that automated PM scheduling delivers.
Facility management costs are controllable — but only when you have the data to see where they come from and the tools to act on them systematically. Schedule a free demo to see how Cryotos gives your FM team the visibility, automation, and reporting to reduce operating costs without reducing service quality.


Cryotos AI predicts failures, automates work orders, and simplifies maintenance—before problems slow you down.


