

Fault tree analysis in maintenance (FTA) is a top-down, deductive method for mapping every possible path to a specific equipment failure — so you can eliminate those paths before the failure occurs. Starting from a clearly defined undesired event (the "top event"), such as "conveyor stops unexpectedly" or "pump fails to deliver pressure," an FTA works backward through logical relationships to every contributing cause: worn components, failed sensors, skipped inspections, or operator errors.
Originally developed in 1962 by Bell Labs for the US Air Force's Minuteman missile program, FTA is now codified under IEC 61025 and used across nuclear, aerospace, chemical, and heavy industrial maintenance. This guide covers what fault tree analysis in maintenance looks like in practice, how it compares to FMEA, how to build one step by step, and how to connect findings to your Computerized Maintenance Management System for measurable failure prevention.
Key Takeaways
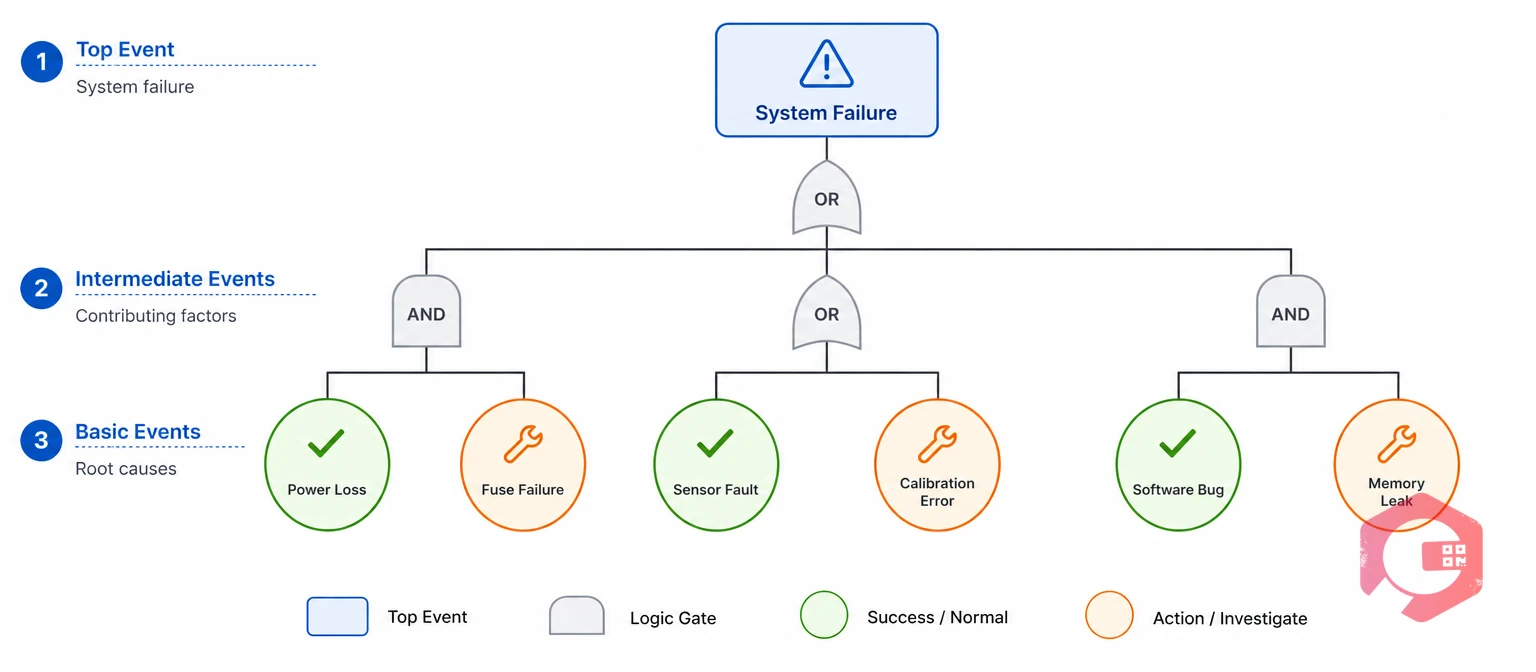
Fault tree analysis (FTA) is a structured, diagram-based reliability tool that identifies all possible causes of a specific equipment failure by working backward from the failure event through a logical tree of contributing factors. Each branch of the tree represents a cause; each node uses a logic gate (AND or OR) to show how causes combine to produce the event above them. Applying fault tree analysis in maintenance gives teams a structured, defensible reason for every PM task on their schedule.
Unlike reactive troubleshooting — where you diagnose after a breakdown — FTA is proactive. You run it before failures occur, using historical failure data, engineering schematics, and operator knowledge to map the full risk profile for a critical asset.
Bell Telephone Laboratories engineer H.A. Watson developed FTA in 1962 to analyze the reliability of the Minuteman intercontinental ballistic missile's launch control system. Boeing refined it further, and by the 1970s, the nuclear industry had adopted FTA as a mandatory safety analysis tool following events like the Three Mile Island accident. Today, it sits alongside root cause analysis, RCM, and FMEA as a core reliability engineering method, recognised by ASQ as a fundamental quality and safety tool.
The output of an FTA is a fault tree diagram — a visual, hierarchical map with the top event at the apex and basic events (individual component failures or human errors) at the leaves. Between them sit intermediate events connected by AND and OR gates.
A quantitative FTA also calculates probability. If a valve has a failure rate of 0.002 failures/hour and a motor has 0.001 failures/hour, and they are connected by an AND gate, the combined probability is the product of both rates — giving you data to justify inspection frequency changes.
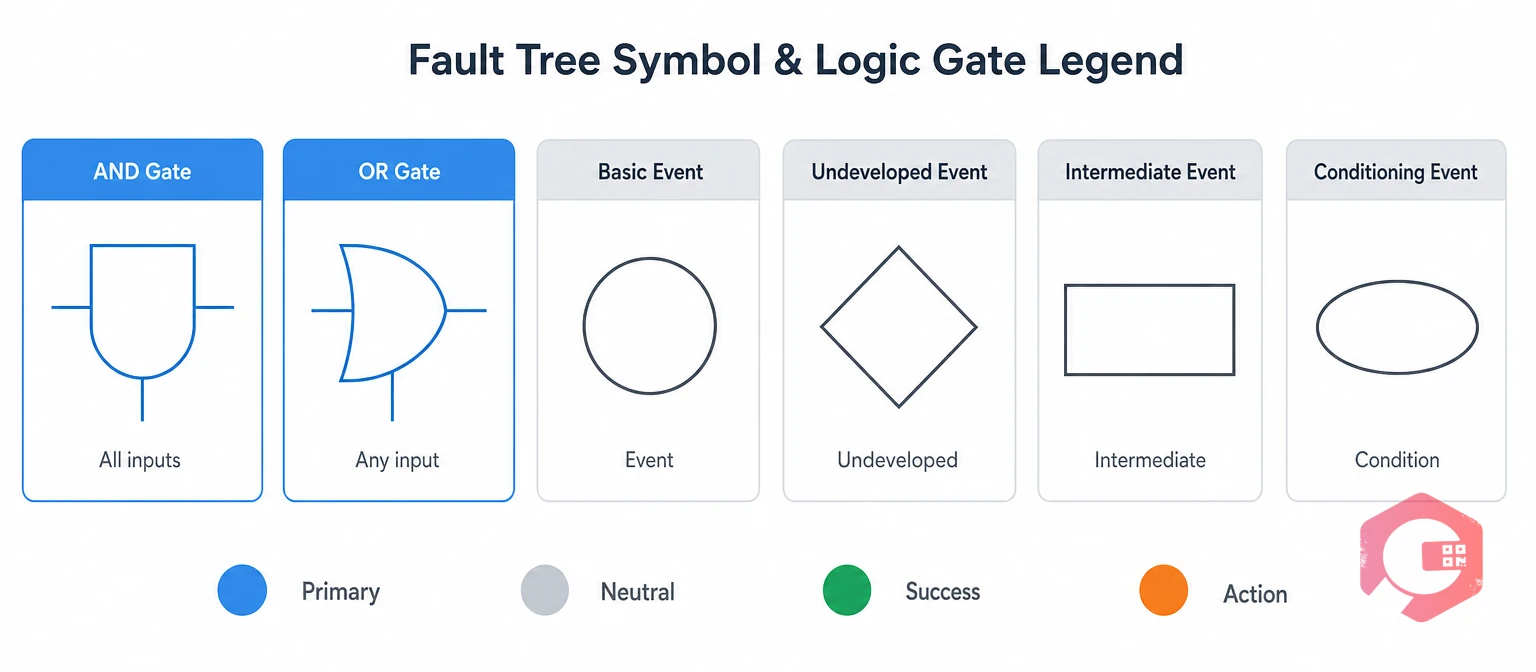
Reading a fault tree requires understanding its symbols. Every diagram uses a standard set drawn from IEC 61025, and knowing what each one means is the difference between a working analysis and a wall decoration.
Maintenance teams working without dedicated fault tree software often build trees in Visio, Lucidchart, or Excel. Purpose-built tools like Isograph FaultTree+ or Relyence can calculate cut sets and failure probabilities automatically, saving hours of manual arithmetic.
FTA and FMEA are both failure analysis tools, but they work in opposite directions and answer different questions. FTA asks "what causes this specific failure?" FMEA asks "what failures can this component cause?" Understanding the difference helps you choose the right tool — or use both together.
| Attribute | Fault Tree Analysis (FTA) | FMEA (Failure Mode & Effects Analysis) |
|---|---|---|
| Analysis direction | Top-down (deductive) | Bottom-up (inductive) |
| Starting point | A specific undesired failure event | Each component's individual failure modes |
| Best for | Complex system failures, safety-critical events | Component-level coverage, design review |
| Output | Fault tree diagram, minimal cut sets | FMEA table with RPN scores |
| Quantitative? | Yes — failure probability per path | Yes — RPN (Severity × Occurrence × Detection) |
| Industry standard | IEC 61025 | IEC 60812 / AIAG FMEA-4 |
| CMMS integration | Work orders for critical cut sets, PM triggers | Risk register, PM checklist by failure mode |
Use FTA when you have a specific high-consequence failure event you need to prevent — a press that could injure an operator, a chiller that keeps tripping, a packaging line that loses batches. FTA is also the right tool when multiple failures interact: you need to see which combinations of two or three simultaneous faults are actually dangerous.
Use FMEA when you are systematically reviewing a new piece of equipment, a new process, or a revised design. FMEA ensures you have not missed any failure mode across all components, not just the ones you already suspect. The best reliability programs run FMEA first to catalogue failure modes, then use FTA on the highest-risk events that FMEA surfaces. The 5 Whys technique complements both — it drills into individual basic events once the tree has identified the critical path.
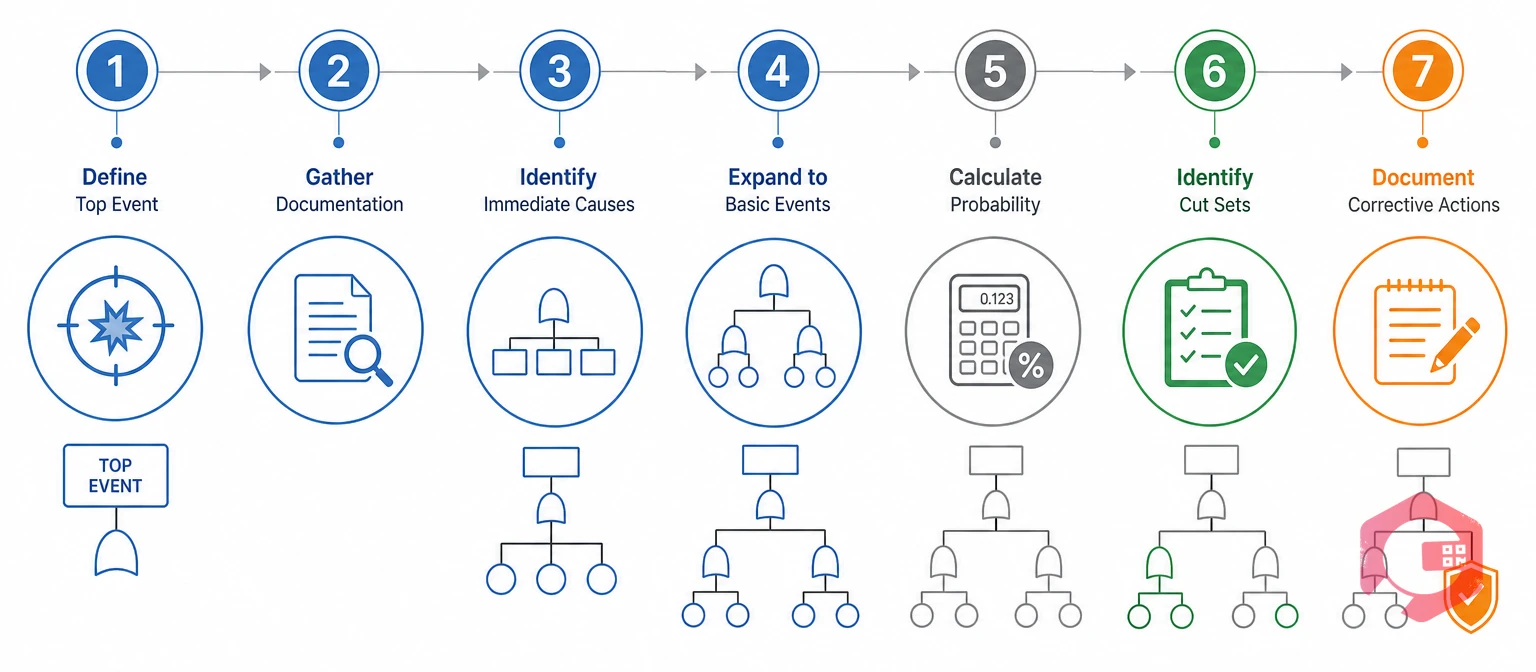
A fault tree analysis for a production asset typically takes one to three working days for a cross-functional team. The quality of the output depends almost entirely on how precisely you define the top event and how well you gather system knowledge before you start drawing.
The top event must be specific, observable, and failure-focused. "Motor fails" is too vague. "Drive motor on Line 3 conveyor stops during production shift" is right. A precise definition keeps the tree from sprawling into an unmanageable diagram. Involve operators — they often know the exact failure mode that causes production loss.
Collect P&IDs, electrical schematics, maintenance records, OEM manuals, and any previous incident reports. Historical failure data from your root cause analysis investigation checklist is particularly valuable: it tells you which basic events have actually occurred before, giving you real frequency data rather than estimates.
Ask: "What events, in isolation or combination, directly cause the top event?" List these as the first level of the tree. Apply AND or OR gates based on the physics: does any single cause suffice (OR), or must multiple failures coincide (AND)?
For each intermediate event, repeat the process. Ask what causes it. Keep expanding until you reach events that need no further breakdown — basic events like "bearing fails," "relay contacts weld shut," or "operator bypasses interlock." Each basic event should be something you can directly measure, inspect, or prevent.
For quantitative FTA, assign a failure rate to each basic event using historical maintenance data, OEM specifications, or industry databases (MIL-HDBK-217, OREDA). Propagate probabilities up through the tree: OR gates add probabilities (approximately), AND gates multiply them. The result is a calculated top event probability per operating hour or per year.
A minimal cut set is the smallest group of basic events that, if they all fail simultaneously, will cause the top event. Single-event cut sets (where one failure alone triggers the top event) are your highest-priority maintenance actions. Two- and three-event cut sets represent secondary priorities. Most fault tree software identifies cut sets automatically; manual methods use Boolean algebra.
For every minimal cut set, assign a corrective action: adjust inspection frequency, add a redundant component, install condition monitoring, or update an operator procedure. Document who owns each action, with a due date. The FTA is not complete until every single-event cut set has a countermeasure assigned.
Calculate your equipment failure rate to get the data you need for a quantitative FTA — knowing your current failure rate per hour or per cycle makes Step 5 significantly faster and more accurate.

Running a one-time FTA is useful. Building a system where fault tree analysis in maintenance continuously improves your PM program is transformative. The TRACE Framework is a five-stage method for doing exactly that, designed for maintenance teams who do not have dedicated reliability engineers on staff.
Target: Identify which assets and failure modes deserve a fault tree analysis. Not every piece of equipment warrants a full FTA. Focus on assets where failure causes: significant production downtime, safety hazards, regulatory non-compliance, or high repair costs. A criticality ranking exercise — scoring each asset on consequence × frequency — produces a shortlist. Start with the top three to five assets on that list.
Root: Build the fault tree with the full cross-functional team. Involve the maintenance technicians who service the equipment, the operators who run it daily, and the engineers who designed the process. Each group sees failure through a different lens. Technicians know what physically fails first; operators know what behaviors precede failures; engineers know the system interdependencies. A tree built by one person in isolation misses half the branches.
Analyze: Calculate failure probability and identify your minimal cut sets. Even a rough qualitative ranking (High / Medium / Low likelihood for each basic event) gives you enough information to prioritize corrective actions. If you have historical maintenance records in a CMMS, pull the actual failure frequency for each component — this turns a qualitative analysis into a quantitative one with far more actionable output. Flag all single-event cut sets as immediate action items.
Control: Assign a specific corrective action to every critical cut set. Each action gets an owner, a deadline, and a budget code. Actions fall into four types:
Embed: Integrate every corrective action into your maintenance management system so it actually gets done. Create work orders for one-time fixes. Add recurring tasks to preventive maintenance software schedules, driven by the inspection frequencies the FTA recommends. Store the fault tree diagram in your asset's document management record. Set a review trigger — every six months, or after any actual failure — so the tree stays current as the system evolves.
Most preventive maintenance programs are built on OEM recommendations and collective experience. Fault tree analysis in maintenance gives you a third, more precise data source: a map of which failure paths are actually critical, so you focus PM resources where they reduce the most risk.
A standard OEM recommendation might say "inspect bearing every 1,000 operating hours." But if your FTA shows that a bearing failure is a single-event cut set — meaning bearing failure alone causes the top event — you have a strong quantitative case for increasing that to every 500 hours, or for adding continuous vibration monitoring between manual inspections.
Conversely, components that appear only in multi-event cut sets (requiring two or three simultaneous failures) may not need more frequent PM. The FTA tells you it is acceptable to inspect those at the OEM-recommended interval and redirect the saved labour hours to higher-risk components. This is the kind of risk-based maintenance optimization that the Society for Maintenance & Reliability Professionals (SMRP) advocates as a core competency for modern maintenance teams.
FTA also informs your spare parts strategy. Components that appear in single-event cut sets should be stocked on-site — their failure alone stops production, so waiting for a supplier is not acceptable. Components in multi-event cut sets can often be managed with longer lead times. This is a direct, data-driven input into your MRO inventory planning, reducing both stockout risk and excess inventory carrying cost.
When FTA findings drive PM schedules and spare parts decisions, the result is a maintenance program built on evidence rather than habit. Teams that apply this approach consistently report measurable reductions in unplanned downtime — the same direction as Cryotos customers who use data-driven PM scheduling to achieve up to 30% reduction in equipment downtime.
A fault tree diagram on paper is a starting point. A CMMS turns fault tree analysis in maintenance findings into scheduled tasks, recorded inspections, and a continuous feedback loop that keeps the analysis accurate over time.
Cryotos CMMS also captures 5 Whys analysis directly within work orders, so individual breakdown investigations contribute structured data back to your fault trees — creating a continuous improvement loop between reactive investigations and proactive FTA planning.
Fault tree analysis in maintenance produces poor results when teams rush the setup or skip the integration steps. These are the four mistakes that consistently undermine the analysis.
A qualitative FTA identifies the logical failure paths and minimal cut sets without assigning probabilities — it tells you which combinations of failures can cause the top event. A quantitative FTA assigns failure rates (from historical data or reference databases) to each basic event and calculates a numerical probability for the top event and each cut set. Qualitative FTA is faster and works well when failure rate data is limited; quantitative FTA gives you the numbers to justify maintenance budget decisions and compare design alternatives.
A focused fault tree analysis in maintenance on a single asset with a well-defined top event typically takes one to three days for a cross-functional team of three to five people. Complex systems with many sub-systems and interdependencies can take one to two weeks. The largest time investment is usually gathering accurate system documentation and historical failure data — having a well-maintained CMMS with complete maintenance histories cuts this significantly.
Yes — and it is actually where FTA originated. Safety-focused FTA uses the same methodology but defines safety incidents (an injury, a fire, a toxic release) as the top event. For maintenance teams working under ISO 45001 or PSM regulations, FTA is a recognised method for demonstrating that safety-critical systems have been systematically analysed. Many maintenance departments run parallel trees: one for production failure risk and one for the associated safety event if the same failure occurs during maintenance.
FTA and RCM are complementary, not competing methods. RCM is a framework for selecting the right maintenance strategy for each failure mode (preventive, predictive, run-to-failure, or redesign). FTA is an analytical tool for understanding how specific failure modes combine to produce system-level failures. In an RCM programme, FTA is typically used during the functional failure analysis stage to identify which failure modes are critical and which can be accepted — feeding directly into the RCM decision logic for task selection.
A minimal cut set is the smallest combination of basic events (component failures or human errors) that, if they all occur, will guarantee the top event occurs. Single-element minimal cut sets — where one failure alone causes the top event — represent your most critical maintenance priorities, since there is no redundancy protecting the system. Multi-element minimal cut sets are lower priority because multiple simultaneous failures are required. Ranking your maintenance actions by cut set size helps you direct limited maintenance resources to where they provide the greatest risk reduction.
Preventing equipment failures starts with understanding exactly how they happen. Fault tree analysis gives maintenance teams the structured map to do that — and Schedule a free demo to see how Cryotos CMMS turns your FTA findings into scheduled work orders, PM tasks, and real-time downtime tracking that keeps critical assets running.



Cryotos AI predicts failures, automates work orders, and simplifies maintenance—before problems slow you down.



