
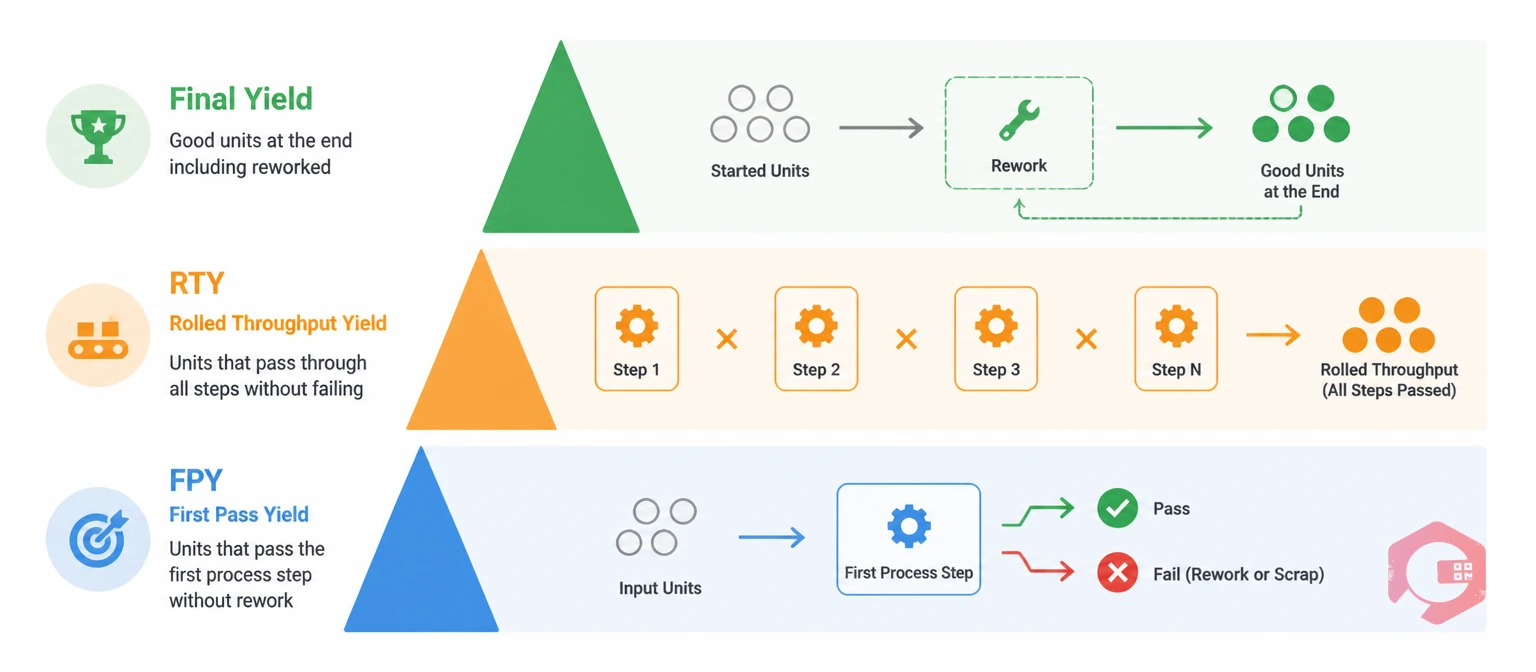
First Pass Yield, Rolled Throughput Yield, and Final Yield are three distinct manufacturing quality metrics that measure process performance at different levels of visibility. FPY captures the percentage of units that pass a single process step on the first attempt — no rework, no repairs. RTY multiplies FPY across every step in your process, revealing the true probability that a unit travels the entire line defect-free. Final Yield counts all good units at the end, including ones reworked along the way. If your line reports 97% yield at week's end, that number alone cannot tell you whether 97% of units sailed through clean or whether dozens were reworked three times before passing. Knowing which metric to use — and when — is the difference between a production team that acts on real process data and one that manages to a number that masks the hidden cost of rework.
Key Takeaways
Manufacturing yield metrics are quantitative measures that reveal how much of your production process works correctly on the first attempt — and how much value is being quietly consumed by rework, inspection loops, and scrap. In lean and Six Sigma manufacturing, yield is more than a daily report number; it is a direct signal of process health, hidden waste, and the cost of quality.
The three most commonly tracked yield metrics are First Pass Yield, Rolled Throughput Yield, and Final Yield. Each one measures something subtly different, and using the wrong metric for the wrong decision can give you a falsely optimistic picture of your production line. According to ASQ, hidden rework — often called the "hidden factory" — is one of the leading sources of untracked waste in manufacturing operations worldwide.
First Pass Yield is a step-level metric that counts only units passing on the first attempt. Rework, repairs, and scrapped units all reduce FPY — making it the strictest of the three yield measures.
First Pass Yield (FPY) is the percentage of units that complete a step without rework on the first attempt. It is a step-level metric: it tells you how well one specific operation in your process is performing, independent of all others.
The FPY formula for a single step is straightforward:
FPY = (Units passing without rework or scrap) ÷ (Total units entering the step) × 100
First Pass Yield is the strictest step-level quality measure in manufacturing — it counts only units that needed zero rework. Any unit sent back for repair, adjustment, or re-inspection reduces FPY, regardless of whether it ultimately passes.
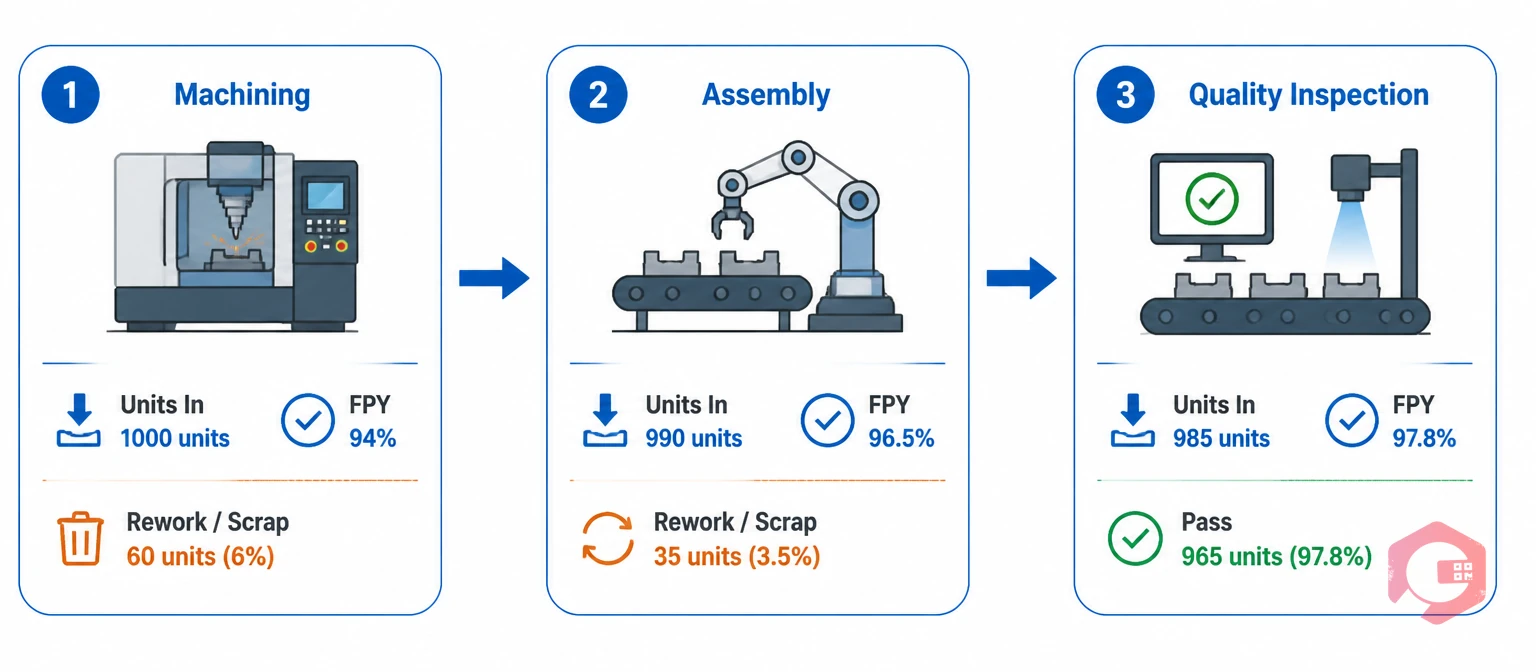
Take a 3-step assembly process as an example:
Step 1 is where the real problem lives at 94%. Without per-step FPY tracking, that distinction disappears into a blended average. But FPY alone cannot tell you the cumulative impact across the whole line — that is where RTY becomes essential.
Equipment degradation is a primary driver of declining FPY at specific steps. When a machine starts drifting out of tolerance, its step FPY drops before any other KPI signals the problem. Preventive maintenance software that schedules calibration and service intervals against actual equipment condition — not just calendar time — catches that drift before it generates defects in your yield data.
Rolled Throughput Yield (RTY) is the probability that a unit travels through your entire production process without being reworked at any step. You calculate it by multiplying the First Pass Yield of every step together — which means any rework at any point in the line compounds against you.
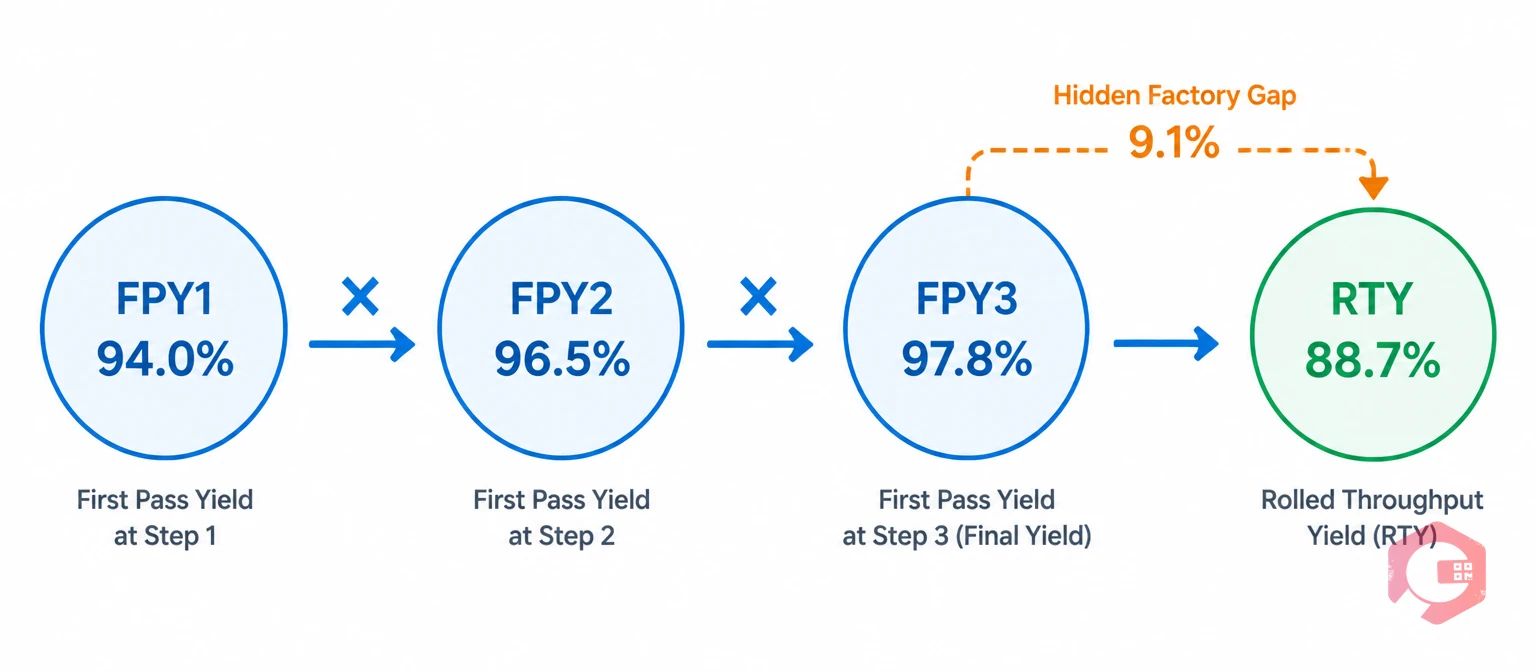
Using the same 3-step process:
RTY = FPY₁ × FPY₂ × FPY₃ = 0.940 × 0.965 × 0.978 = 0.887 = 88.7%
Rolled Throughput Yield is a compounded quality metric that reveals the true cost of rework across all process steps. The more steps in your line, the lower RTY will be relative to any individual step FPY — and the bigger the hidden factory it exposes.
Every individual step had FPY above 94% — yet the RTY is only 88.7%. That 11.3% gap represents units that were reworked at least once somewhere on the line. Those units still count in your Final Yield — but they consumed technician time, materials, and machine capacity to get there.
According to iSixSigma, hidden factory costs — rework loops that never appear in official output reports — can represent 15–40% of total operating costs in some manufacturing environments. RTY makes that cost visible in a single number. It is the metric Six Sigma DMAIC Measure phases use to baseline process efficiency before improvement work begins, because it is the only yield figure that cannot be artificially inflated by rework.
Maintenance teams using Cryotos have reported up to 30% reduction in unplanned downtime and 25% faster repair turnaround — improvements that directly raise FPY at equipment-intensive steps and, compounded through RTY, can add several percentage points to end-to-end process yield.
Final Yield counts all good units at the end of the process — including every unit that was reworked and eventually passed. A unit reworked four times counts identically to one that sailed through the line clean. Final Yield is the most optimistic of the three metrics and the one most likely to mislead if used for internal process decisions.
Final Yield = (Total good units at end, including reworked) ÷ (Total units entering Step 1) × 100
Final Yield is a process output metric that treats every good unit as a success, regardless of how many rework loops it needed. That makes it suitable for customer reporting but misleading for internal quality analysis.
Using the same 3-step process: 978 units passed out of 1,000 started. Final Yield = 97.8% — versus RTY of 88.7%. That 9.1 percentage-point gap is your hidden factory: units that needed at least one rework loop before they became good.
When management reports only Final Yield, the hidden factory stays invisible. Supervisors see 97.8% and assume the process is healthy. The 9.1% of units cycling through rework never appear in the headline number — but they are consuming labour hours, machine time, and materials. The gap between Final Yield and RTY is the most direct financial argument for closing your hidden factory. Tracking both numbers — and reporting the gap explicitly — is what makes improvement investments easier to justify.
Use the OEE calculator alongside your RTY tracking to see how yield losses connect to overall equipment effectiveness — the two metrics share the same root causes in equipment reliability and process control.
The table below maps all three metrics across the dimensions that matter most for selecting the right one:
| Attribute | First Pass Yield (FPY) | Rolled Throughput Yield (RTY) | Final Yield |
|---|---|---|---|
| What it measures | Quality at one process step | Cumulative quality across all steps | Output quality including reworked units |
| Formula | (Good − Rework − Scrap) ÷ Total in | FPY₁ × FPY₂ × … × FPYₙ | Total good out ÷ Total units entered |
| Counts rework as good? | No — rework reduces FPY | No — rework compounds across steps | Yes — reworked units count as good |
| Reveals hidden factory? | Partially — per step only | Yes — fully across all steps | No — masks rework entirely |
| Best use | Step-level troubleshooting | End-to-end process audit | Customer-facing quality reporting |
| Optimism level | Moderate | Most realistic / conservative | Most optimistic |
| Six Sigma usage | Measure phase — step baselining | Measure phase — process baselining | Customer SLA compliance |
The Yield Visibility Triangle is a framework for understanding how these three metrics nest together and what each one reveals:
First Time Yield (FTY) and First Pass Yield (FPY) are often used interchangeably, but they differ in one critical respect: how they handle reworked units that ultimately pass a step.
FTY at the step level counts reworked units as good if they eventually pass — making it closer to a step-level Final Yield. FPY is strict: only units that passed on the very first attempt count as good. That distinction matters for RTY calculations in Six Sigma DMAIC projects. If you substitute FTY for FPY when multiplying across steps, your RTY will be inflated — it will no longer represent the true probability of a defect-free journey through the line.
| Attribute | First Time Yield (FTY) | First Pass Yield (FPY) |
|---|---|---|
| Counts rework as good? | Yes — reworked units that pass count as good | No — only units passing on the first attempt count |
| Use in RTY formula? | No — inflates RTY, hides rework cost | Yes — strict FPY is the correct RTY input |
| Six Sigma usage | Sometimes used for customer-facing step reporting | DMAIC Measure phase baselining |
| Reveals hidden factory? | No — rework is absorbed into the count | Yes — rework reduces FPY directly |

All three metrics belong in a complete manufacturing quality system — the question is which one to prioritise for which decision.
FPY is your diagnostic tool. When rework rates are rising or throughput is falling, per-step FPY tells you exactly which operation is responsible. Most facilities that run FPY analysis for the first time find one or two steps accounting for the majority of their rework burden — and those steps are almost always linked to equipment that is overdue for calibration or maintenance.
RTY is your financial and improvement baseline. It is the only yield metric that cannot be made to look better by reworking units — a facility running 95% step FPY across five steps has an RTY of only 77.4%. That is the real cost of the process, and it is the number that drives improvement investment decisions.
Final Yield is the right number when the question is: "What percentage of units met spec at delivery?" It maps to AQL levels in customer contracts and defect rate commitments in quality agreements. The caution is critical: most facilities that track only Final Yield internally have no visibility into their hidden factory, no ability to localise rework to specific steps, and no honest baseline for improvement projects.

Improving FPY and RTY requires addressing the root causes of rework at the step level — not adding more inspection at the end. Most rework in manufacturing traces to three sources: equipment out of tolerance, process variation from uncontrolled parameters, and incomplete or inconsistent operator procedures.
FPY benchmarks vary significantly by industry, manufacturing complexity, and the number of process steps involved. RTY benchmarks are always lower — sometimes dramatically so in multi-step processes, even when individual step FPY looks acceptable.
FPY measures quality at a single process step — it tells you what percentage of units passed one operation on the first attempt. RTY multiplies FPY across every step in the process, giving you the probability that a unit travels the entire line without being reworked even once. RTY is always lower than any individual step FPY because each additional step multiplies another fraction against the total. The practical difference: FPY diagnoses which step is causing rework; RTY quantifies the cumulative cost of rework across the whole line.
Final Yield includes reworked units in the good count — any unit that eventually passes inspection counts as a good output, regardless of how many rework loops it went through. RTY only counts units that never needed rework at any step. The gap between Final Yield and RTY is your hidden factory: the labour hours, machine time, and materials consumed by rework that never appear in the headline yield number. A 9-percentage-point gap between Final Yield (97%) and RTY (88%) represents a significant cost that only becomes visible when you track both metrics.
It depends on the industry and the number of steps in your process. Pharmaceutical manufacturing targets 99%+ FPY at critical steps. Automotive aims for 95–99% per step. Electronics assembly typically runs 92–97% per step. As a general rule, any step below 90% FPY warrants immediate investigation — not just quality investigation, but a maintenance review of the equipment at that step, since equipment condition is one of the most common root causes of sustained low FPY.
Equipment degradation is one of the most consistent root causes of declining step FPY. As machines drift out of calibration or tolerance, the percentage of units passing that step on the first attempt falls — often before any other KPI signals a problem. Preventive maintenance schedules service interventions before that drift occurs, keeping step FPY stable. In multi-step processes, even a modest improvement in step FPY — from 94% to 96% — compounds through RTY to produce a meaningful gain in end-to-end yield efficiency.
A Computerized Maintenance Management System connects maintenance operations directly to quality outcomes. It schedules preventive maintenance on the assets most likely to cause step FPY losses, triggers corrective work orders when equipment parameters deviate from spec, and logs all rework events so teams can calculate accurate FPY and RTY from actual operational data rather than estimates. The BI dashboard in a CMMS like Cryotos lets maintenance managers track FPY trends by asset, shift, and product family, and cross-reference yield data against PM compliance — so the connection between maintenance behaviour and yield performance becomes visible and actionable.
Tracking FPY, RTY, and Final Yield gives your production team the full picture — from where rework originates to what it costs across the whole line. Schedule a free demo to see how Cryotos connects maintenance operations to your quality metrics so every work order, PM schedule, and downtime event feeds into the yield data your team needs to improve.


Cryotos AI predicts failures, automates work orders, and simplifies maintenance—before problems slow you down.


