

FMCG water reduction starts in the maintenance department, not the sustainability report. In most food, beverage, dairy and personal care plants, the biggest water losses come from clean-in-place (CIP) cycles that run too long, valves that leak by, worn spray devices and cooling systems that bleed more than they should. Fix those assets on a schedule, and water use per unit of product drops.
A Computerized Maintenance Management System (CMMS) makes that schedule stick. It links meter readings to work orders, so a rising flow rate becomes a job for a technician instead of a line on next month's utility bill. This guide covers where FMCG plants lose water, how to cut CIP water safely, a ready-to-use PM schedule and a 90-day plan to get started.
Key Takeaways

FMCG water reduction is the practice of lowering the water a consumer goods plant uses for each unit of product it makes. It covers process water, cleaning water, utility water and losses from leaks.
Water intensity is the ratio of water used to product made, usually in litres per litre or kilogram. It is the number that boards, retail customers and auditors ask about first.
Industry standards point the same way. ISO 14046 sets out how to assess a water footprint, ISO 14001 asks plants to control their environmental aspects, and ISO 55000 frames asset management as the way to get value from physical assets over their full life. Total Productive Maintenance (TPM) programs also treat leaks as abnormalities that operators should spot and tag every day.
The bottom line is simple: a water target needs a maintenance plan behind it, or the savings fade within months.

Most FMCG water reduction opportunities sit in five asset groups. Water audits in food and beverage sites tend to find the same pattern: cleaning and utilities use far more water than the product itself.
CIP is often the single largest user of water in dairy, beverage and sauce plants. Cycles set on fixed timers keep rinsing long after the line is clean, and every extra minute sends treated water straight to drain.
Mix-proof valves can leak by internally, so water passes to drain with no visible puddle. Pump mechanical seals that use flush water also waste far more once the seal faces wear.
Cooling towers lose water through blowdown, drift and overflow. A stuck float valve or a faulty conductivity controller can double blowdown without anyone noticing. Failed steam traps and broken condensate return lines send hot, treated water to drain.
These machines spray large volumes of water every shift. Worn or missing nozzles, overflowing tanks and recirculation pumps that run below spec all raise the amount of fresh make-up water they need.
Hoses left running between washdowns are a common mistake on FMCG production floors. Auto shut-off nozzles help, but only if someone checks them and replaces them when they fail.
If your plant runs food and beverage CMMS software, each hotspot can become a tagged asset with its own PM plan and water meter. Mapping every loss to a named asset is the first step toward FMCG water reduction that lasts.
Want a quick view of what reactive repairs on these assets cost you each year? Run your numbers through the free mean maintenance cost calculator.
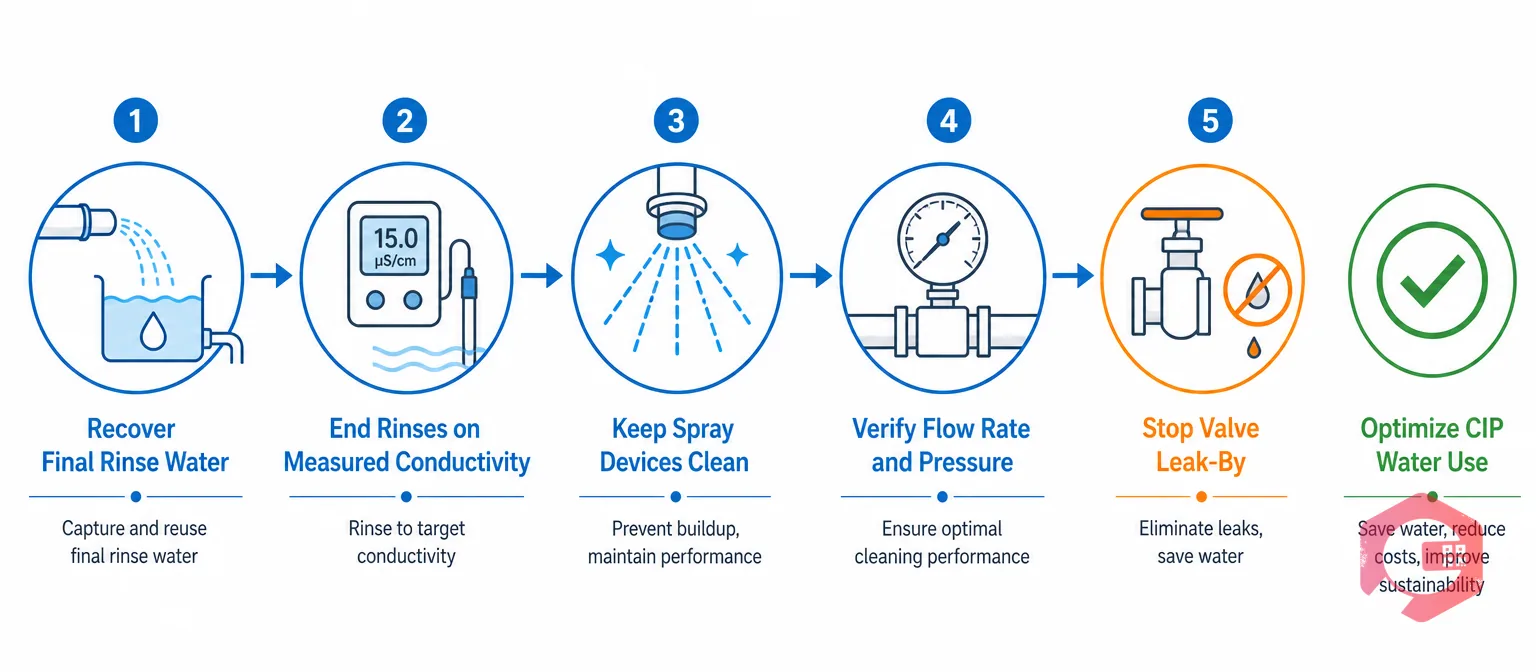
Clean-in-place (CIP) is an automated method of cleaning tanks, pipes and process equipment without taking them apart. A typical cycle runs a pre-rinse, a caustic wash, an intermediate rinse, an optional acid wash and a final rinse.
Cutting CIP water is the largest single step in FMCG water reduction, and it is safe when every change is validated and the assets behind the cycle stay in good condition. These five maintenance levers do most of the work.
Final rinse water is nearly clean. Storing it in a recovery tank and reusing it for the next pre-rinse can cut the fresh water each cycle needs by a large margin. The recovery tank, its level sensors and its valves then need their own PM tasks.
Inline conductivity and turbidity sensors show when cleaning chemical has cleared the line. Ending a rinse on a measured value, instead of a fixed timer, trims wasted minutes from every cycle. This only works if the sensors are calibrated on schedule.
Blocked spray balls and stuck rotary jet heads leave shadow areas inside tanks. Operators then extend cycles to be safe, which wastes water on every run. A simple weekly check of spray pattern and rotation fixes the cause instead.
CIP relies on turbulent flow, often a velocity of about 1.5 metres per second in pipework. A worn supply pump that misses this target forces longer cycles to get the same clean. Log flow and pressure at each cycle and act when readings drift.
Leaking CIP return and drain valves waste water and chemical together. Seat and seal checks on a fixed interval catch them before the losses add up.
Digital maintenance checklists let technicians record sensor calibration, spray device checks and flow readings against each CIP circuit. A well-maintained CIP set uses less water because it no longer needs extra time to make up for worn parts.

The FLOW Framework gives maintenance teams a repeatable way to turn water targets into daily work. It has four stages, and each stage ends with something you can measure.
The FLOW Water Reduction Framework:
Operations that succeed with FMCG water reduction treat FLOW as a loop, not a one-time project. After the first pass, the team returns to the baseline, sets a lower target and repeats the cycle.
The framework fits neatly inside TPM. Operators handle the Locate stage through daily checks, while planners own Optimize and Watch. FLOW turns water saving from a short campaign into a lasting routine.
A water-saving PM schedule ties each high-use asset to a task, an interval and a trigger. Use the schedule below as a starting point, then adjust intervals to your OEM manuals and site history.
| Asset | PM Task | Typical Frequency | Water Loss Prevented | CMMS Trigger |
|---|---|---|---|---|
| CIP supply pump | Check flow rate, pressure and seal condition | Monthly | Long cycles and seal flush waste | Meter-based (cycle count) |
| CIP spray balls and rotary heads | Inspect spray pattern and rotation; clean nozzles | Weekly | Extended rinses to cover shadow areas | Calendar |
| Conductivity and turbidity sensors | Calibrate against a reference standard | Monthly or quarterly | Rinses that run past the clean point | Calendar |
| Mix-proof and drain valves | Check seats, seals and leak detection ports | Quarterly | Hidden leak-by to drain | Calendar plus condition |
| Cooling tower | Check float valve, drift eliminators and blowdown controller | Monthly | Overflow and excess blowdown | Calendar plus meter alarm |
| Steam traps and condensate return | Survey traps; repair return line leaks | Quarterly | Lost condensate and extra make-up water | Calendar |
| Bottle washer and pasteurizer | Replace worn nozzles; check tank overflow | Monthly | High fresh water make-up | Meter-based (operating hours) |
| Hoses and auto shut-off nozzles | Inspect and replace failed nozzles | Weekly | Open hoses running to drain | Calendar |
Load these tasks into preventive maintenance software so each one creates a work order on time, with the right checklist attached. A written schedule only supports FMCG water reduction when it runs on time, every time.
CMMS software supports FMCG water reduction by connecting water data to maintenance action. Without that link, meter readings sit in a utility report while leaks keep running.
With IoT meter reading, flow and totaliser values from sub-meters stream into the CMMS through SCADA, PLC or edge devices. When a line uses more than its baseline, the system raises a work order and alerts the asset owner.
Technicians complete CIP checks, leak walks and calibrations on a mobile app, even when offline. Each result is time-stamped and tied to the asset, which also builds the audit trail that food safety teams need.
Asset history shows which valves, seals or hoses fail again and again. Teams can then use root cause analysis and the 5 Whys to fix the design or the part, not just the symptom.
A maintenance KPI dashboard can show litres per unit next to PM compliance, MTTR and backlog. When PM compliance drops, water intensity often climbs a few weeks later.
Maintenance teams using Cryotos have reported up to 30% reduction in unplanned downtime and 25% faster repair turnaround. Faster repairs matter for water too, because every hour a leak waits in the backlog is water lost. CMMS closes the gap between spotting a water loss and fixing it.
Not every water-saving action costs the same. The table compares common maintenance levers for FMCG plants by effort, cost and typical payback, so you can start with quick wins.
| Lever | Effort | Upfront Cost | Typical Payback | Water Impact |
|---|---|---|---|---|
| Leak walks and fast repair | Low | Low | Weeks | Medium |
| Auto shut-off hose nozzles | Low | Low | Weeks to months | Low to medium |
| Spray device PM | Low | Low | Weeks | Medium |
| CIP sensor calibration and rinse tuning | Medium | Low to medium | Months | High |
| Final rinse recovery tank | High | Medium to high | 1 to 3 years | High |
| Cooling tower controls and float valve PM | Medium | Low to medium | Months | Medium to high |
| Sub-metering with IoT alerts | Medium | Medium | Months to 2 years | High, because it makes other losses visible |
Payback depends on local water, effluent and energy prices, so treat these ranges as a guide rather than a promise. Start with low-cost maintenance fixes, then fund bigger FMCG water reduction projects from the savings they release.
An FMCG water reduction program can show results in 90 days if it starts with data and quick fixes. Most facilities follow three phases.
Before you change any CIP cycle, confirm it with your food safety team and verify it with swab or ATP tests. A regulatory compliance checklist helps keep validation records complete. A 90-day plan proves the savings before you ask for a bigger budget.
It varies widely by product, plant design and cleaning frequency. In dairy and beverage sites, cleaning is often one of the largest water uses on site. Sub-metering each CIP set is the only reliable way to know your own figure.
Yes, as long as every change is validated. Use conductivity sensors to confirm chemical removal, run swab or ATP tests after changes, and keep records of each validation. Maintenance of sensors and spray devices is what keeps the reduced cycle safe over time.
A CMMS links water meter readings to assets and raises work orders when usage drifts above baseline. It also schedules water-saving PM tasks, stores CIP check results and shows which assets leak again and again. This turns water saving into routine maintenance work.
Published industry benchmarks often place many beverage plants between about 2 and 3 litres of water per litre of product, with leading sites reporting figures closer to 1.5. Your target should start from your own baseline and product mix. A steady yearly reduction is more useful than chasing another plant's number.
Leak repair, CIP sensor calibration, spray device checks and cooling tower float valve maintenance usually give the fastest savings. Final rinse recovery saves a lot of water but needs more investment. Start with the low-cost tasks and measure the results.
Most plants see measurable savings within 60 to 90 days from leak repairs and CIP tuning. Larger projects such as rinse recovery tanks take longer to pay back. Tracking water intensity weekly shows progress early and keeps the team engaged.
Every litre saved through FMCG water reduction also cuts effluent, chemical and energy costs. Schedule a free demo to see how Cryotos links your water meters, CIP checks and work orders in one system.


Cryotos AI predicts failures, automates work orders, and simplifies maintenance—before problems slow you down.



