
FMECA (Failure Mode, Effects, and Criticality Analysis) helps maintenance teams rank every way an asset can fail by how severe and how likely that failure is. The result is a ranked list that shows which assets and failure modes deserve attention first. Teams then use that list to set PM intervals, pick condition monitoring targets, and stock the right spares.
Most plants have more equipment than their crews can watch closely. FMECA replaces gut feel with a repeatable score, so your limited labor goes where a failure would hurt production, safety, or cost the most. This guide walks through the method step by step, with a worked pump example and a simple ladder for turning scores into action.
Key Takeaways

FMECA is a structured method that lists how each part of an asset can fail, what each failure does, and how critical each failure is. It extends Failure Mode and Effects Analysis (FMEA) by adding a criticality step that ranks failure modes against each other. The FMECA methodology covers system definition, failure mode listing, severity classes, and a criticality ranking.
The method came from the U.S. military. The MIL-STD-1629A standard defined the FMECA procedure in 1980, and IEC 60812 later carried it into commercial industry. Today it sits inside most reliability programs, including Reliability-Centered Maintenance (RCM) and asset management systems built on ISO 55000.
A failure mode is the specific way an item stops doing its job. "Pump fails" is not a failure mode. "Mechanical seal leaks at the shaft" is, because you can find its cause and plan a task to prevent it.
In short, FMECA turns a long list of things that could go wrong into a ranked list of things you should act on first.
FMECA adds a formal criticality ranking on top of FMEA, so teams can compare failure modes across an entire asset base. FMEA alone tells you what can fail and why. FMECA also tells you which of those failures to fix first.
| Attribute | FMEA | FMECA |
|---|---|---|
| Core output | List of failure modes, effects, and causes | Same list, plus a criticality rank for each mode |
| Risk scoring | Risk Priority Number (Severity × Occurrence × Detection) | Criticality number from failure rate, mode ratio, and effect probability, or a qualitative matrix |
| Data needed | Team judgment on 1-10 scales | Failure rates and operating hours, or ranked probability levels |
| Best fit | Product design, process quality, early studies | Asset-heavy operations, safety-critical systems, RCM programs |
| Main maintenance use | Find weak points | Rank assets and set task priority |
| Origin | Automotive and quality programs | MIL-STD-1629A (U.S. military) |
Many maintenance teams start with FMEA and add criticality once they have a few years of failure history in their work order records.
The key difference is ranking: FMEA finds risks, while FMECA puts them in order.
FMECA matters because it focuses limited maintenance hours on the failures that cause the most downtime and risk. Without a ranking, teams tend to give every asset the same PM plan, which over-maintains minor equipment and under-protects critical equipment.
RCM programs use FMECA as their analysis engine for this reason. The reliability-centered maintenance approach asks which task, if any, is worth doing for each failure mode. Criticality is the input that answers that question.
The payoff is simple: when you know which failures matter most, you can prevent the ones that cause the longest and most costly stops.
Need failure rate inputs for your FMECA? Try the free failure rate calculator to turn your breakdown history into the λ values FMECA uses.
FMECA follows seven steps: define the system, list failure modes, describe effects, rate severity, rate probability, calculate criticality, and assign actions. Most maintenance teams finish a single asset in two to four working sessions once the data is ready.
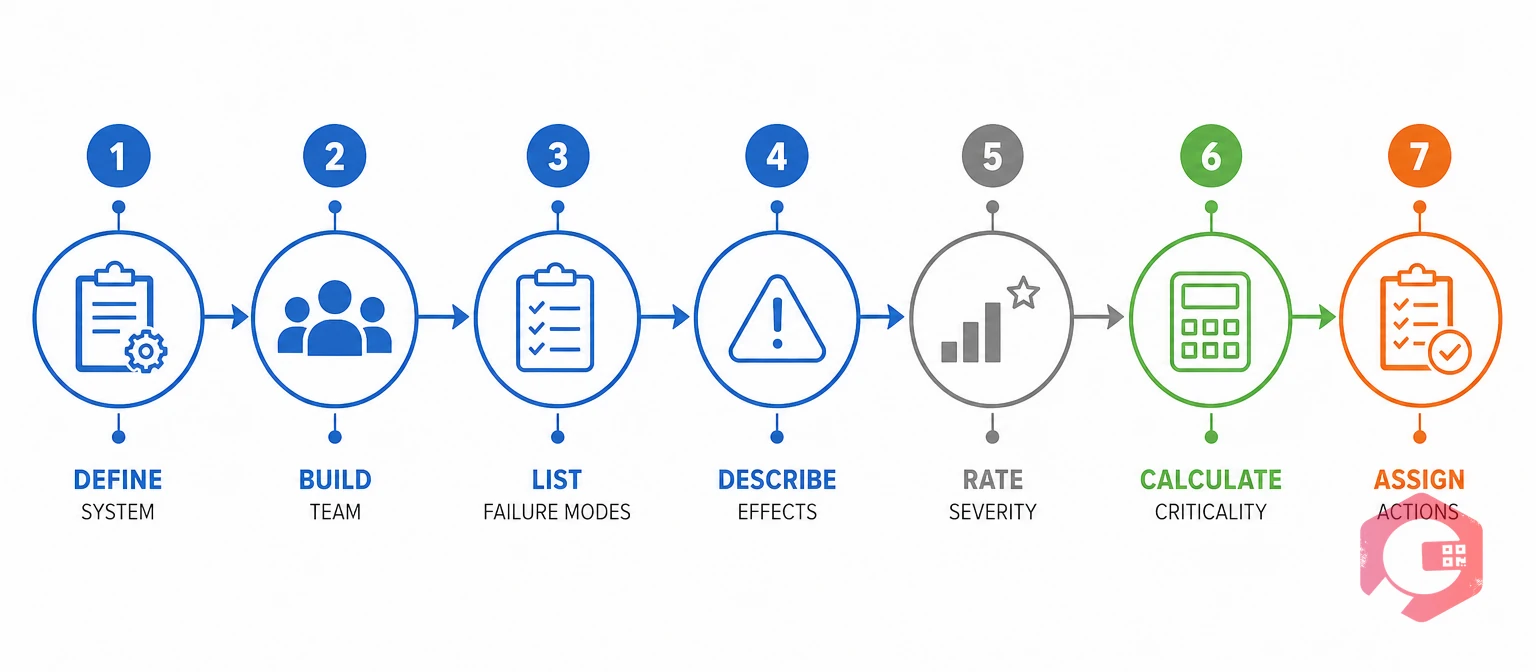
Before the first session, gather the equipment drawings, the last few years of work orders, and any known failure reports. A short kickoff to agree on scales and scope saves hours of debate later.
Choose one asset or system and write down what it must do, at what rate, and under what conditions. Pull the equipment hierarchy from your asset register or EAM software, so every component has a clear parent.
For each component, ask "how can this stop doing its job?" Use work order history, OEM manuals, and technician experience. Write each mode as a specific physical event, such as "impeller erosion" or "coupling misalignment."
Record the local effect on the component and the end effect on the system. Note how a technician or sensor would detect the failure before it causes a full stop.
MIL-STD-1629A uses four severity classes. Many plants adapt them to production terms:
With good failure data, use the quantitative formula: Cm = β × α × λ × t. Here β is the chance the failure causes the stated effect, α is the share of the part's failures that come from this mode, λ is the part failure rate, and t is operating time.
You can derive λ from your mean time between failures, since the failure rate is roughly 1 divided by MTBF. Add the Cm values for every mode on a part to get its item criticality, Cr. Without solid data, rank probability on a five-level scale instead.
For each high-ranking mode, choose a task, an owner, and a due date. Typical actions include a new PM task, a condition monitoring route, a design change, or a critical spare.
Then schedule a check about three to six months later. Confirm the action was done and see whether the failure count dropped. If it did not, revisit the cause and adjust the task.
Run these seven steps on your most important asset first, then work down the list as the team builds speed.
The best FMECA data comes from your own maintenance history, backed up by OEM manuals and industry failure rate databases. Your own records beat generic numbers because they reflect your duty cycles, operators, and environment.
Many plants find their work order history is incomplete, with blank cause fields or vague notes like "fixed pump." Do not let that stop the study. Start with the qualitative matrix and team judgment, then tighten your work order close-out rules, so the next review has better data.
A simple rule helps: require a failure code and a short cause note before any corrective order can close. Within six to twelve months, you will have counts you can trust.
Good data does not need to be perfect data; it needs to be consistent enough to rank one failure mode against another.
A criticality matrix is a grid that plots each failure mode by severity class and probability level. Modes in the top-right corner are the most critical, and modes in the bottom-left are the least.
MIL-STD-1629A defines five probability levels, from A (frequent) to E (extremely unlikely). The matrix below shows how a typical plant reads each cell:
| Probability Level | Cat IV (Minor) | Cat III (Marginal) | Cat II (Critical) | Cat I (Catastrophic) |
|---|---|---|---|---|
| A: Frequent (above 0.20) | Medium | High | Very high | Very high |
| B: Reasonably probable (0.10 to 0.20) | Low | Medium | High | Very high |
| C: Occasional (0.01 to 0.10) | Low | Medium | High | Very high |
| D: Remote (0.001 to 0.01) | Low | Low | Medium | High |
| E: Extremely unlikely (below 0.001) | Low | Low | Medium | High |
Probability values show the chance of the failure mode during the item's operating time. Your plant can tune the cell ratings to match its own risk tolerance.
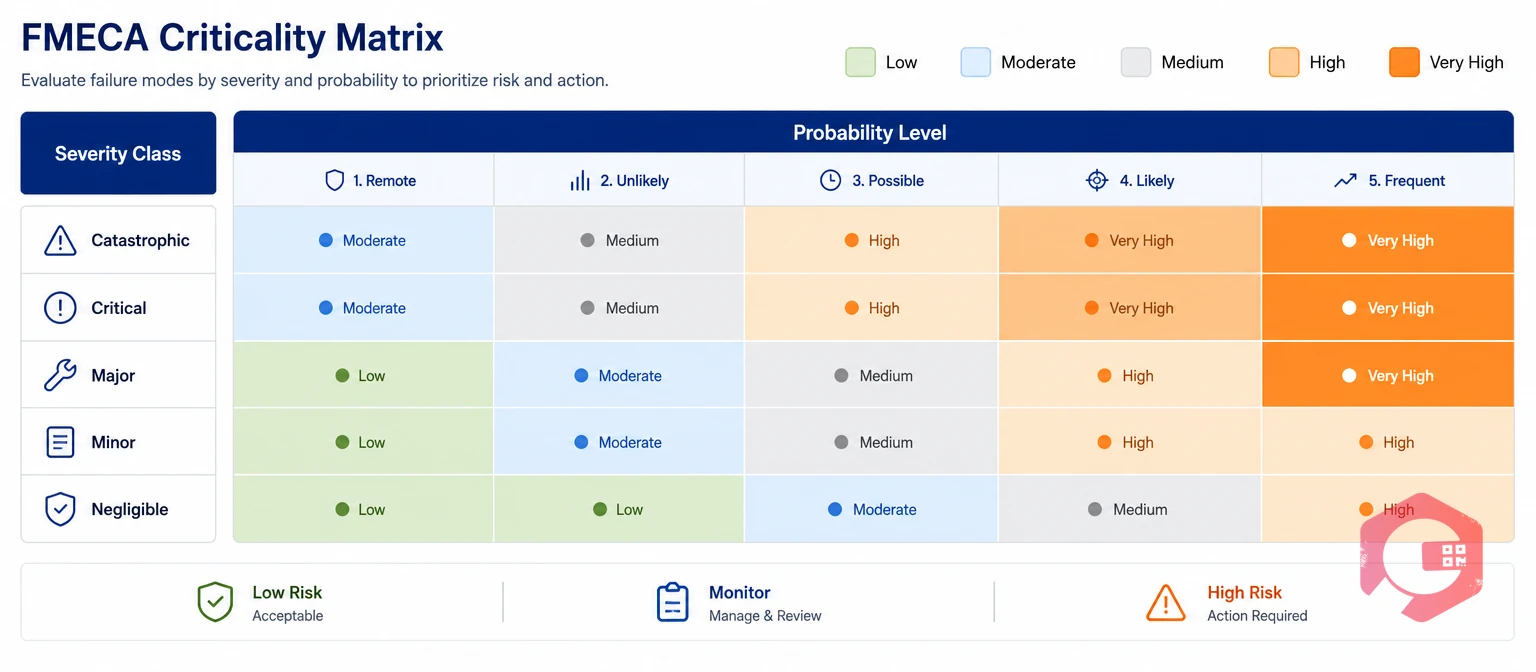
A good matrix lets anyone on the team see, at a glance, which failure modes deserve the next maintenance hour.
A worked example shows how FMECA ranks failure modes on a single asset. Below is part of a worksheet for a process water pump that runs 6,000 hours a year. Its failure rate is 0.0002 failures per hour (an MTBF of 5,000 hours).
| Failure Mode | End Effect | Severity | α (Mode Ratio) | β (Effect Probability) | Cm (6,000 h) | Rank |
|---|---|---|---|---|---|---|
| Mechanical seal leak | Line stop, hot water spill | II | 0.40 | 1.0 | 0.48 | 1 |
| Bearing seizure | Line stop, motor damage | II | 0.30 | 0.8 | 0.29 | 2 |
| Impeller erosion | Reduced flow, slower line | III | 0.15 | 0.5 | 0.09 | 3 |
| Coupling misalignment | Vibration, bearing wear | III | 0.10 | 0.3 | 0.04 | 4 |
| Gasket weep | Minor drip, housekeeping | IV | 0.05 | 0.2 | 0.01 | 5 |
Each Cm value comes from β × α × 0.0002 × 6,000. The seal leak ranks first because it is both the most common mode and a Category II event.
The worksheet turned five vague concerns into two new tasks, one spare part, and three items the team chose not to over-maintain.
FMECA results become priorities when each criticality band maps to a fixed maintenance response. A shared rule like this stops teams from re-debating every score and keeps decisions consistent across sites.
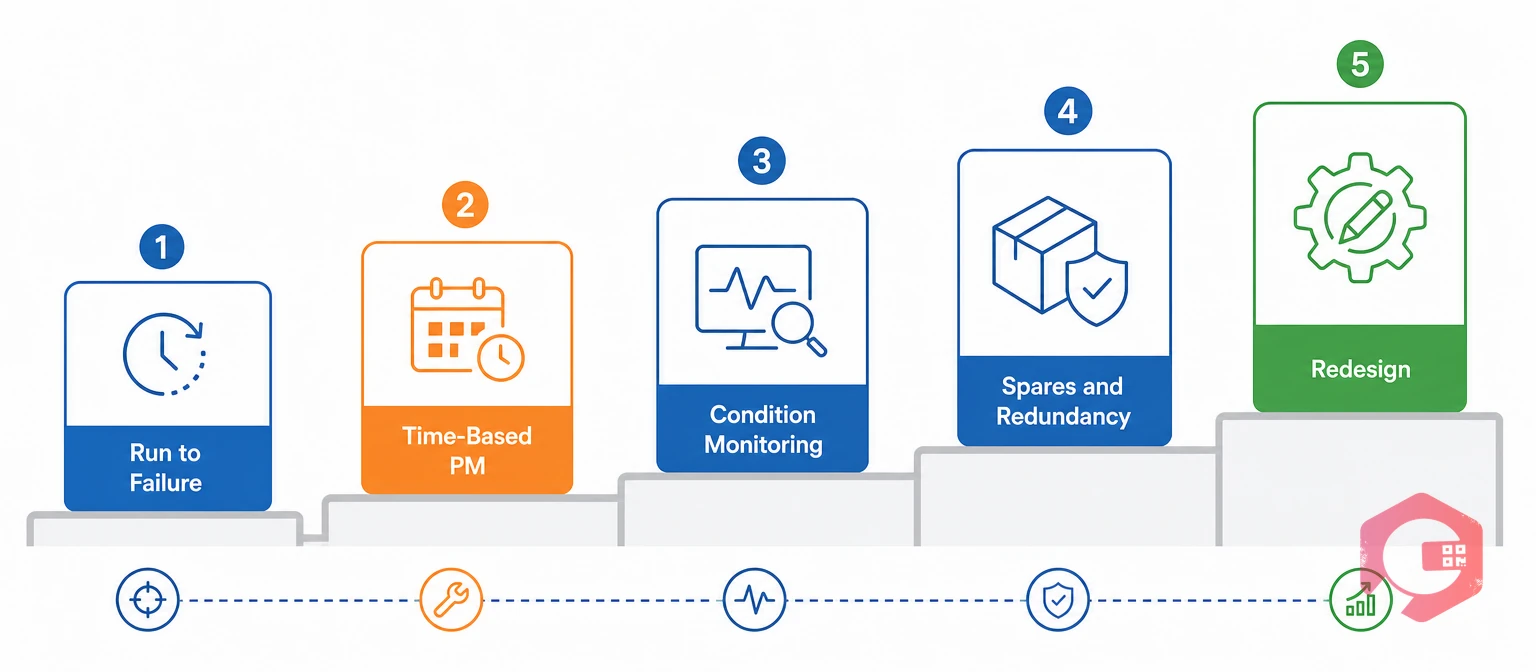
The Five-Rung FMECA Priority Ladder:
Each rung builds on the one below. For example, a Rung 4 mode usually keeps its Rung 3 monitoring task as well.
To rank whole assets, add up the criticality of all their failure modes, or take the highest single score. Then sort your asset list from top to bottom. The top 10 to 20 percent of assets usually drive most unplanned downtime, so they get the first reviews.
The ladder turns a spreadsheet of numbers into a clear work plan that every planner can follow.
FMECA works the same way in every industry, but the severity scale changes to match what each operation cares about most. Adjusting the scale keeps the rankings meaningful for the people who use them.
Plants weight severity by lost output, scrap, and line stops. A failure that halts a bottleneck machine for four hours scores higher than one that slows a non-bottleneck cell. FMECA often feeds directly into overall equipment effectiveness (OEE) programs.
Here, safety and environmental effects dominate. A rare seal failure that could release hydrocarbons ranks above a frequent nuisance trip. Many sites use FMECA as the first step of a reliability, availability, and maintainability (RAM) study.
Product safety and compliance shape the scale. A failure that could contaminate a batch, such as a gasket fault in a filler, scores as critical even if repair is quick. Records also support audit trails.
Hospitals, data centers, and campuses score by impact on occupants and services. A chiller or backup generator failure ranks high because of the effect on patients, servers, or building comfort.
Whatever your industry, write your severity scale in your own terms before scoring, so every team member rates failures the same way.
The most common FMECA mistake is treating it as a one-time study rather than a living document. Teams that successfully use FMECA review it whenever failure data, operating conditions, or equipment change.
Most facilities that struggle with FMECA have the method right but the follow-through wrong.
A Computerized Maintenance Management System keeps FMECA current by linking each failure mode to real work orders, failure codes, and downtime records. That link closes the loop between analysis and the shop floor.
This loop matters. Maintenance teams using Cryotos have reported up to 30% reduction in unplanned downtime and 25% faster repair turnaround. Much of that gain comes from aiming PM work at the failure modes that stop equipment most often.
When FMECA lives in your maintenance system instead of a spreadsheet, every new failure makes the next ranking more accurate.
FMECA stands for Failure Mode, Effects, and Criticality Analysis. In maintenance, it is used to list how each asset can fail, describe the impact of each failure, and rank failures by criticality. The ranking guides which assets get PM, condition monitoring, or spares first.
Review your FMECA at least once a year, and also after any major failure, equipment change, or process change. Many teams also refresh failure rates each quarter using data from their work order system. Frequent updates keep the rankings tied to how assets behave in service.
Yes. You can use the qualitative method, which ranks probability on a five-level scale from frequent to extremely unlikely. Plot each mode on a criticality matrix by severity and probability. As you collect failure history, you can switch to the quantitative formula.
A good team includes a maintenance technician, an operator, a reliability or process engineer, and a facilitator. Four to six people is usually enough. Mixing field experience with engineering judgment produces more accurate failure modes and scores.
Yes, if you focus it. Small teams should run FMECA on their few most critical assets rather than the whole site. Even one or two studies can show where to cut low-value PM and where to add early-warning checks.
For a single asset like a pump or conveyor, most teams need two to four sessions of two hours each. Larger systems, such as a full packaging line, can take several weeks. Good preparation and clear scope keep the effort under control.
No. FMECA looks ahead at failures that could happen, while root cause analysis looks back at a failure that already happened. The two work well together, since root cause findings often reveal new failure modes to add to the FMECA.
FMECA reduces unplanned downtime by finding the failure modes that cause the longest or most frequent stops. Teams then add targeted tasks, such as vibration checks or critical spares, before those failures happen. Over time, fewer breakdowns surprise the crew.
FMECA gives your team a clear, defensible order for protecting critical assets and cutting downtime. Schedule a free demo to see how Cryotos links FMECA priorities to PM schedules, failure codes, and live downtime data in one place.



Cryotos AI predicts failures, automates work orders, and simplifies maintenance—before problems slow you down.