

RCM in manufacturing is a method for picking the right maintenance task for each production asset based on how it fails. Reliability centered maintenance asks what each machine must do, how it can fail, and what each failure costs the line. It then assigns condition monitoring, preventive tasks, redesign, or run-to-failure to match the risk.
For plants, the payoff is fewer line stoppages and less wasted PM labor. This guide covers how RCM in manufacturing works, how to rank assets by throughput impact, a sample worksheet for common plant equipment, and a rollout plan you can start this quarter.
Key Takeaways

RCM in manufacturing applies the classic reliability-centered maintenance method to production equipment. It grew out of the 1978 Nowlan and Heap study for United Airlines, which showed that most failures are not tied to age. Fixed-interval overhauls often did nothing to improve reliability.
The process was later formalized in the SAE JA1011 standard, first published in 1998. Any process called RCM must answer seven questions about functions, functional failures, failure modes, effects, consequences, proactive tasks, and default actions.
In aviation, safety drives nearly every decision. In a factory, the most common consequence is lost output, scrap, or a missed shipment. That shifts the focus to production impact, which fits the asset management principles in ISO 55000.
Read the full background in our RCM glossary entry. The key point: RCM in manufacturing is about protecting throughput at the lowest total cost.
Manufacturing plants need a production-first approach because one stopped machine can idle an entire line. A failed filler or oven can halt every machine downstream of it, while a failed spare packer barely matters.
Most maintenance teams inherit PM plans written by OEMs. Those plans assume average duty and ignore where the asset sits in the process. The result is over-maintained spares and under-protected bottlenecks.
This is where RCM in manufacturing earns its keep. Instead of copying OEM intervals, the team sets tasks based on what a failure costs at that exact point in the process. A production-first view puts maintenance effort where it protects the most output.
Full RCM, streamlined RCM, and PM optimization (PMO) differ mainly in depth and effort. Most plants use a mix, saving the full method for their most critical assets.
| Attribute | Full RCM (SAE JA1011) | Streamlined RCM | PM Optimization |
|---|---|---|---|
| Starting point | Functions and failure modes from scratch | Known dominant failure modes | Existing PM task list |
| Effort per asset | High, with a cross-functional team | Medium | Low |
| Best for | Bottlenecks and safety-critical assets | Important assets with good history | Large fleets of standard equipment |
| Main output | Complete, defensible task plan | Focused task plan for top risks | Leaner, better-targeted PMs |
| Main risk | Analysis stalls before results show | Rare failure modes get missed | Gaps in the original plan stay hidden |
The practical rule is to match the method to the asset's criticality, not to apply one method everywhere.
Before you choose, check how often your key assets fail. The MTBF calculator gives you a quick baseline for each machine.

The best way to rank criticality in a plant is to score each asset on how much its failure hurts production, safety, and quality. Score the assets first, then spend RCM effort from the top of the list down.
The Throughput Criticality Method:
Multiply or add the scores and sort the list. In most plants, the top 10% to 20% of assets drive the bulk of downtime cost. Store the scores against each asset in your asset maintenance management software, so planners see them on every work order.
An RCM worksheet is a table that links each failure mode to its effect and a chosen maintenance task. The sample below shows typical entries for equipment found in most plants.
| Asset | Function | Failure Mode | Production Effect | Recommended Task |
|---|---|---|---|---|
| Belt conveyor | Move product between stations | Belt drifting off track or splice failure | Line stop, product damage | Weekly visual check; splice inspection at changeovers |
| Air compressor | Supply plant air at set pressure | Valve wear or overheating | Low pressure, tools and actuators stall | Temperature and pressure trending; oil analysis |
| CNC machine | Cut parts to tolerance | Spindle bearing wear | Scrap from chatter, then breakdown | Vibration analysis on spindle; part quality checks |
| Centrifugal pump | Deliver fluid at set flow | Mechanical seal leak | Fluid loss, reduced flow, safety risk | Leak and seal flush checks; alignment after repair |
| Gearbox | Transmit torque to the drive | Gear tooth wear from poor lubrication | Slowdown, then sudden stop | Oil sampling; vibration trending |
| Standby motor | Back up the duty motor | Winding failure | None while duty motor runs | Run-to-failure with a stocked spare |
Each row should come from a failure mode and effects analysis (FMEA) done with operators and technicians. The FMEA method dates back to a 1949 US military procedure and remains the core of every RCM study.
Many of these tasks rely on live readings. Condition monitoring software pulls vibration, pressure, and temperature data into the asset record automatically.
The main benefit of RCM in manufacturing is more uptime on the assets that matter, with less effort spent on the ones that do not. Plants that complete RCM on their bottlenecks usually see results within a few quarters.
Maintenance teams using Cryotos have reported up to 30% reduction in unplanned downtime and 25% faster repair turnaround. Track the gains on a maintenance KPI dashboard, so leadership sees the return.
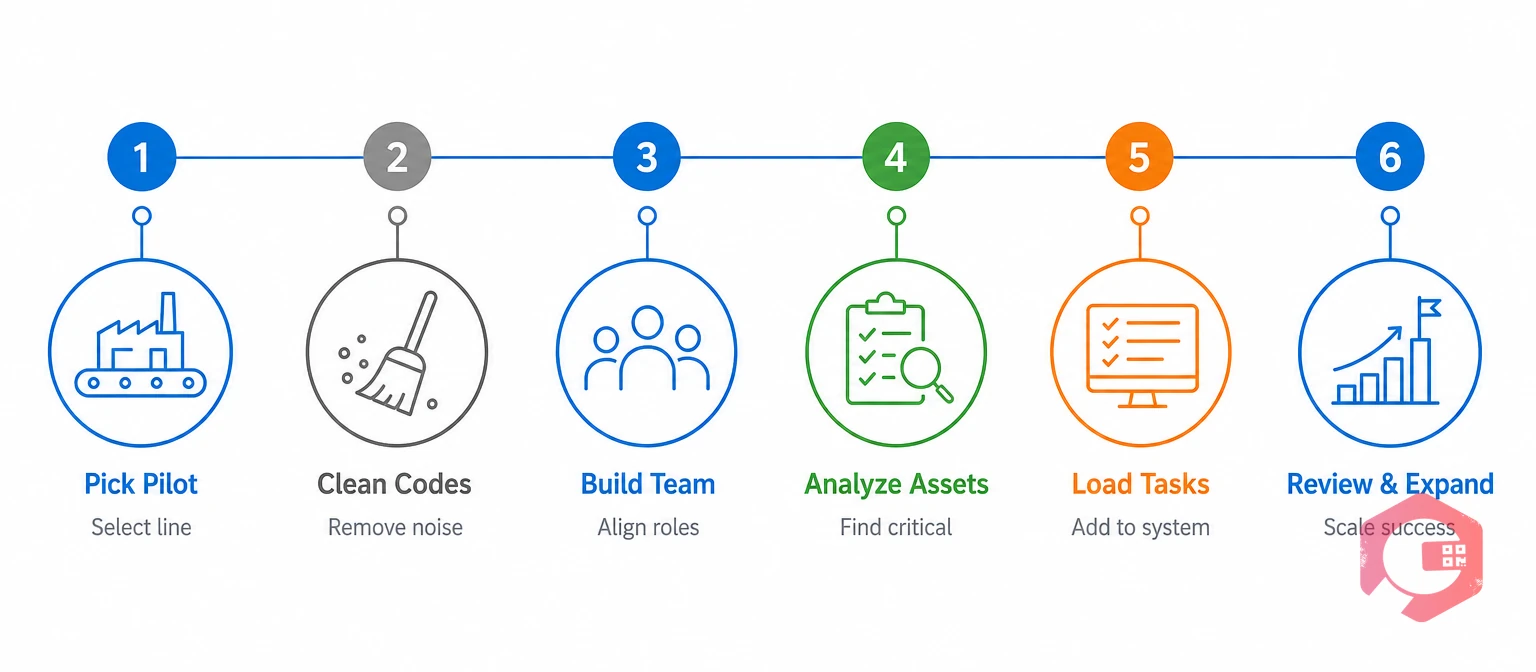
You can implement RCM in manufacturing by starting with one pilot line, proving results, and then scaling. Teams that try to cover the whole plant at once often stall in analysis.
Choose a line with high downtime, a known bottleneck, and decent failure records. Early wins there build support for the rest of the program. A line that already has a downtime problem also makes before-and-after results easy to see.
RCM decisions are only as good as the data behind them. Standardize failure codes and close out old work orders, so your history reflects real failure modes.
Include a planner, a reliability engineer, a senior technician, and an operator from the line. Operators often know early warning signs that never reach the work order system.
Use the criticality scores to pick the first five to ten assets. Work through functions, failure modes, effects, and task selection for each one.
Turn every decision into a scheduled task, inspection route, or monitoring alert. Strong work order management keeps tasks assigned, tracked, and timed around production windows.
Compare downtime, MTBF, and PM hours before and after the pilot. Feed lessons into the next line, and repeat the review every year as equipment and products change.
Most plants that sustain RCM in manufacturing treat it as a living program, not a one-time study. New equipment, new products, and new failure data should all trigger a fresh look at the task plan.
A Computerized Maintenance Management Software ties these steps together by holding asset data, failure history, and task schedules in one place. Larger, multi-site operations can extend the same approach with EAM software.
Yes, if you scale the method to your size. Small plants rarely need full SAE JA1011 analysis on every asset. Applying streamlined RCM to your two or three bottleneck machines delivers most of the value with far less effort.
A focused team can usually analyze the top five to ten critical assets on a line in a few weeks of part-time work. Full RCM on complex equipment takes longer. Starting with a pilot line keeps the timeline short and the results visible.
RCM decides which maintenance tasks each asset needs based on its failure modes and consequences. TPM focuses on operator involvement, autonomous maintenance, and reducing OEE losses. Many plants use both, with RCM setting the task plan and TPM building ownership on the floor.
Low-cost assets with redundancy and no safety or quality impact rarely justify the effort. Standby units, small hand tools, and cheap components are often better served by run-to-failure with spares on hand. Focus RCM on assets where a failure stops or slows production.
You can do the analysis in a spreadsheet, but running the program there is hard. The tasks, schedules, and failure history need to live in a system that technicians use every day. A CMMS keeps RCM decisions active instead of stuck in a file.
RCM links each failure mode to the OEE loss it causes, whether that is availability, performance, or quality. When the team picks a task for a failure mode, it is targeting a specific loss. That makes it easy to measure whether RCM in manufacturing is moving OEE in the right direction.
RCM works best when every decision turns into a scheduled task backed by real failure data. Schedule a free demo to see how Cryotos helps manufacturing teams rank critical assets, run condition-based tasks, and cut unplanned downtime on their bottleneck lines.



Cryotos AI predicts failures, automates work orders, and simplifies maintenance—before problems slow you down.



