

Bearing failures are best prevented by studying how each bearing failed before and fixing the cause, instead of only replacing the part. Failure history shows where bearings fail, failure type shows why they fail, and maintenance analytics shows how often. Together, these three views turn repeat breakdowns into a clear plan.
Most maintenance teams already hold this evidence in old work orders, downtime logs and technician notes. This guide shows how to organize it, read it and act on it. You get a failure type table, a history register, the BEAR Framework and a bearing maintenance schedule. It also shows how a Computerized Maintenance Management System (CMMS) keeps the record in one place.
Key Takeaways
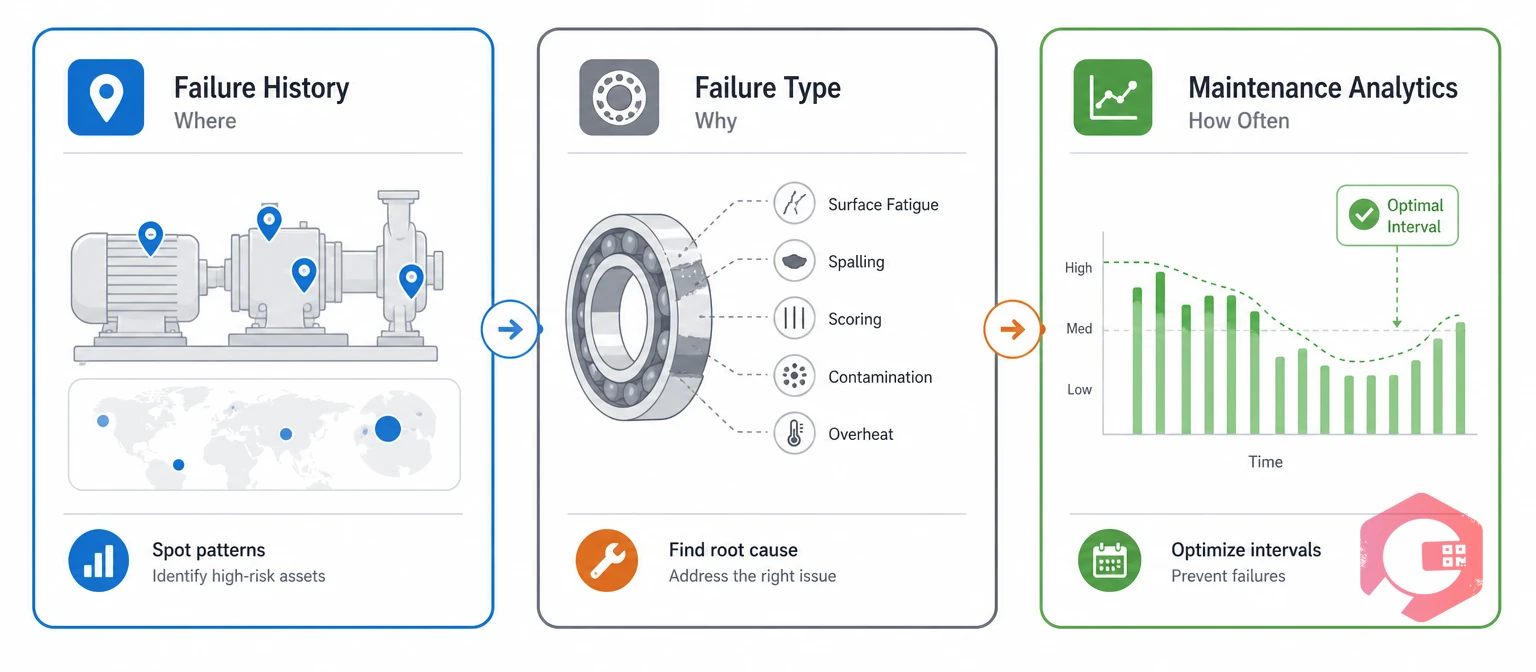
A bearing failure is the point at which a bearing can no longer carry its load, run smoothly or hold its position. It may be a sudden seizure, or a slow rise in noise, heat and vibration that ends in a forced stop.
A rolling-element bearing depends on a thin lubricant film, clean surfaces and correct alignment. When one of these slips, damage starts. ISO 15243 groups the resulting damage into six types: fatigue, wear, corrosion, electrical erosion, plastic deformation, and fracture and cracking.
Both reliability-centered maintenance (RCM) and failure mode and effects analysis (FMEA) start from one question: how can this asset fail? Failure history answers it with your own data instead of a textbook list.
Failure history is the time-ordered record of every bearing replacement, repair and inspection finding on an asset. It answers three questions that a single repair never can.
Without history, each failure looks like bad luck. With history, the pattern is visible, and the fix becomes a decision.

Most bearing failures fall into six types, and each type leaves its own mark on the bearing and its own pattern in your records.
| Failure Type | What You See | Typical Root Causes | First Check | Suggested Code |
|---|---|---|---|---|
| Fatigue (spalling) | Flaking on raceways or rolling elements; noise and vibration that grow over time | End of life, overload, misalignment, thin lubricant film | Compare running hours with rating life; check loads and alignment | BRG-FAT |
| Wear | Dull, scored or polished surfaces; looser internal clearance | Dirt in the lubricant, wrong grease, too little grease | Check grease condition, quantity and seals | BRG-WEA |
| Corrosion | Rust, pitting or fretting marks on rings and rollers | Water ingress, washdown, long standstill | Inspect seals, washdown practice and storage | BRG-COR |
| Electrical erosion | Frosted pits or a washboard pattern (fluting) in the raceways | Current passing through the bearing on drive-fed motors | Test shaft voltage; inspect grounding ring | BRG-ELE |
| Plastic deformation | Dents in the raceway at rolling element spacing | Shock load, mishandling, static overload | Review handling, fitting method and transport | BRG-DEF |
| Fracture and cracking | Cracked rings, rollers or cages | Excessive interference fit, impact, heavy overload | Check fits and installation procedure | BRG-FRA |
A failure code is a short standard label that records how a bearing failed. Use the code column as a pick list in your work orders, and keep the list to six to ten codes, so technicians use it.
Lubrication faults and contamination sit in the root cause column of several types. Bearing makers' failure studies commonly link about a third or more of premature failures to lubrication. The share varies by industry and study. A failure type recorded at the machine is worth more than a long note written later.
A bearing failure history register records every one of your bearing failures against the exact asset and bearing position, not only the machine name. Position matters because the drive-end and non-drive-end bearings on one motor often fail for different reasons.
| Field | What to Record | Example Entry | Why It Helps |
|---|---|---|---|
| Asset and position | Machine, shaft position and bearing number | Gearbox GB-14, output shaft, 22314 | Separates a bad position from a bad machine |
| Failure code | One code from the type table | BRG-WEA (wear) | Groups similar failures for analysis |
| Running hours | Hours or cycles since the last bearing change | 2,100 hours | Feeds life, MTBF and failure rate |
| Condition found | A photo and a plain-language note | Wet grease, scored raceway | Gives evidence for the root cause |
| Cause and action | Confirmed cause and the fix applied | Worn seal, water entry, seal replaced | Shows which fixes held |
Three simple rules keep the register useful.
Use the free failure rate calculator to turn your bearing counts and running hours into a failure rate for each asset.
A complete register costs a few minutes per failure and pays back every time the same bearing fails again.
Maintenance analytics is the use of maintenance records to find trends and rank problems. Applied to the register, it counts, groups and compares bearing failures over time. Six views cover most questions about repeat bearing failures.
The numbers below are illustrative, not from a named customer. A conveyor gearbox output bearing fails four times in a year, at 2,100, 1,900, 2,300 and 2,000 running hours. The average life is 2,075 hours, against a design life of about 20,000 hours.
All four failures carry the wear code, and three notes mention wet grease. Four failures at roughly a tenth of design life point to a cause outside the bearing, most likely water entering past a worn seal. A fifth replacement would repeat the problem, while a new seal and a changed washdown method treat it.

The BEAR Framework is a four-step loop that turns failure history, failure type and analytics into actions that prevent bearing failures. Run it for each critical asset, then repeat it as new data arrives.
The BEAR Framework for Bearing Reliability:
Changing a grease interval before you know the failure type often treats the wrong problem. Classify first, then act. Most facilities that skip classification end up adding tasks that never change the failure pattern.
Review critical assets monthly and the rest quarterly, so new bearing failures are classified while the evidence is fresh. A short review that ends with one named action beats a long review that ends with a list.
A bearing maintenance schedule works best when each task is tied to the failure type it prevents, not to a generic calendar date. Use the table as a starting point and adjust intervals to OEM guidance and your own history. A schedule aimed at known causes stops bearing failures that a generic date would miss.
| Failure Type | Preventive Task | Typical Starting Frequency | Condition Trigger |
|---|---|---|---|
| Wear and lubrication faults | Regrease with the measured quantity of the specified grease; inspect seals | Weekly to quarterly, based on speed and duty | Temperature rise or growing high-frequency vibration |
| Contamination | Check and replace seals and breathers; clean fittings before greasing | Monthly | Dirt or water found in a grease sample |
| Fatigue | Track running hours and plan replacement before the shortest observed life | At each planned outage | Rising vibration at bearing defect frequencies |
| Misalignment and looseness | Check shaft alignment and soft foot; tighten mounts | After every repair and at planned outages | Axial vibration or uneven bearing temperatures |
| Electrical erosion | Inspect grounding rings and measure shaft voltage on drive-fed motors | Quarterly or at each drive service | Rising high-frequency noise on drive-fed motors |
| Installation damage | Use the correct tools, heating method and torque, and record who fitted the bearing | At every installation | Early failure well below observed life |
Load these tasks into preventive maintenance software, so each one creates a work order on time with the right checklist attached. Meter-based triggers suit bearings well, because wear follows running hours more closely than calendar days.
Condition monitoring closes the gap between fixed intervals. When vibration or temperature crosses a limit, the task moves forward instead of waiting for its date.
A CMMS prevents bearing failures by keeping every bearing event, cause and task attached to the asset it belongs to. That single record is what makes trend analysis possible.
Maintenance teams using Cryotos have reported up to 30% reduction in unplanned downtime and 25% faster repair turnaround. Results vary by site, asset mix and how consistently technicians record failure data.
Bearing failures repeat for a handful of reasons, and most are record keeping habits rather than equipment faults.
Fixing these habits costs little and improves the data from the first week.
Lubrication problems, contamination, misalignment, overload and poor installation cause most premature bearing failures. Normal fatigue ends the life of a healthy bearing, but it is rarely the reason a bearing fails early. Your own failure history shows which cause leads at your site.
It shows which positions fail, why they fail and how long they last. That evidence points maintenance work at the real cause. It also shows whether a change, such as a new seal or grease, made bearing life longer.
Six to ten codes work for most teams. Start with the six ISO 15243 damage types and add a code for installation damage if it is common at your site. A short list gets used, and a long list gets ignored.
Aim for at least three failures on the same position, or twelve months of data on a critical asset. Fewer records can mislead. If data is thin, change one variable at a time and measure the result.
Yes. Old records may be thin, but every well-recorded failure from today builds a more useful history. Many teams begin with their most failure-prone positions and use a standard failure code list from day one.
Bearing failures stop repeating when every failure is recorded, classified and acted on. Schedule a free demo to see how Cryotos keeps bearing history, work orders and downtime data on every asset.



Cryotos AI predicts failures, automates work orders, and simplifies maintenance—before problems slow you down.



