How Fleet Companies Track Fuel Consumption Per Vehicle Without Manual Logbooks

Calendar
Duration:
13 min
calendar today
Published on
May 8, 2026
Featured Image

Fleet companies track fuel consumption per vehicle without manual logbooks by connecting each asset to automated data sources — OBD-II telematics ports, fuel cards with transaction feeds, or IoT tank sensors — that push real-time readings directly into a fleet management or CMMS platform. According to the U.S. Department of Energy's Federal Fleet Management Program, manual fuel logs carry an average error rate of 15–20%, meaning fleets relying on paper records routinely overpay for fuel, miss theft incidents, and file inaccurate compliance reports.

Key Takeaways

  • Manual logbooks fail at scale: Error rates of 15–20% mean a 50-vehicle fleet is routinely misreporting fuel spend by thousands of dollars monthly — and paper records cannot satisfy IFTA compliance requirements reliably.
  • Three technologies have replaced manual tracking: OBD-II telematics (reads live engine data), fuel cards (captures every pump transaction), and IoT tank sensors (continuous level monitoring for off-road equipment) each solve the problem differently depending on fleet type.
  • Fuel data and maintenance data belong together: A 10% spike in fuel consumption per 100 km is often the first detectable sign of an air filter blockage, tyre pressure drop, or injector fault — catching it early prevents breakdowns.
  • CMMS automation turns data into action: When fuel telemetry feeds into a CMMS, threshold breaches trigger preventive work orders automatically — no manual review required.
  • IFTA compliance is a non-negotiable driver: For fleets crossing state or provincial borders, per-vehicle fuel and mileage records are a legal requirement. Automated systems generate IFTA-ready reports in minutes instead of hours.

Why Manual Fuel Logbooks Fail Fleet Operations

Paper-based and spreadsheet fuel logbooks seem workable until you examine what happens at scale. A fleet of 50 vehicles completing daily routes generates hundreds of individual fuel entries each week. Drivers forget to log fill-ups, misread odometer readings, or record figures in a hurry at the pump.

Research from the Department of Energy found that inaccurate fuel records lead fleet operators to underestimate their true fuel spend by an average of 8–12% annually. For a fleet spending $500,000 per year on fuel, that gap represents $40,000–$60,000 in untracked costs that disappear into reporting errors, data entry mistakes, and undetected theft.

The Five Failure Modes of Manual Logbooks

  • Driver entry errors: Odometer misreads, transposed figures, and missed fill-ups are impossible to detect until the end-of-month reconciliation — by which point the data is too stale to act on.
  • No anomaly detection: A paper log showing 60 litres filled for Vehicle 23 looks identical to a log showing legitimate consumption. Fuel card skimming, unauthorized fills, and driver theft are invisible until the annual audit.
  • IFTA non-compliance risk: The International Fuel Tax Agreement requires precise per-vehicle, per-jurisdiction fuel and mileage records. Manual logs rarely meet the granularity required, exposing fleets to penalties of up to $1,000 per audit finding.
  • No link to maintenance: A manual logbook records litres dispensed — it has no mechanism to flag that Vehicle 12's fuel consumption rose 18% over the past three weeks, which is a classic symptom of a failing injector or blocked air filter.
  • Reconciliation bottleneck: Fleet managers spend an average of 6–10 hours monthly reconciling fuel receipts against logbook entries. That time disappears with automated tracking.

The Three Technologies Fleet Companies Use Instead

Three fleet fuel tracking technologies: OBD-II telematics, fuel cards with transaction feeds, and IoT tank sensors | Cryotos

There is no single hardware standard for automated fuel tracking — fleet companies choose the approach that fits their vehicles, budget, and existing systems. Three technologies dominate the field, each solving a different piece of the tracking problem.
OBD-II Telematics and CANbus Sensors

  • How it works: A telematics device plugs into the vehicle's OBD-II port (standard on all commercial vehicles built after 1996) or connects directly to the CANbus data network on newer trucks. The device reads the engine control unit's live fuel consumption data — actual injection volume per combustion cycle — and transmits it via cellular or satellite connection to the fleet management platform.
  • Best for: On-road fleets of cars, vans, and light-to-medium trucks where OBD-II ports are standard fitment.
  • Data quality: The highest available — direct engine data with no human input step and no approximation from pump fill volumes.
  • Cost range: $15–$80 per device. No vehicle modification required. Installation time: under five minutes per vehicle.

Fuel Cards with Automated Transaction Feeds

  • How it works: Each driver is issued a fleet fuel card restricted to fuel purchases at approved stations. Every transaction captures the date, time, location, vehicle ID, odometer reading (entered by the driver at the pump), and quantity dispensed. Data feeds directly into the fleet management system via API integration — no manual data entry step.
  • Best for: Fleets where drivers refuel at public stations across a wide geographic area, particularly for IFTA compliance where jurisdiction-level fuel records are required by law.
  • Anomaly detection: Cross-referencing card transactions against GPS location data catches fuel card misuse — a transaction at a station 200 km from the vehicle's logged position is flagged automatically.
  • Cost range: Cards are typically issued at no cost; the integration layer charges a platform or transaction fee depending on the provider.

IoT-Enabled Fuel Tank Sensors

  • How it works: Ultrasonic or pressure-based sensors mounted inside fuel tanks transmit continuous tank level readings at defined intervals — typically every 30 to 60 seconds. The system calculates consumption by comparing level readings over time, eliminating the pump-based transaction as the measurement point entirely.
  • Best for: Off-road heavy equipment, generators, agricultural machinery, and stationary fuel tanks that don't pass through conventional pump infrastructure. According to the IEA's 2023 Transport Tracking report, IoT fuel monitoring for non-road mobile machinery has grown 34% year-on-year.
  • Additional benefit: Real-time theft detection. A sudden tank level drop that doesn't correspond to a scheduled operation is flagged as a potential siphoning event within minutes.

How Automated Fuel Tracking Works Step by Step

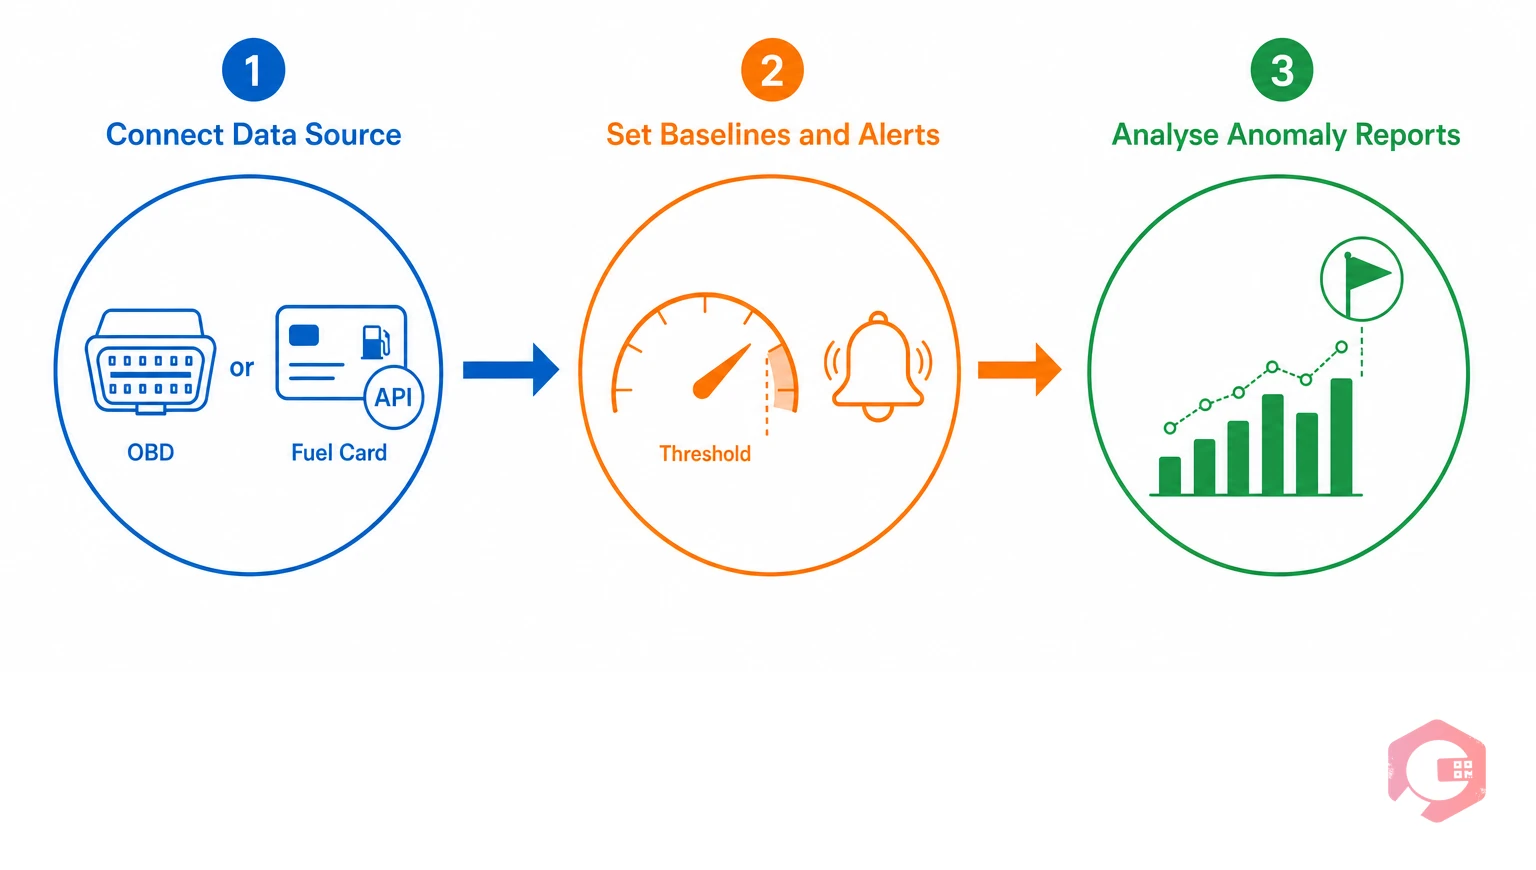
Three-step automated fleet fuel tracking process: connect data source, set baselines and alerts, analyse anomaly reports | Cryotos

Regardless of which data source a fleet uses, implementation follows three core steps that take most fleets from zero to live reporting within one week.

Step 1: Connect the Data Source

Install OBD-II devices, provision fuel cards with API integration, or mount IoT sensors — depending on fleet type. The fleet management platform or IoT meter reading module ingests the data feed and maps each data stream to a specific vehicle asset record. Every vehicle now has a unique identifier in the system tied to its real-time fuel consumption stream.

Step 2: Set Per-Vehicle Baselines and Alert Rules

The platform establishes a consumption baseline for each vehicle based on its make, model, load capacity, and typical route profile. Fleet managers configure alert thresholds: flag any vehicle consuming more than 10% above its 30-day rolling baseline, flag any fill event exceeding the tank's known capacity, flag any consumption event occurring outside scheduled operating hours.

Step 3: Analyse Reports and Act on Anomalies Automatically

Daily and weekly fuel reports are generated automatically by vehicle, route, driver, and department. Anomaly alerts go directly to the fleet manager's dashboard and, when a CMMS is connected, trigger work order creation for investigation. The fleet manager shifts from data entry to exception management — reviewing the 3–5 flagged anomalies instead of reconciling 500 manual log entries.

How a CMMS Ties Fuel Data to Vehicle Maintenance

Fuel efficiency and vehicle health are directly linked. A 10–15% rise in fuel consumption per 100 km is frequently the first detectable sign of a maintenance issue — before any dashboard warning light appears and before the driver notices any change in performance.

Common maintenance conditions that show up first as fuel anomalies include: clogged air filters (can increase fuel consumption by 10%), incorrect tyre pressure (every 10 PSI under-inflation increases fuel use by 2–3%), failing oxygen sensors (can increase fuel consumption by up to 40%), and injector fouling (typically adds 5–15% to consumption per injector affected).

When a CMMS is connected to fuel telemetry, it can create a work order automatically when a vehicle's fuel consumption crosses a defined threshold. A logistics company operating a mixed fleet of 80 vans found that automating this rule in their CMMS reduced unplanned breakdowns by 31% within six months — because fuel spikes were flagging maintenance issues weeks before they became failures.

Total Cost of Ownership at the Individual Vehicle Level

Linking fuel data to maintenance history in a CMMS enables per-vehicle TCO analysis that fleet-wide averages cannot provide. A vehicle with high fuel consumption and frequent work orders may look acceptable when aggregated with 49 well-performing vehicles — but in individual asset reporting, it flags immediately as a candidate for early replacement or major service.

According to a McKinsey analysis, fleets that track TCO at the individual asset level reduce their per-kilometre operating costs by 18–22% compared to those using fleet-wide averages. The difference is not in how much they spend on maintenance — it is in where they spend it.

Cryotos's downtime tracking module logs vehicle-off-road time against each maintenance event, making it possible to calculate the true cost of each unplanned failure — fuel anomaly to breakdown to downtime cost — as a single connected record.

What to Look for in Fleet Fuel Tracking Software

Five key capabilities to look for in fleet fuel tracking software: multi-source data, per-vehicle granularity, configurable alerts, CMMS integration, IFTA reporting | Cryotos

Not all fleet fuel tracking platforms are built to the same standard. A fuel card portal that shows transaction totals is not the same as an integrated system that connects consumption data to maintenance decisions. When evaluating options, prioritise these six capabilities.

CapabilityWhy It MattersWhat to Check
Multi-source data ingestionMixed fleets need OBD-II, fuel cards, and IoT sensors simultaneously — a platform that handles only one source leaves coverage gapsDoes the platform support API connections from multiple fuel card networks alongside telematics feeds?
Per-vehicle granularityFleet averages hide individual underperformers; per-vehicle reporting surfaces the specific assets driving your fuel cost overrunsCan you generate a per-vehicle consumption trend report covering the past 90 days in under 60 seconds?
Configurable alert rulesDifferent vehicle types and route profiles have different consumption baselines — one-size thresholds generate false positives that managers learn to ignoreCan thresholds be set per vehicle category, with separate rules for urban vs highway vs off-road operations?
CMMS or ERP integrationFuel anomaly data is only actionable when it creates a maintenance event automatically — a standalone fuel portal requires manual intervention at every stepDoes the platform offer a native connector or API to your CMMS for automated work order creation on threshold breach?
IFTA-ready reportingInter-jurisdictional fleets have a legal obligation to produce accurate per-vehicle, per-jurisdiction fuel records on demandDoes the platform generate IFTA-formatted reports directly, or does someone have to manually compile jurisdiction data at quarter-end?
Mobile accessFleet managers and drivers are rarely at a desk — real-time alerts and exception management need to work on a smartphoneIs the mobile app fully functional for exception management, or is it a read-only dashboard that requires desktop for any action?

A fleet that connects fuel tracking directly to its preventive maintenance schedule gains the most value from the investment. The system becomes a continuous vehicle health monitor — not just a fuel cost ledger.

Fleet Fuel Tracking ROI: The Numbers That Justify the Investment

Fleet managers frequently face internal pushback on automated fuel tracking investment. The business case becomes straightforward when the savings are quantified against the cost of the status quo.

Where the Savings Come From

  • Fuel theft and card misuse elimination: The Department of Energy estimates automated monitoring reduces fleet-specific fuel losses by up to 40%. For a 50-vehicle fleet spending $500,000 annually on fuel, a 5% theft or misuse rate represents $25,000 in recoverable savings.
  • Maintenance cost reduction from early detection: Catching a fuel consumption anomaly six weeks before it becomes a breakdown converts a $5,000–$15,000 unplanned repair into a $400–$800 scheduled service visit — and eliminates the vehicle-off-road downtime cost entirely.
  • IFTA audit penalty avoidance: A single IFTA audit with inadequate records can generate penalties of $50–$500 per jurisdiction finding. Automated systems produce audit-ready records at the push of a button.
  • Fleet manager time recovery: At 8 hours of manual reconciliation per month per 50 vehicles, automated tracking returns roughly 96 hours annually to fleet management — time redirected to route optimization, driver coaching, and procurement.

For most fleets, automated fuel tracking pays for itself within 3–6 months of full deployment.

Frequently Asked Questions

Can small fleets under 20 vehicles justify automated fuel tracking?

Yes — and the ROI often arrives faster for smaller fleets because theft and anomalies represent a larger percentage of a smaller total spend. OBD-II dongles cost between $15–$80 per device and require no vehicle modification. Most small fleets are generating automated fuel reports within one week of beginning the rollout, with the system paying for itself within 3 months if even one fuel theft incident is caught.

Does automated fuel tracking prevent fuel theft?

It detects and deters it. When a sudden tank level drop does not correspond to a fuel card transaction or a scheduled operation, the system flags the discrepancy within minutes. Cross-referencing fuel card transactions against vehicle GPS location catches card misuse — a fill event at a station 300 km from the vehicle's logged position is an immediate alert. The Department of Energy estimates automated monitoring reduces fleet-specific fuel losses by up to 40%.

How long does it take to set up automated fuel tracking?

For OBD-II telematics, a technician can install a device in under five minutes per vehicle. Fuel card API integration typically takes one to three days for the platform connection, plus a week for baseline data to accumulate. IoT tank sensor installation on heavy equipment varies by tank design — typically two to four hours per unit including calibration. Most fleets are generating automated fuel reports within one week of beginning the rollout.

Is automated fuel tracking compliant with IFTA requirements?

Yes — purpose-built fleet fuel tracking systems generate IFTA-formatted reports that capture the per-vehicle, per-jurisdiction fuel and mileage data the International Fuel Tax Agreement requires. Manual logbooks rarely meet the granularity or accuracy standards IFTA auditors apply. Switching to automated tracking typically eliminates IFTA audit preparation time by 80% or more and significantly reduces the risk of penalty-generating discrepancies.

What data does a fleet manager see in a fuel tracking dashboard?

A complete fuel tracking dashboard shows: per-vehicle fuel consumption in litres per 100 km or miles per gallon, consumption trends over 7, 30, and 90-day windows, anomaly flags comparing each vehicle against its individual baseline, fuel card transaction history with location and driver attribution, total fleet fuel cost by vehicle and by department, and IFTA-formatted jurisdiction summaries for compliance reporting. The most advanced systems surface predictive maintenance triggers when consumption patterns indicate a specific fault type.

If your fleet team is ready to replace manual logbooks with real-time fuel visibility, Cryotos work order management connects fuel telemetry data directly to preventive maintenance workflows — automatically creating work orders when vehicles cross consumption thresholds, tracking repair outcomes against fuel efficiency improvements, and closing the loop between fuel data and vehicle health. Book a free demo today to see the full fleet maintenance workflow in action.

Want to Try Cryotos CMMS Today?

Get Free Demo

Let AI Take Control of Your Maintenance

Cryotos AI predicts failures, automates work orders, and simplifies maintenance—before problems slow you down.

Try AI-Powered CMMS
🡢