
In this modern high-speed industrial world, unplanned equipment failures are not merely an inconvenience but a huge financial loss. The expense of having an asset idling, whether due to mechanical failure or lack of parts, is way beyond the repair bill. It disturbs production timelines, shipment delays, and profit margins, which affects your bottom line and customer confidence.
Nevertheless, the days of firefighting are being replaced with reactive ones. The major organizations are evolving to overcome the breakdowns by preventing them. With the help of systems of modern maintenance, companies can transition from a guess-based approach to a data-based approach. This change makes maintenance a competitive center rather than a cost center, whereby the assets are maintained before they malfunction.
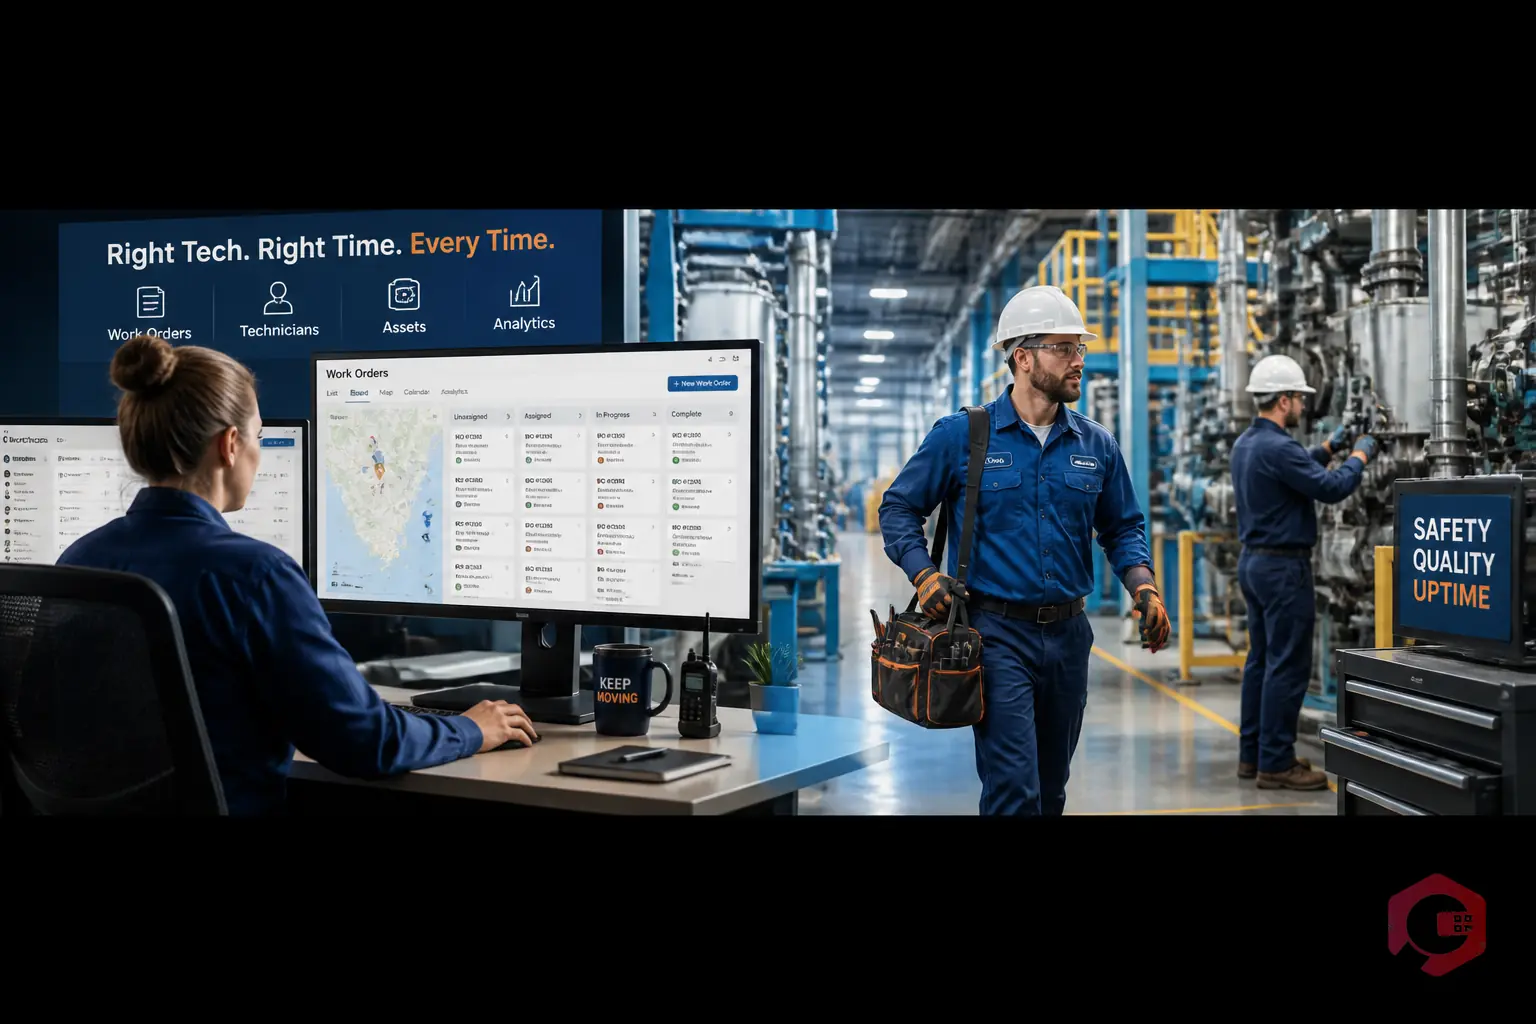
At this point, Cryotos comes in. Being a mobile-first and full-fledged CMMS, Cryotos combines work order management, predictive analytics, and real-time monitoring into a single intuitive solution. It enables your team to anticipate failures, schedule optimally, and have complete visibility of your assets so that your operations will run without any interruption at a high cost.
Unproductivity is the bane of business. The cost of an idle asset goes way further than the repair bill, whether due to mechanical failure, unavailability of part and human error. It will comprise lost production volume, missed deadlines, and possible reputational damage.
The bad news is that nowadays maintenance technologies, namely Computerized maintenance management system (CMMS), IoT, and AI, offer the visibility and control that will reduce these interruptions. This is the way in which the technology turns maintenance into a competitive aspect rather than a cost center.
The concept of mobility is a revolution for maintenance teams. Mobile CMMS application emancipates technicians and their desktops as well as paperwork.
Predictive maintenance (PdM) is a new paradigm. PdM is able to use data to maintain machines only when they require it, instead of maintaining machines on fixed schedules whether they need it or not.
The Internet of Things (IoT) provides a voice to your equipment. Another benefit of smart sensors installed on vital assets is the ability to see the health of your asset 24/7.
As much as the future is predictive maintenance, a strong Preventive Maintenance (PM) approach forms the basis of reliability.
There is nothing that you cannot measure and improve. Maintenance technology converts raw data to actionable intelligence.
The use of technology is also instrumental in filling the skills gap and trapping tribal knowledge.
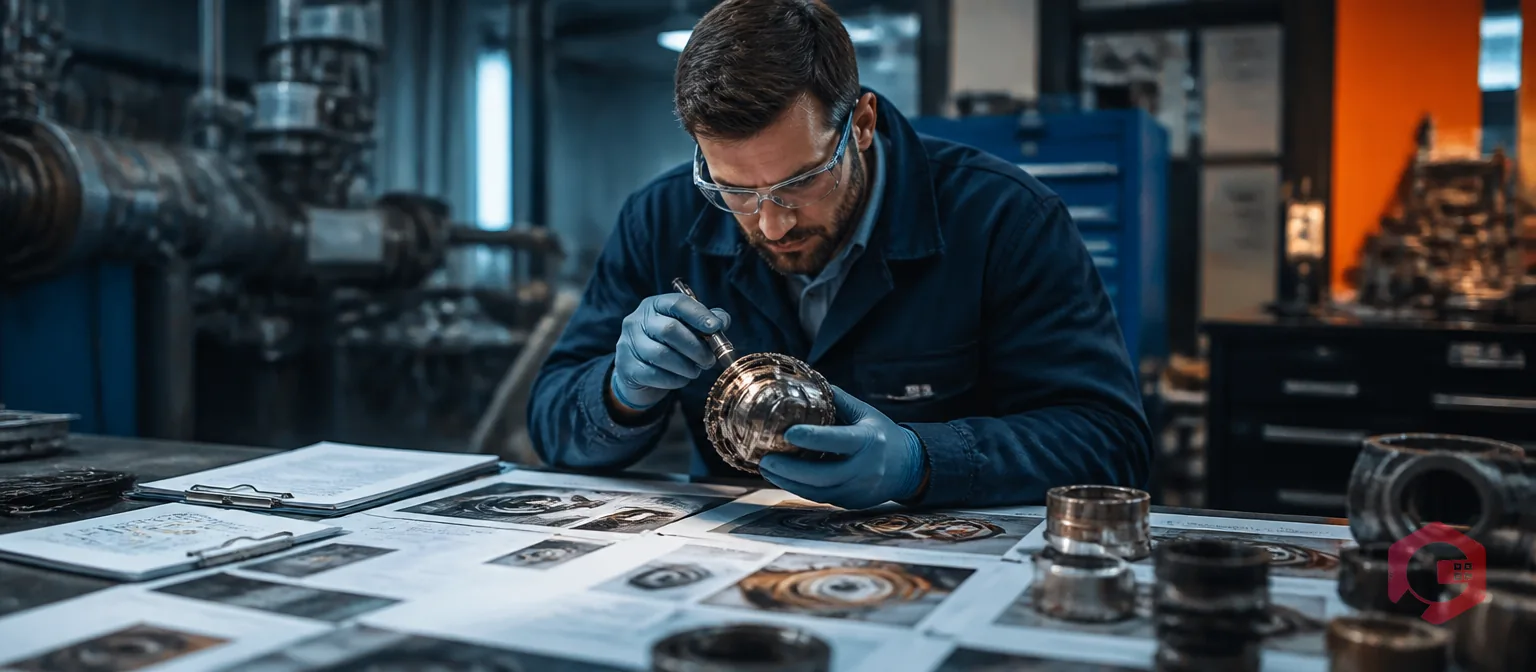
An in-depth online history can be essential to the diagnosis of a recurring problem.
The advantages of maintenance technology, as they are considered in theory, are justified by the outcomes in the field. The various industries are using these tools in the following manner:
The Challenge: A car manufacturing facility had been experiencing frequent, random failures on one of its assembly lines of critical importance, which had shut down its operations and cost the plant colossal losses.
The Solution: The manufacturer added a Condition Monitoring system to their Cryotos CMMS.
The Result: AI-based algorithms identified unusual vibration patterns of early-bearing wear. This system had an automatic alert that was triggered, and maintenance was done during a shift change. The outcome was zero unplanned downtime and continuous production flow.
The Challenge: A clothing manufacturing company was using paperwork orders, and the process was slow and delayed in correcting any problems with the looms
The Solution: They implemented a Mobile CMMS to provide instant access for floor technicians to work orders and inventory information.
The Result: Turnaround times were lowered. The tightened feedback process resulted in increased equipment supply and a sharp rise in the overall productivity of the plant.
The theory of reducing downtime requires understanding, yet proper implementation needs a suitable partner. Cryotos provides a complete CMMS solution that operates through mobile devices to transform maintenance plans into actual work processes.
Cryotos software operates as his solution to handle the specialized needs of contemporary industrial sectors, which include manufacturing, energy, and facility management. Our platform integrates IoT sensors with predictive analytics and work order management into a single user-friendly system. The system enables your team to see asset health in real-time while it schedules preventive maintenance automatically and provides technicians with needed parts at precise times.
Cryotos transforms your maintenance process through its AI-based reporting system and user-tailored workflows, which create digital maintenance solutions. The Cryotos software purchase enables you to acquire a system that protects your system uptime while decreasing operational expenses and promoting continual enterprise enhancements.
The process of decreasing downtime now requires organizations to develop methods for predicting equipment failures instead of pursuing faster machine repair solutions. Your maintenance plan achieves asset protection through IoT sensors and mobile capabilities, and predictive analytics, while it empowers your workers and protects your financial results.
The shift from reactive "firefighting" methods to proactive reliability practices establishes the essential competitive edge for contemporary businesses. The correct technology transforms maintenance activities from an expense category into a source that enhances operational performance.
Ready to Eliminate Unplanned Downtime? Don't let equipment failure dictate your production schedule. Experience how Cryotos can transform your maintenance operations with our industry-leading CMMS and predictive tools.


Cryotos AI predicts failures, automates work orders, and simplifies maintenance—before problems slow you down.


