Leading maintenance indicators are metrics that predict future equipment performance and reliability — they measure the quality of actions taken before failures occur. Lagging maintenance indicators measure outcomes after the fact — breakdowns, downtime hours, repair costs, and MTTR. Both matter, but most maintenance teams track almost exclusively lagging indicators: they know their MTTR after a breakdown, but have no visibility into the leading conditions that made that breakdown predictable weeks earlier. According to the Society for Maintenance and Reliability Professionals (SMRP), best-practice maintenance organisations track a balanced scorecard of 4–8 KPIs covering both leading and lagging dimensions — teams that track only lagging indicators consistently react to problems they had the data to prevent. This guide explains the difference between leading and lagging indicators, which specific metrics belong in each category, and how to build a dashboard that gives you early warning, not just a post-mortem.
Key Takeaways
The distinction between leading and lagging is a timing distinction. Lagging indicators measure results — what happened after the fact. Leading indicators measure inputs and process quality — what is happening now that will determine tomorrow's results.
In maintenance, every outcome you care about — equipment availability, unplanned downtime hours, repair cost per asset, mean time to repair — is a lagging indicator. It is the measurement of something that has already happened. A MTTR of 6 hours tells you your last repair took too long. It does not tell you why, and it does not tell you how to prevent the next one from taking as long or arriving as soon as it might.
Leading indicators work in the opposite direction. A PM completion rate of 68% this quarter tells you that roughly a third of your scheduled maintenance is not being executed. That gap is not yet a breakdown — but it is a reliable predictor that breakdowns are accumulating. The same logic applies to planned-to-reactive work ratio, parts availability at PM, open work order backlog age, and technician utilisation on planned versus unplanned work.
The practical value of leading indicators is that they give you time to act. When your PM completion rate drops below 80%, you have weeks to investigate and correct before the reliability consequences land. When your MTTR rises, the consequence has already occurred — the only question is whether the root cause will repeat.
Lagging indicators are not useless — they are the scoreboard. They quantify the cost of your current maintenance approach and measure whether that cost is improving or worsening over time. The mistake is treating them as the complete picture.
| Indicator | Type | What It Measures | When It Signals | Action Window |
|---|---|---|---|---|
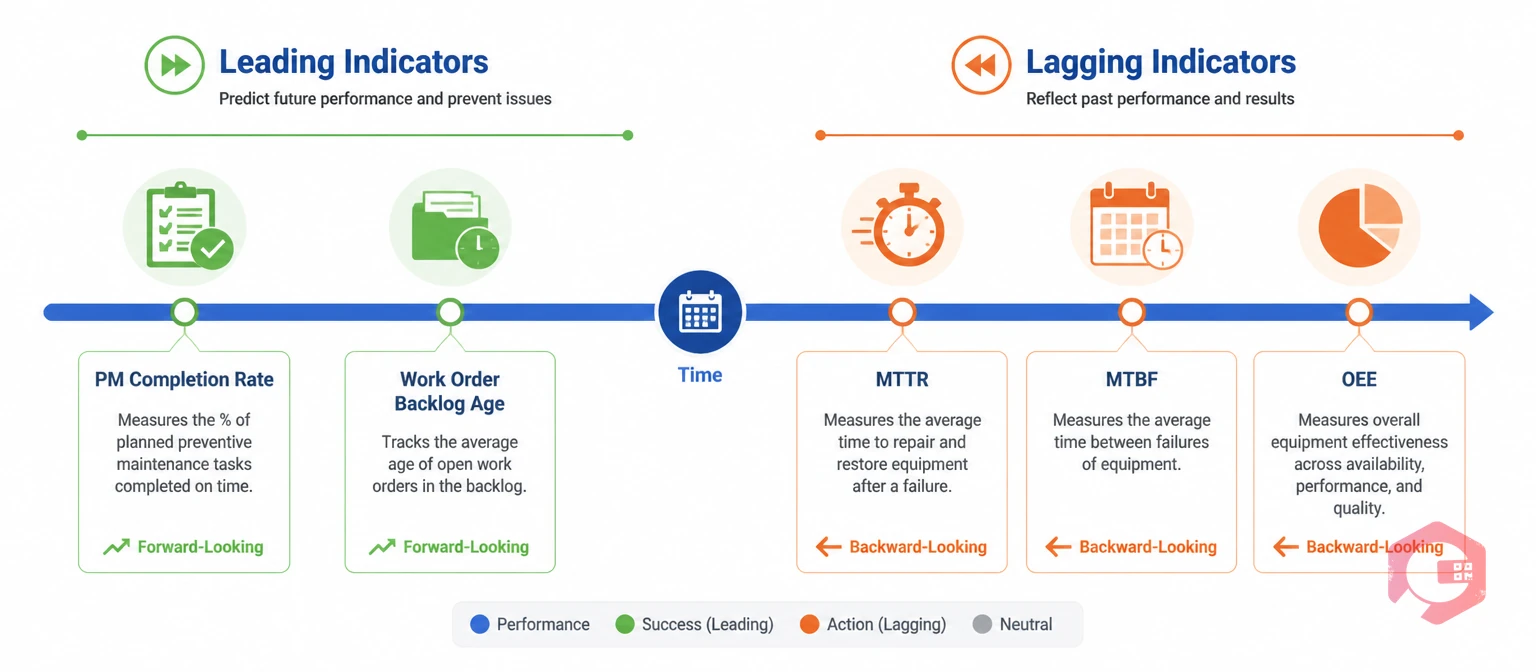
| MTTR | Lagging | Recovery speed after failure | After breakdown occurs | Post-event review only |
| MTBF | Lagging | Failure frequency per asset | After pattern of failures emerges | Post-event review only |
| OEE | Lagging | Overall production impact of downtime | After production period ends | Post-period review only |
| PM Completion Rate | Leading | % of scheduled PMs executed on time | Weekly — while gap is still correctable | Weeks before reliability impact |
| Planned-to-Reactive Ratio | Both | Programme health and reactive load | Weekly/monthly | Indicates trajectory |
| Work Order Backlog Age | Leading | Deferred maintenance accumulation | Real-time | Days to weeks before impact |
| Parts Availability at PM | Leading | Inventory readiness for scheduled work | Pre-PM trigger | Days before PM execution |
| Wrench Time | Leading | % of time technicians spend on actual work | Weekly | Indicates scheduling efficiency |
The action window column is the key differentiator. Lagging indicators have no action window — by the time they signal a problem, the cost has already been incurred. Leading indicators give you days or weeks to course-correct before the consequence lands in your downtime log.

These five leading indicators are consistently cited by maintenance engineering bodies as the highest-value predictive metrics for industrial and commercial maintenance operations. All five are calculable directly from CMMS work order data — no additional sensors or manual tracking required.
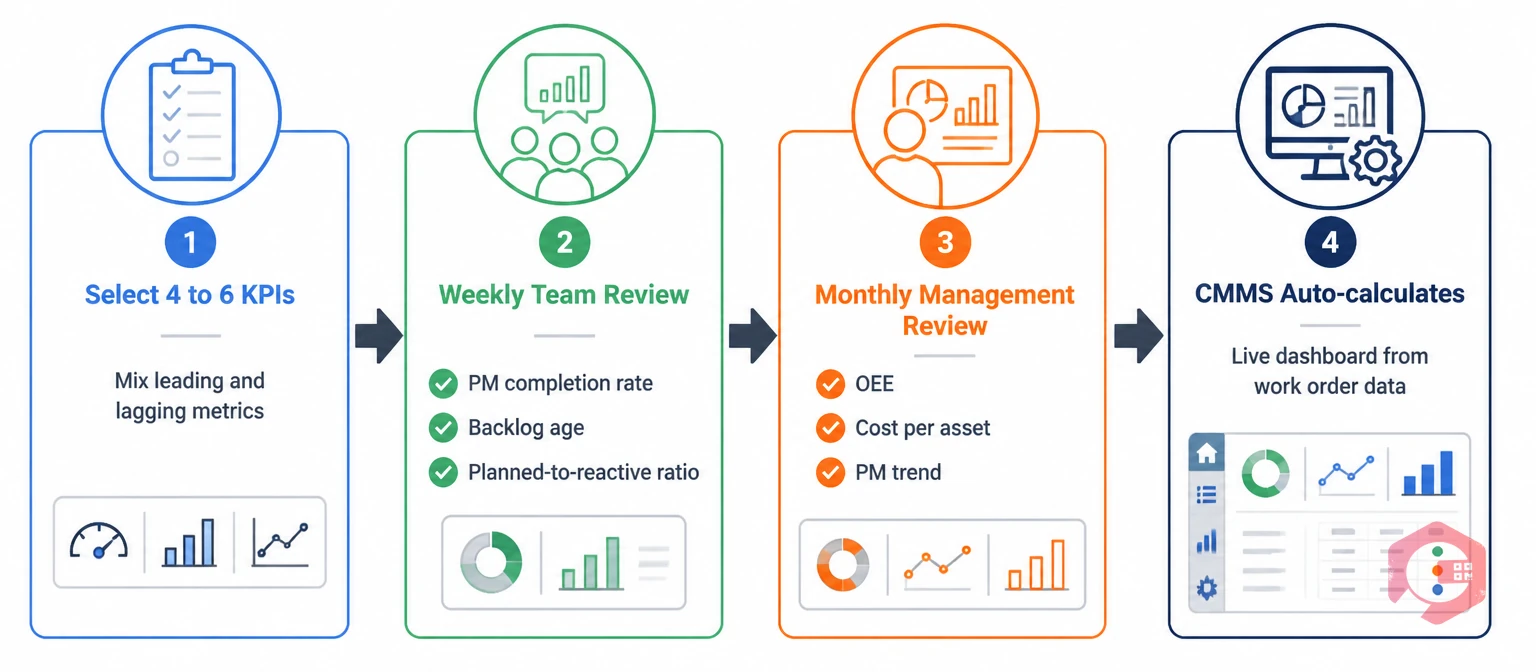
A practical maintenance KPI dashboard tracks 4–6 metrics — not 20 — covering both leading and lagging dimensions at the right update frequency. More metrics create noise; fewer miss the picture.
The recommended structure for most industrial or facility maintenance operations is two leading indicators, two lagging indicators, and one financial indicator reviewed weekly by the maintenance team and monthly by management.
For the weekly team review: PM completion rate (leading — are we executing the programme?), work order backlog age by criticality (leading — is deferred maintenance accumulating on critical assets?), planned-to-reactive ratio (both — are we trending toward control or reactivity?), and MTTR on critical assets (lagging — how is recovery performance trending?).
For the monthly management review: OEE or availability percentage (lagging — what is the business impact?), maintenance cost per asset (lagging — is spend trending correctly?), and PM completion rate trend (leading — is the programme maintaining discipline?).
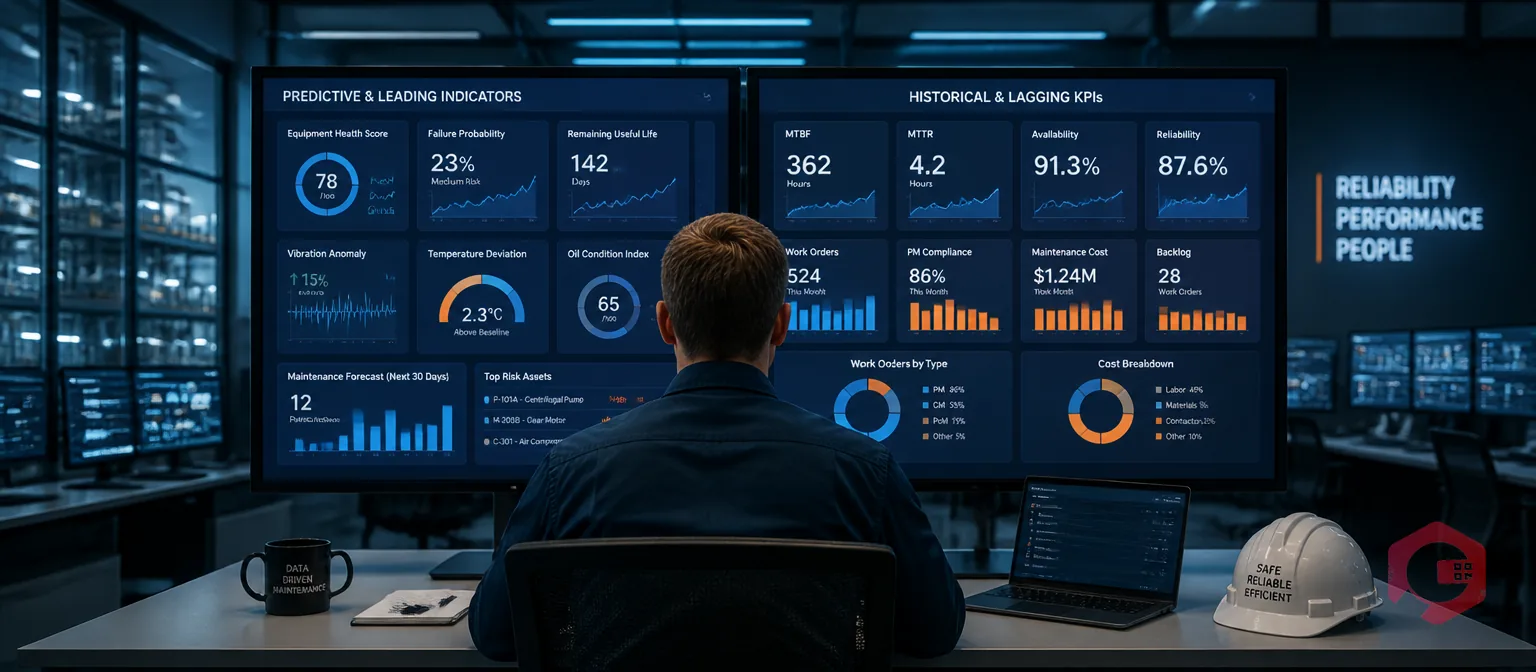
Cryotos's BI Dashboard surfaces all of these metrics automatically from work order data — PM completion rates, backlog age, planned-to-reactive ratios, MTTR, and cost per asset are all calculated live without any manual data extraction or spreadsheet work. Maintenance managers see the full leading-and-lagging picture in a single view, updated in real time as work orders are created, assigned, and closed. The report builder lets teams customise which metrics surface in which view — so the weekly team review shows the leading indicators that drive decisions, while the monthly management report shows the lagging outcomes that demonstrate programme value.
Leading indicators are only useful if you act on them. The most common failure mode is tracking PM completion rate, seeing it drop to 72%, noting it in a spreadsheet, and doing nothing different. The leading indicator fired — but without a defined response protocol, it is just another number in a dashboard that nobody acts on.
Each leading indicator in your dashboard needs a defined response threshold and a specific action trigger. PM completion rate below 85%: maintenance planner reviews all overdue PMs that week, identifies whether the cause is parts, technician capacity, or scheduling, and takes specific corrective action before next reporting cycle. Work order backlog age above 10 days on a critical asset: automatic escalation to maintenance manager for resource reallocation decision. Parts availability at PM below 90%: procurement review triggered to investigate which parts categories are causing execution delays.
According to Plant Maintenance Resource Center, maintenance teams that define and enforce response protocols for leading indicator thresholds reduce reactive work order volume by 25–40% within 12 months — the direct result of acting on early warning signals before they become breakdown events.
Build these thresholds and response protocols into your CMMS workflow configuration — so when a leading indicator crosses its threshold, the system generates the appropriate alert or work order automatically, rather than waiting for a human to notice the number in a report and decide what to do about it.
A leading maintenance indicator measures the quality of inputs and processes — what your team is doing now — and predicts future reliability outcomes. A lagging maintenance indicator measures the outcomes of past actions — breakdowns that occurred, downtime that happened, costs incurred. PM completion rate is a leading indicator: it tells you whether your PM programme is executing as planned before the reliability consequences arrive. MTTR is a lagging indicator: it tells you how well you recovered from a failure that has already occurred. Effective maintenance measurement requires both.
A PM completion rate of 90% or above is the benchmark for best-practice maintenance operations. At this level, 9 out of 10 scheduled PMs execute on or before their due date — close enough to 100% that the reliability programme is essentially intact. PM completion rates between 80–90% indicate a programme under pressure, with some PMs consistently deferred. Below 80% is a significant programme health risk — at this level, the backlog of deferred PMs is large enough to generate measurable increases in reactive work volume within 4–8 weeks.
Four to eight KPIs is the practical range for a maintenance team. Below four, you miss critical dimensions — either leading or lagging perspectives are absent. Above eight, the dashboard becomes noise and review meetings turn into data discussions rather than decision meetings. The priority is a balanced mix: 2–3 leading indicators that give you early warning, 2–3 lagging indicators that measure outcomes, and 1–2 financial indicators that connect maintenance performance to business cost.
Yes — all of the highest-value leading indicators are directly calculable from CMMS work order data without any manual extraction. PM completion rate comes from the ratio of PM work orders closed on time to PM work orders scheduled. Work order backlog age comes from the age distribution of open work orders. Parts availability at PM comes from inventory records cross-referenced against PM work order parts lists. Cryotos calculates and surfaces all of these automatically in the BI Dashboard — giving maintenance teams real-time leading indicator visibility without any spreadsheet work.
Tracking the right combination of leading and lagging indicators is what separates a maintenance team that manages its programme from one that simply reacts to it. Cryotos gives you the automated KPI dashboard — PM completion rates, backlog age, planned-to-reactive ratios, MTTR, OEE, and cost per asset — calculated live from your work order data and surfaced in a single view. Schedule a free demo to see how leading maintenance teams use Cryotos to track the indicators that predict problems, not just the ones that report them.


Cryotos AI predicts failures, automates work orders, and simplifies maintenance—before problems slow you down.


