
The maintenance maturity model is a five-level framework that describes how an organisation's maintenance function evolves from purely reactive — fixing things after they break — to a strategic capability that actively supports business goals, asset longevity, and operational resilience. Each level represents a distinct set of practices, KPIs, tools, and organisational behaviours. Understanding which level your plant currently operates at gives you a clear view of what's holding your maintenance performance back and what the realistic next step looks like.
This guide describes all five levels in practical terms, gives you a self-assessment checklist to locate yourself on the model, explains what moving to the next level actually requires, and connects each stage to the data and CMMS capabilities needed to sustain it.

| Level | Name | Primary Focus | Typical KPIs Tracked | Minimum CMMS Need |
|---|---|---|---|---|
| 1 | Reactive | Fix failures when they occur | Repair cost, downtime hours | None or basic work order log |
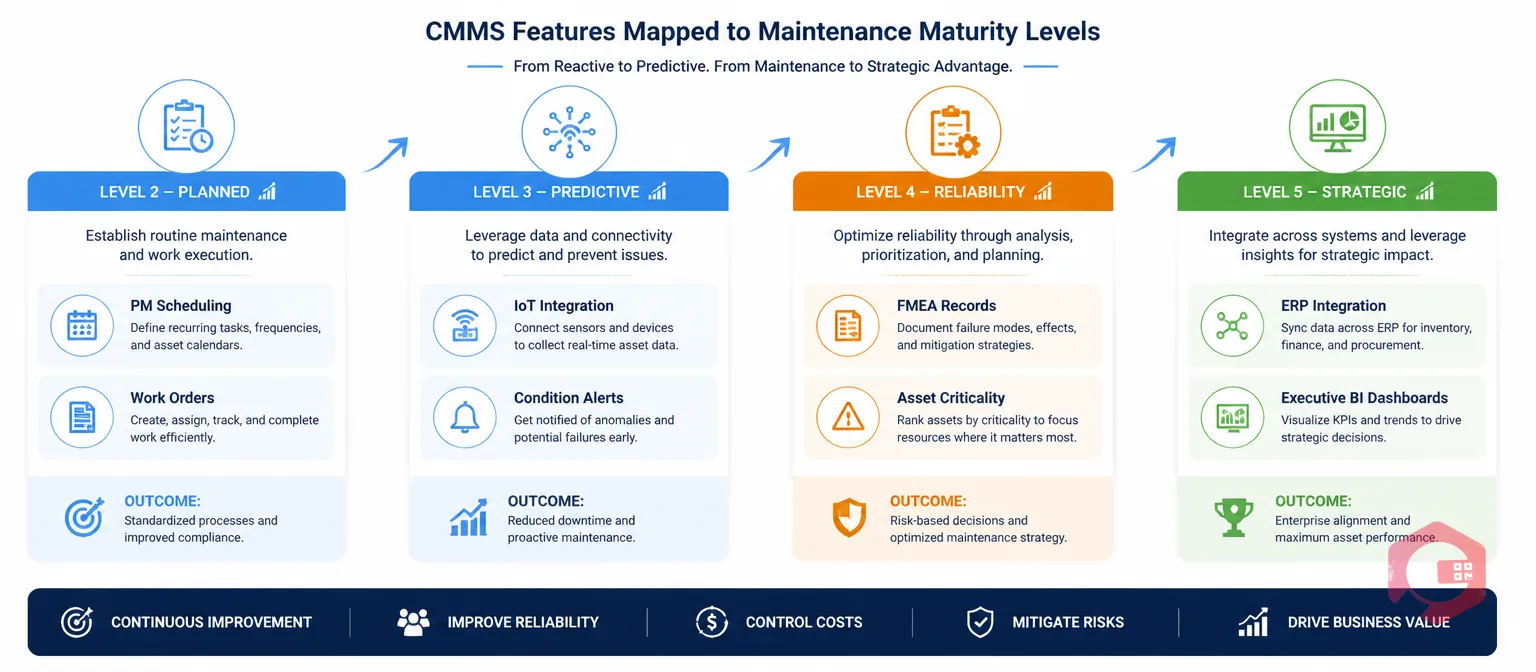
| 2 | Preventive | Prevent failures with scheduled tasks | PM compliance %, MTBF | PM scheduling and work order management |
| 3 | Predictive | Detect failure before it occurs | MTBF, MTTR, condition alert response time | IoT/sensor integration, CBM task management |
| 4 | Reliability-Centred | Right task for each failure mode and asset | Availability %, maintenance cost per asset, wrench time | Asset criticality classification, FMEA records, RCM task library |
| 5 | Business Enabler | Maintenance as a strategic value driver | OEE, asset lifecycle cost, TEEP, capital avoidance | EAM integration, full lifecycle costing, executive dashboards |
At Level 1, maintenance is entirely demand-driven. There are no scheduled inspections, no formal work order system, and no asset history. Equipment runs until it fails, and the maintenance team's job is to restore it as fast as possible. Technicians are permanently in firefighting mode — responding to the most recent alarm rather than preventing the next one.
Level 1 is more common than most organisations admit. According to the Society for Maintenance and Reliability Professionals (SMRP), the average plant spends 30–40% of its maintenance effort on reactive work. Plants at Level 1 typically spend 50–70% or more on reactive work, meaning the majority of the maintenance budget is consumed by failures that were never planned for.
The symptoms are hard to miss: high breakdown frequency on the same assets, long lead times to source parts because nothing is stocked in advance, technician overtime as the norm rather than the exception, and maintenance costs that feel unpredictable because they spike with every major failure. Corrective maintenance dominates the schedule — or more accurately, there is no schedule.
What it takes to move to Level 2: The single biggest shift is introducing a formal work order process and a PM schedule for the highest-consequence assets. You don't need to schedule everything — start with the top 10–15 assets by downtime cost or safety consequence. Even a basic preventive maintenance system that generates recurring tasks and tracks completion rate moves the organisation out of pure reactivity within 90 days.
Level 2 organisations have introduced time-based or usage-based maintenance schedules. Equipment is inspected, lubricated, and serviced at defined intervals — either based on calendar time (every 30 days), runtime hours (every 500 hours), or usage cycles. The maintenance team now has a forward-looking plan, and the work order system tracks what was done and when.
This is the largest leap in the maturity model in terms of business impact. Moving from Level 1 to Level 2 is where the biggest reduction in unplanned downtime and maintenance cost typically occurs. Research from the Aberdeen Group indicates that organisations at Level 2 and above see an average 18–25% reduction in equipment downtime compared to purely reactive operations.
The challenge at Level 2 is over-maintenance. Without failure data to calibrate intervals, most organisations default to conservative (short) intervals driven by manufacturer recommendations — which are often more frequent than necessary for actual service conditions. This inflates labour cost and creates a PM backlog that competes with reactive work for technician time. Planned downtime starts to appear on the schedule, which is progress — but it may be more planned downtime than the actual failure risk justifies.
Key KPIs at Level 2: PM schedule compliance (target ≥90%), reactive-to-planned work ratio (target <30% reactive), and MTBF trending upward quarter over quarter.
What it takes to move to Level 3: Begin collecting condition data — vibration readings, oil samples, thermal scans — for the assets that are generating the most breakdown events. This shifts the maintenance trigger from "the calendar says it's time" to "the asset's condition says it needs attention." You'll need IoT meter reading capability or a structured inspection checklist programme that captures quantitative condition readings at each PM visit.

Level 3 organisations have moved from fixed-interval maintenance to condition-based maintenance (CBM). Equipment is monitored continuously or at regular inspection intervals, and maintenance is triggered by condition indicators — a bearing vibration trend crossing a threshold, an oil sample showing elevated metal particles, a thermal image showing a hotspot in an electrical panel — rather than by the calendar.
The business case for Level 3 is strong and specific. According to the U.S. Department of Energy, predictive maintenance delivers ROI of 8–12× compared to reactive maintenance, primarily through reduced emergency repair costs, lower parts expenditure (planned replacements cost far less than emergency ones), and reduced production losses from unplanned stops.
Level 3 requires investment in two areas: sensing and analysis. Vibration sensors, oil analysis programmes, thermography equipment, and ultrasound tools generate the data — but that data is only useful if someone acts on it quickly. A condition-based maintenance programme that generates condition alerts but has no defined response workflow or response-time target loses most of its value. The CMMS must be able to receive condition alerts and automatically convert them into work orders with the right priority and assigned technician.
Key KPIs at Level 3: Condition alert response time (target <48 hours for high-severity alerts), percentage of maintenance tasks triggered by condition vs. calendar (target >40% condition-triggered for monitored assets), and planned-to-unplanned maintenance ratio (target >70% planned).
What it takes to move to Level 4: The gap between Level 3 and Level 4 is analytical rigour. Level 3 uses condition monitoring to detect when things are about to fail. Level 4 uses Reliability Centred Maintenance (RCM) methodology to determine what the right maintenance task is for each specific failure mode — which may be condition monitoring, time-based, or deliberate run-to-failure. The distinction is important: Level 3 tells you when to act, Level 4 tells you whether the action you're taking is the right one.
Level 4 organisations have completed a formal analysis of their most critical assets — typically using the RCM or FMEA methodology — and have replaced manufacturer-default PM schedules with task lists that are justified by specific failure modes, consequences, and evidence. Every task on the schedule has a reason: it prevents a specific failure mode that has a defined consequence level. Tasks with no failure-mode justification have been removed or converted to run-to-failure decisions.
This is where many organisations discover that 20–40% of their existing PM tasks were not preventing any real failure — they were inherited from commissioning checklists or vendor manuals and had never been questioned. Removing unjustified tasks reduces maintenance labour cost while focusing effort on the tasks that actually protect reliability. Plants at Level 4 typically operate with a planned maintenance ratio above 80%, wrench time above 55%, and maintenance cost per asset trending down year over year.
Level 4 requires the maintenance team to work closely with engineers and operations — RCM analysis is a cross-functional exercise, not something a maintenance supervisor does alone. The AI-powered knowledge base in your CMMS should hold FMEA records, failure mode histories, and task rationale so that when engineers turn over or equipment is modified, the analytical foundation of the maintenance programme stays intact and doesn't have to be rebuilt from scratch.
Key KPIs at Level 4: Maintenance cost as a percentage of asset replacement value (target <2.5%), wrench time (target >55%), asset availability (target >95% for critical assets), and PM compliance by criticality tier.
What it takes to move to Level 5: The shift to Level 5 is fundamentally a business integration shift, not a technical one. It requires maintenance data — reliability history, lifecycle cost, asset health — to flow into strategic decisions about capital investment, production planning, and asset replacement timing. This means connecting the CMMS to ERP systems, presenting maintenance metrics at executive level, and treating asset management as a boardroom topic rather than a shop-floor concern.
At Level 5, maintenance is no longer a cost centre — it's a capability that directly enables the business to meet its commercial commitments, make better capital decisions, and extend the productive life of its asset base. The maintenance function has a seat at the strategic table. Decisions about whether to invest in new equipment, schedule a major production run, or commit to a customer delivery date are made with full visibility into asset health and maintenance risk.
This level is characterised by true asset lifecycle management: every asset has a documented total cost of ownership (TCO) that informs buy-vs-maintain decisions, refurbishment timing, and capital budget planning. OEE and TEEP are tracked not just as production metrics but as capital utilisation indicators. The maintenance programme generates measurable capital avoidance — documented cases where a predictive intervention prevented an asset replacement that would otherwise have been required.
Level 5 organisations use executive-level BI dashboards that show maintenance cost, asset availability, reliability trends, and lifecycle cost in a format that finance and operations leadership can act on. Maintenance KPIs appear in board reporting alongside revenue, safety, and customer satisfaction metrics. The CMMS is fully integrated with ERP, financial, and production planning systems — so that a maintenance event automatically updates inventory, financial accruals, and production scheduling without manual intervention.
Not every organisation needs to reach Level 5. A small plant with a limited asset base and stable production may achieve excellent ROI at Level 3 or 4. The goal is to reach the level that delivers the best return for your specific operating context — not to pursue Level 5 for its own sake.
Use these diagnostic questions to locate your organisation on the model. Answer honestly — most plants overestimate their level by one stage because they have the processes on paper but not consistently in practice.
Most plants will find themselves clearly at one level for some assets and a level lower for others. It's common to have a flagship production line operating at Level 3 while support systems and utilities sit at Level 1 or 2. That's normal — the goal is to advance the programme systematically, starting with the highest-consequence assets.
Your CMMS both reflects and enables your maturity level. A Level 1 organisation using a spreadsheet to log repairs is constrained by its tools. A Level 4 organisation that has outgrown its CMMS — because it can't store FMEA data, track condition trends, or report on per-asset lifecycle cost — will find it difficult to sustain Level 4 practices regardless of how good the maintenance team is.
Cryotos CMMS is designed to support organisations from Level 2 through Level 5. The work order management and drag-and-drop PM scheduling cover Level 2 needs. IoT integration and downtime tracking with condition alert workflows support Level 3. Asset criticality classification, failure mode history, and the knowledge base support Level 4 RCM practices. Full ERP integration, executive BI dashboards, and lifecycle cost reporting support Level 5 ambitions. The MTBF and MTTR calculators give teams an immediate baseline before they begin the maturity advancement work.
Advancing maturity levels doesn't require a complete system replacement — it requires activating the right capabilities in sequence and building the team habits that make those capabilities produce real data. The first step is always the same: get every corrective and preventive work order logged through a single system so that the maintenance history needed to advance to the next level actually exists.
Moving from Level 1 to Level 2 typically takes 3–6 months with focused effort — introducing a CMMS, building the initial PM schedule for critical assets, and establishing work order discipline. Level 2 to Level 3 takes 6–18 months, depending on the investment in condition monitoring equipment and the volume of assets being monitored. Level 3 to Level 4 is the longest transition — 12–24 months for a thorough RCM programme — because it requires cross-functional analysis and rebuilding the PM library from first principles. Level 4 to Level 5 is a business integration project as much as a maintenance project, typically 18–36 months.
No. Level 5 is appropriate for large, capital-intensive operations where asset performance directly determines business outcomes — oil and gas, power generation, large-scale manufacturing. For a mid-sized plant with a stable asset base and moderate criticality, Level 3 or solid Level 4 practices often deliver better ROI than the investment required to reach Level 5. The right target is the level that best matches your asset consequence profile, not the highest level achievable.
Yes — and this is common practice in mature maintenance organisations. Critical production equipment may be managed at Level 3 or 4 (condition monitoring, RCM-derived tasks) while utilities, support systems, and non-critical equipment are managed at Level 2 (time-based PM) or even Level 1 (run-to-failure with a stocked spare). This is not a gap — it's efficient resource allocation. The key is having the criticality classification done formally so the maintenance level each asset receives is a deliberate decision, not the result of neglect.
The most common barrier is data quality, not technology. Most organisations that struggle to move from Level 2 to Level 3 don't lack the right CMMS — they lack the failure history, downtime records, and condition baselines needed to calibrate a predictive programme. This is why establishing clean, complete work order and downtime records at Level 2 is so important: the data you need to advance to Level 3 and beyond comes from the records you're creating today. A CMMS that makes data capture frictionless — through mobile closure, barcode scanning, and automated timestamps — builds that foundation faster than any other single investment.
The maintenance maturity model isn't a destination — it's a map. Most organisations know their maintenance isn't where it needs to be; what they often lack is a clear picture of which level they're actually at today and a practical description of the next step. Cryotos CMMS supports every transition from Level 2 to Level 5 with the PM scheduling, condition monitoring integrations, RCM knowledge base, and maintenance management reporting needed to advance one level at a time. Book a free demo to see where Cryotos fits your current maturity level and what the next step looks like.


Cryotos AI predicts failures, automates work orders, and simplifies maintenance—before problems slow you down.


