

Measuring OEE means multiplying Availability, Performance, and Quality into one score. That score shows how much of your planned production time made good parts, at full speed, with no stops. It looks like a simple maintenance number. But it is also the metric that Total Productive Maintenance, or TPM, programs were built to move.
Most plants run TPM activities like autonomous checks, planned maintenance, and kaizen events. Few ever tie that work back to a score that proves it is paying off. This guide breaks down the formula, maps it to TPM's pillars, and shows where a CMMS closes that gap.
Key Takeaways

OEE is a percentage score that shows how much of a machine's planned run time turns into good, full-speed output. A perfect 100% OEE means the machine ran with zero stops, at full speed, and made no defects. Per Wikipedia's overview of the metric, most plants score far below that mark.
Total Productive Maintenance is the broader plan that this score was built to measure. TPM gives maintenance teams the program: autonomous checks, planned PMs, and kaizen events. It gives them the scoreboard. Without it, a plant can run every TPM task on the calendar and still have no proof any of it worked. Read more in the OEE glossary entry.

The score has three parts. Each one points to a different type of production loss. Multiply all three to get the final number: OEE = Availability × Performance × Quality.
| Component | Formula | What It Exposes | TPM Pillar It Maps To |
|---|---|---|---|
| Availability | Run Time ÷ Planned Production Time | Breakdowns, changeovers, setup delays | Planned Maintenance |
| Performance | (Ideal Cycle Time × Total Count) ÷ Run Time | Minor stops, reduced running speed | Autonomous Maintenance |
| Quality | Good Count ÷ Total Count | Defects, rework, startup rejects | Quality Maintenance |
A world-class OEE score sits at 85% or higher. Most discrete manufacturers run in the 40% to 60% range before they build a real TPM program. That gap is the opportunity.
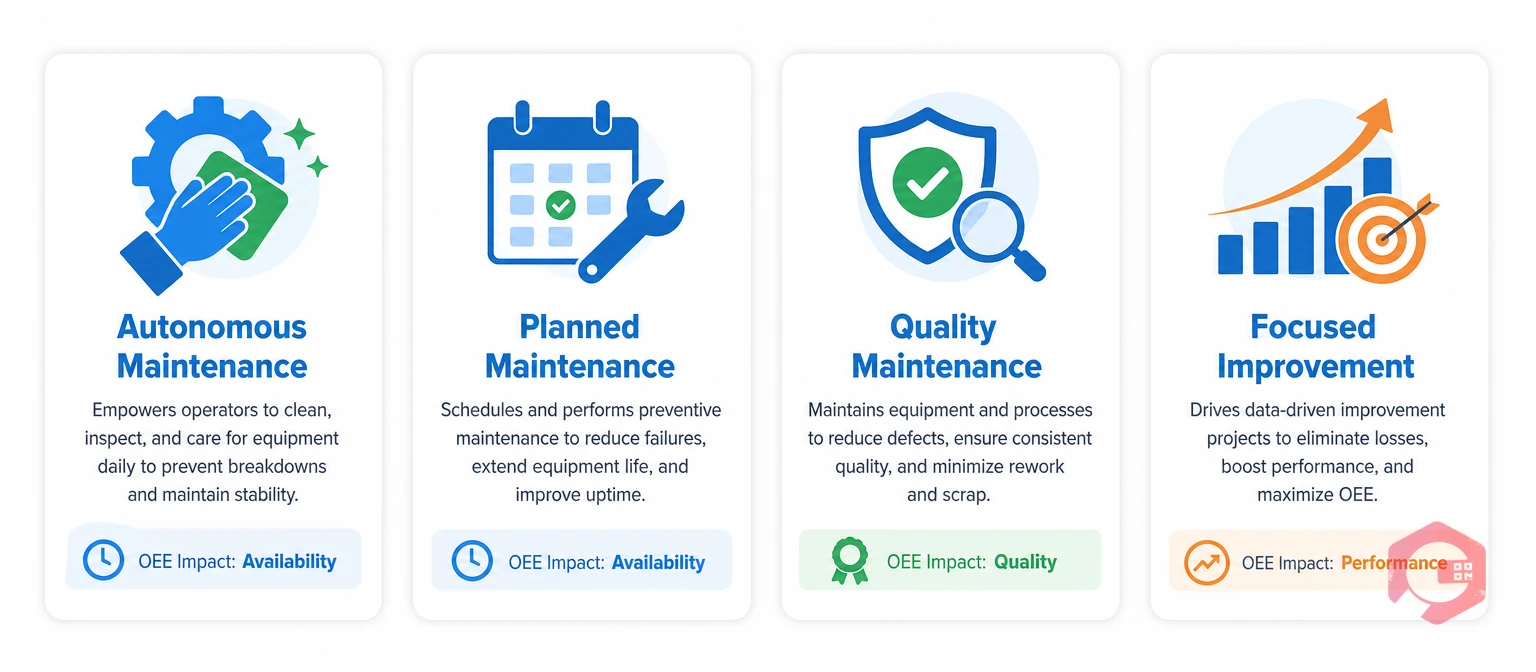
TPM's eight pillars each push on a different part of the formula. Four of them do most of the work.
The TPM-OEE Bridge Framework:
Most maintenance teams already run these activities. The disconnect shows up when nobody links the activity log to the trend line. Then a plant cannot tell which pillar is actually driving results.
Most TPM programs lose that thread when maintenance activity and production data live in separate systems. A technician logs a finished PM in one spreadsheet. The plant floor tracks output and downtime in another. Nobody ever merges the two.
That gap means a plant can run a full quarter of autonomous checks and kaizen events with no clear before-and-after number to show for it. Manual math also adds delay. By the time someone builds a weekly spreadsheet, the shift that caused the dip is long over.
See where your own numbers land: run your plant's shift data through Cryotos's OEE calculator for an instant Availability, Performance, and Quality breakdown.

A Computerized Maintenance Management System (CMMS) makes that link real instead of theoretical. It captures the everyday byproducts of maintenance work. Then it turns that data into the same numbers that feed the formula.
Here is what each module contributes:
Maintenance teams using Cryotos have reported up to 30% less unplanned downtime and 25% faster repairs. Both gains move straight through the Availability side of the formula. The BI dashboard then rolls all of it into one live view. Nobody has to rebuild a spreadsheet every week.
A world-class OEE score is 85% or higher. That means the equipment ran at full speed with almost no downtime or defects. Most plants fall short of that on their first measurement, and that is normal. A federal review from the National Institute of Standards and Technology notes that it is one of the most common metrics manufacturers use alongside TPM.
Once you know your score, the fix stays the same. Find the lowest of the three parts. Then match it to the TPM pillar built to fix it.
A good OEE score is 85% or higher. That is the widely used world-class benchmark. Most plants starting a TPM program measure between 40% and 60%, then improve as autonomous and planned maintenance habits grow.
TPM is the operating plan: the 8 pillars of work like autonomous maintenance and planned maintenance. OEE is the metric that shows whether that work actually improves equipment performance. One is the program. The other is the scoreboard.
Yes. Plants can calculate OEE by hand using spreadsheets and shift logs, but the process is slow and prone to error. A CMMS automates the downtime, PM, and work order data so the number updates in real time instead of once a week.
Most plants calculate OEE by shift or by day, then review weekly trends as a team. Real-time dashboards make this constant instead of a periodic manual task.
Every part of a TPM program, from autonomous checks to planned PMs, only matters if it shows up in your results. Schedule a free demo to see how Cryotos connects your maintenance activity directly to your OEE score.




Cryotos AI predicts failures, automates work orders, and simplifies maintenance—before problems slow you down.



