
Quality maintenance vs quality control comes down to timing. Quality control inspects output after it's made. Quality maintenance keeps equipment in the condition needed to prevent defects before they happen. Both are essential for defect-free production, but they sit at different points in the process and are often owned by different teams. This guide covers what each discipline does, how they work together, where they fit inside a TPM program, how to implement quality maintenance step by step, and how a CMMS makes the connection between them practical and trackable.
Key Takeaways

Quality control is the set of operational activities used to verify that products or services meet defined quality requirements before they reach the customer. It usually happens at the end of a production run or at set inspection checkpoints along the line. Teams use sampling plans, statistical process control charts, go/no-go gauges, or full 100% inspection — the right method depends on the risk profile of the product and the cost of a defect reaching the customer.
The American Society for Quality (ASQ) defines quality control as the operational techniques and activities used to fulfil requirements for quality. That includes everything from dimensional inspection and chemical testing to sensory evaluation and functional testing. Six Sigma programs, control charts, acceptance sampling plans, and final audit protocols all sit under this umbrella.
QC is good at catching defects that have already happened. It answers one specific question: is this particular output good enough to ship? It does not ask why the defect occurred or how to stop it from happening again. QC can catch a bad bearing housing before it ships, but it cannot prevent the worn tooling that caused the oversize bore in the first place.
That gap — the space between catching and preventing — is exactly where quality maintenance operates.

Quality maintenance is the proactive discipline of keeping equipment in the precise physical condition required to produce output that consistently meets quality specifications. Rather than catching bad parts after the fact, it eliminates the root conditions that cause defects — worn tooling, drifting calibration, misaligned fixtures, degraded sensors, and worn seals or guides that introduce process variability.
In a formal Total Productive Maintenance (TPM) program, quality maintenance is one of eight core pillars. Its goal is zero defects from equipment-related causes. The focus is not just on whether a machine runs, but on whether it runs within the specific conditions — tolerances, temperatures, pressures, surface finishes, and alignments — that determine product quality. A machine can be operationally functional and still produce defective parts if quality-critical conditions have drifted.
Most facilities running preventive maintenance software already have the scheduling backbone for quality maintenance. What is usually missing is a clear, documented link between that schedule and quality outcomes — which items on the PM checklist exist specifically to protect product quality, not just equipment availability.
Total Productive Maintenance organises maintenance improvement across eight pillars. Quality maintenance is the pillar that directly bridges maintenance practice and defect prevention. Its primary tool is P-M Analysis — Phenomena-Mechanism Analysis — which systematically traces each defect type back to the physical equipment conditions that produce it. The Society for Maintenance and Reliability Professionals (SMRP) recognises quality maintenance as a core competency area for reliability engineers working in manufacturing environments.
P-M Analysis converts quality defect investigation from a reactive fire-fight into a proactive maintenance standard. Once the analysis is complete, the PM schedule contains a specific, measurable task that keeps the defect-causing condition under control — before defects occur.
Teams using Cryotos can link these quality maintenance tasks directly to the relevant asset, track compliance by shift and technician, and build a trend view of quality-critical condition checks alongside defect data. Use the OEE calculator to baseline your quality rate before and after implementing a structured quality maintenance program.
Quality maintenance vs quality control is fundamentally a proactive-versus-reactive distinction. The table below maps the most important dimensions so you can see clearly where each discipline sits and what it covers.
| Aspect | Quality Control | Quality Maintenance |
|---|---|---|
| Nature | Reactive — detects defects after they are produced | Proactive — prevents the conditions that cause defects |
| When It Happens | After production, at inspection points or final audit | Continuously, on a maintenance schedule before production |
| Primary Question | Is this specific output acceptable to ship? | Is the equipment in the condition required to make good output? |
| Owned By | QA/QC department, quality inspectors | Maintenance team and operators, often under TPM |
| Core Methods | Sampling plans, SPC charts, dimensional inspection, audits | PM schedules, calibration, condition monitoring, P-M Analysis |
| What It Catches | Defects that have already been produced | Equipment conditions that will produce defects if not corrected |
| Cost Driver | Inspection labour, scrap, rework, and warranty on defects caught late | Planned maintenance labour, calibration, and spare parts |
Neither discipline replaces the other. Plants that rely only on quality control pay for scrap that better-maintained equipment would have prevented. Plants that rely only on quality maintenance can still ship a defect if a one-off process slip — a wrong raw material batch, an operator error, a tooling chip — goes undetected by any inspection step.
In a mature TPM program, quality maintenance vs quality control is not a rivalry. QC sets and monitors the tolerance standard. Quality maintenance keeps the equipment inside that standard, shift after shift, without depending on inspection to catch the failures. The two functions reinforce each other — QC data identifies which equipment conditions need maintenance attention, and quality maintenance reduces the volume of defects that QC has to manage.
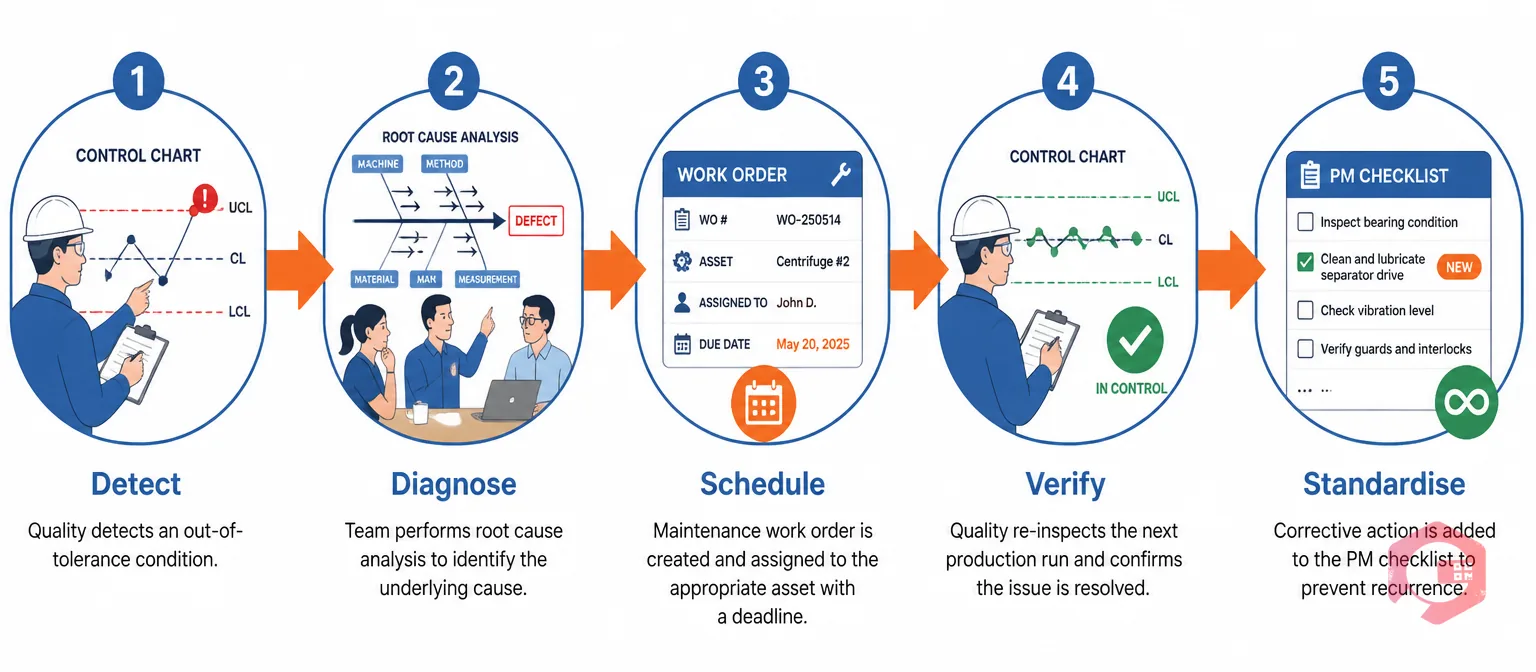
The real value of running both quality control and quality maintenance appears when QC findings feed directly into quality maintenance action. Most operations that successfully reduce recurring defects run some version of this loop, even without a formal name for it. Most that struggle keep QC data in one spreadsheet and maintenance work orders in another, with no one systematically connecting the two.
The QC–QM Feedback Loop:
The fifth step — standardise — is where most informal loops break down. Teams fix the problem once but never update the PM schedule to prevent recurrence. Without it, the same defect comes back six months later with no one remembering how it was resolved last time.
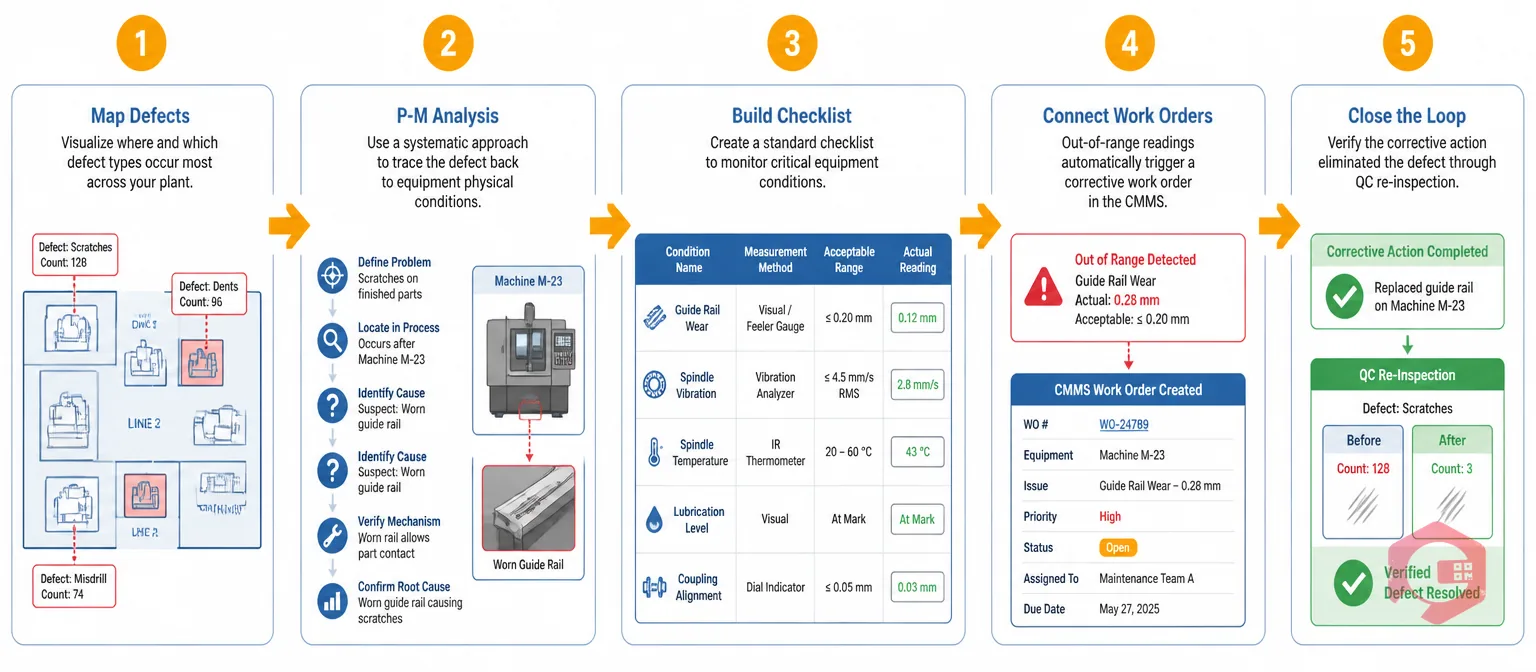
Implementing quality maintenance does not require a full TPM programme from the start. The following five steps work as a standalone initiative for any manufacturing plant that has recurring quality problems it cannot trace to operator error or raw material variation.
Start with your top 3–5 recurring defect types by volume or cost. For each defect, identify which asset or process station produces it. This gives you a focused list of machines where quality maintenance will have the most immediate impact. Do not try to apply quality maintenance to the entire plant at once — start where defect frequency or cost is highest.
For each prioritised defect and its associated asset, run P-M Analysis as described in the TPM section above. The output is a list of specific, measurable equipment conditions — gap tolerances, calibration values, surface roughness specs, torque values — that must be maintained to prevent that defect. These become your quality maintenance standards.
Write a maintenance task for each quality condition identified in Step 2. Each task must specify the condition to check, the measurement method, the acceptable range, and what to do if the reading is out of range. These tasks join the regular PM schedule for that asset, at the frequency indicated by how quickly that condition typically drifts.
The 5-Condition Quality Maintenance Checklist (minimum required fields):
When a quality maintenance check finds an out-of-range condition, a corrective work order must be raised and resolved before the asset goes back into production. This is the step that most paper-based systems fail — the checklist gets completed, the out-of-range reading gets recorded, and nothing happens because no one has a reliable system to create and track the follow-up. A CMMS eliminates this gap automatically.
After each corrective quality maintenance action, the next production run on that asset should be inspected by QC at a higher sampling rate than normal. If the defect has gone, the fix is confirmed. If it persists, the root cause analysis was incomplete and needs revisiting. This verification step is what separates a quality maintenance programme from a routine PM schedule that happens to include calibration tasks.
Deciding ownership of quality maintenance vs quality control is a real organisational question with a meaningful impact on outcomes. Three models are common in manufacturing plants.
In practice, the shared model produces the best outcomes. It puts quality condition checks in the hands of the people who see the machine every shift, which means issues get spotted faster. QA stays accountable for defining what good enough means and confirming that the maintenance programme actually keeps equipment inside that standard. Whatever model a plant chooses, one person must own the QC–QM feedback loop. Without a named owner, the same defects keep returning with no clear accountability for stopping them.
Cost of poor quality (COPQ) is the total financial impact a company absorbs when its products fail to meet defined standards. That includes internal failure costs — scrap, rework, re-inspection, and unplanned downtime — and external failure costs — warranty claims, customer returns, field service, and lost future business. According to ASQ research, COPQ typically runs at 5–30% of total sales revenue in manufacturing organisations, with companies at the low end operating mature quality systems and those at the high end running largely reactive quality processes.
Planned quality maintenance spend is a fraction of that range. A maintenance programme that spends 3–5% of asset replacement value per year on planned upkeep — including calibration and quality-critical PM tasks — almost always costs less than the COPQ it prevents. The challenge is that maintenance costs are highly visible on one budget line, while COPQ gets scattered across scrap write-offs, overtime rework, returned goods allowances, and customer service costs — often tracked by four different departments with no one adding them up.
| Cost Type | Examples | Who Usually Sees It |
|---|---|---|
| Internal failure (COPQ) | Scrap, rework, re-inspection, unplanned downtime | Production, QA — rarely in a single figure |
| External failure (COPQ) | Warranty claims, customer returns, field service, lost contracts | Finance, customer service — rarely connected to maintenance |
| Cost of quality maintenance | Planned PM labour, calibration, spare parts, scheduled downtime | Maintenance budget — highly visible, easy to cut |
The asymmetry matters at budget time. A single maintenance budget line is easy to scrutinise and cut. The combined COPQ that budget line prevents is spread across five departments and almost never appears in the same conversation. Building the case for quality maintenance investment requires adding up those scattered costs before the budget review — not after.

A Computerized Maintenance Management System makes the QC–QM feedback loop repeatable and auditable. It removes the dependency on individual memory and manual handoffs that cause most informal quality–maintenance connections to break down over time.
Maintenance teams using Cryotos have reported up to 30% reduction in unplanned downtime and 25% faster repair turnaround. For quality maintenance specifically, the gains come from closing the gap between QC findings and maintenance response — tracking that connection in one system instead of chasing it across emails, spreadsheets, and verbal handoffs.
Quality maintenance vs quality control is not a choice between one or the other. The plants with the lowest defect rates run both, connected by a clear feedback loop and a system that makes the connection automatic. Schedule a free demo to see how Cryotos links maintenance checklists, work orders, and quality reporting into a single audit trail.
Quality control inspects finished output and catches defects after they are produced. Quality maintenance keeps equipment in the physical condition required to prevent those defects in the first place. Most manufacturing plants need both disciplines running in parallel, connected by a formal feedback loop that routes QC defect findings into targeted quality maintenance tasks on the responsible assets.
Not exactly. Preventive maintenance covers all scheduled upkeep — safety, reliability, lubrication, and regulatory compliance tasks as well as quality ones. Quality maintenance is the specific subset of PM focused on equipment conditions that directly affect product quality: calibration, dimensional tolerances, tool wear, and the condition of error-proofing devices. Every quality maintenance task is a preventive maintenance task, but not every PM task is quality maintenance.
Responsibility varies by organisation. Some plants assign it entirely to the maintenance team, who schedule and execute quality-critical PM tasks as part of the standard PM programme. Others share it between maintenance and quality under a formal TPM structure, where QA defines the quality standards and maintenance owns the execution. A smaller number have QA schedule and own the tasks directly, using maintenance technicians for execution only. The shared model generally produces the most consistent outcomes.
No. A CMMS manages maintenance work orders, asset records, and equipment condition data. It does not perform product inspection, run statistical process control, or replace the judgement of a trained quality inspector. What a CMMS does provide is the structured workflow that ensures QC findings trigger maintenance action fast, that the action is tracked to completion, and that the results are visible to both quality and maintenance teams in one place.
Worn tooling, drifted calibration, misaligned fixtures, and degraded sensors are four of the most common root causes of equipment-driven defects. Quality control can catch the bad parts after they are made, but it cannot prevent them. The only way to prevent equipment-driven defects is to maintain the specific physical conditions that produce good parts — which is exactly what quality maintenance does. Running both quality maintenance and quality control together consistently produces lower defect rates than either discipline delivers on its own.


Cryotos AI predicts failures, automates work orders, and simplifies maintenance—before problems slow you down.


