
F&B plants use maintenance reports from their CMMS to build a data-driven financial case for capital equipment replacement — translating years of work order history, downtime records, and failure trends into a board-ready argument that replacing an ageing asset costs less than keeping it running. The challenge most maintenance managers face is not gathering the data; it's structuring that data into the language finance directors understand: payback periods, total cost of ownership, and risk-adjusted return on investment.
This guide walks through the five maintenance reports that matter most for capital justification in food and beverage plants, how to frame the F&B-specific compliance risk dimension, and how to turn your CMMS data into a narrative that gets capex approved.
Key Takeaways
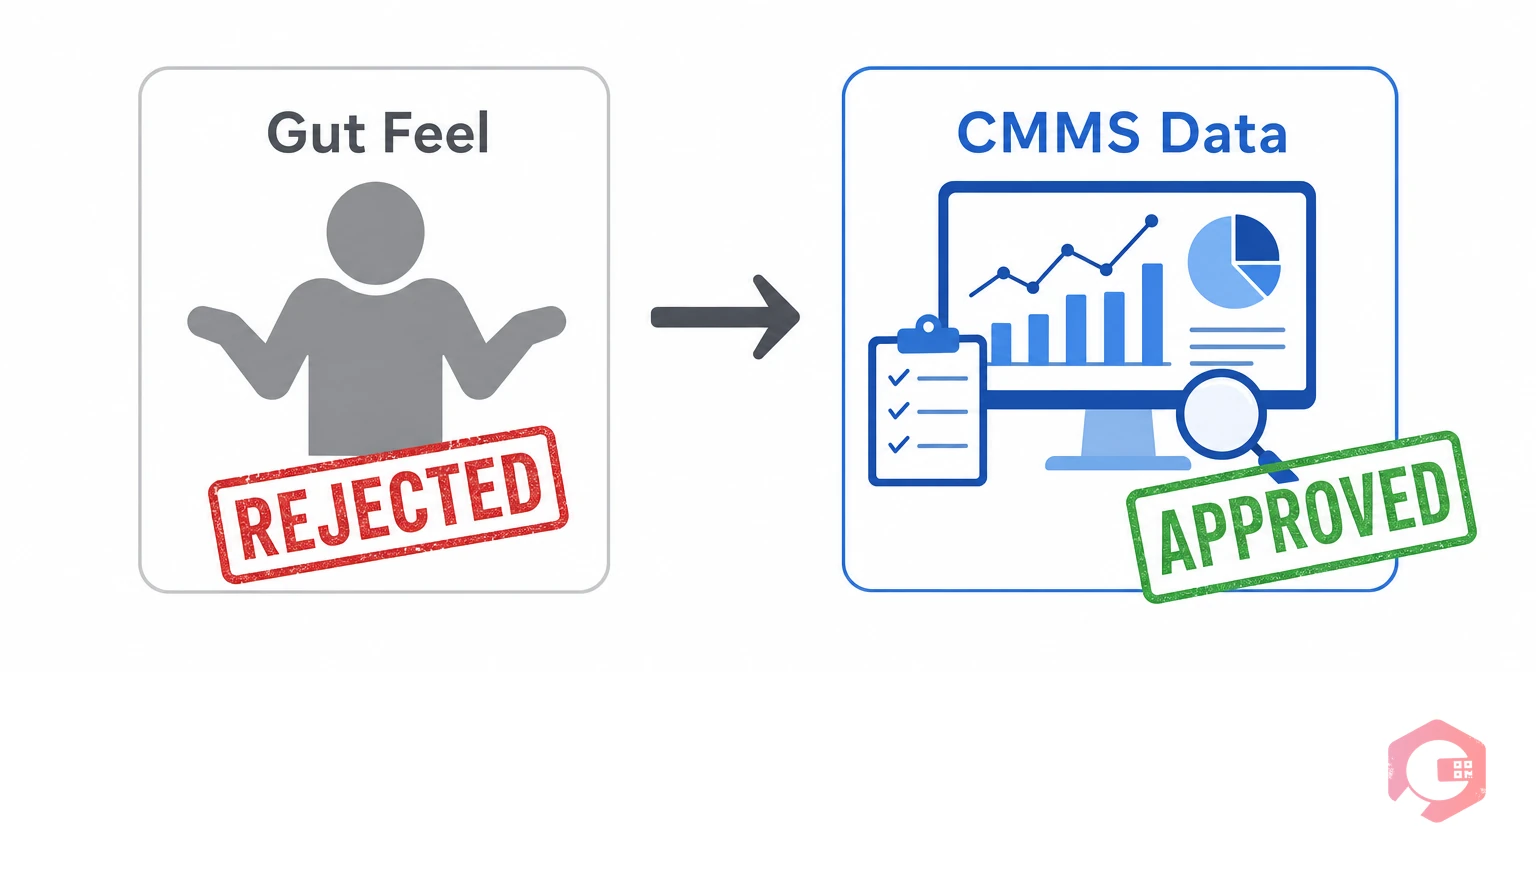
Finance directors evaluate capital requests through a single lens: will this investment generate a return that exceeds the cost of capital? When a maintenance manager walks in saying "the filler keeps breaking down," the finance team hears a request without evidence. When the same manager presents "this asset cost £47,000 in maintenance last year, generated £312,000 in production losses from unplanned downtime, and its mean time between failures has declined 38% over the past 18 months," the conversation shifts entirely.
The gap between these two presentations is maintenance data — specifically, the structured reporting that a food and beverage CMMS generates from the work orders, downtime events, and PM records your technicians are already creating every day. According to the Society for Maintenance and Reliability Professionals (SMRP), organisations that use data-backed justification for capital decisions consistently achieve faster approval cycles and better asset utilisation post-replacement than those using qualitative arguments alone.
Three objections kill most maintenance capital requests before they reach the board:

Each of these five reports answers a specific question your finance team will ask. Pull all five from your CMMS for a 12–24 month period, and you have a self-contained capital justification package.
The RAV ratio measures annual maintenance spend against the current replacement cost of the asset. Industry benchmarks place a healthy RAV ratio below 3% for well-maintained plant equipment. Spend consistently above 5–6% signals a deteriorating asset. Spend above 8–10% RAV is widely considered strong financial justification for replacement — you are spending a significant fraction of the asset's value every year just to keep it running, and that fraction grows as the asset ages.
Your CMMS generates this figure directly: total labour hours, parts cost, and contractor spend against a work order filter for a single asset over 12 months. Divide by the manufacturer's current list price or your own replacement estimate, and the ratio speaks for itself.
A single MTBF figure tells you how reliable an asset is right now. An MTBF trend over 18–24 months tells you the direction of travel — and direction is what finance needs to see. A deteriorating MTBF trend transforms the replacement request from "we want new equipment" into "the data shows this asset will continue to fail at increasing frequency if we keep it."
Filter your work orders by asset, extract breakdown event dates, and calculate MTBF for each rolling 3-month window. Plot the results and you have a deterioration trend that is both visually compelling and objectively verifiable. The MTBF calculator gives you a clean starting figure; the trend comes from plotting that figure across multiple periods.
Downtime cost is the most persuasive number in a capital replacement case because it connects equipment failure directly to lost revenue. Calculate it by multiplying total unplanned downtime hours attributable to the asset by your plant's standard production loss rate per hour. If a canning line produces £1,400 of output per hour and a failing seamer caused 280 hours of unplanned stops over 12 months, that is £392,000 in lost production — often more than the cost of a replacement machine.
This figure also handles the "just repair it" objection: if cumulative downtime cost exceeds the replacement asset price, you can demonstrate that the plant has already "paid for" a new asset in lost output, and will continue to do so without action.
This report closes the "maintain it better" objection with data. It compares preventive maintenance task completion rate against reactive breakdown frequency for the same asset over the same period. If your team completed 94% of scheduled PMs and the asset still generated 22 breakdowns in 12 months, the data shows the problem is not maintenance quality — it is asset condition.
A well-structured maintenance report builder in your CMMS should produce this comparison in a single pull. The visual side-by-side of high PM compliance and rising breakdown frequency is one of the most effective exhibits in a capital justification document.
Mean time to repair tells you how long it takes to restore the asset to service after a failure. A rising MTTR trend — where repairs that used to take 2 hours now take 6 — signals increasing repair complexity, parts scarcity, and technician unfamiliarity with failure modes that are becoming more frequent and more severe. Finance interprets rising MTTR as escalating operational disruption risk, which strengthens the case for replacement.
Pull all five reports for the same asset and the same 12–24 month window, and you have a data package that addresses every standard finance objection before it is raised.
Food and beverage plants face a capital replacement factor that general manufacturing does not: food safety compliance. An ageing piece of processing equipment that fails frequently does not just generate maintenance cost and downtime loss — it generates food safety risk, and that risk has a quantifiable cost of its own.
Every breakdown event on a filling line, pasteuriser, or CIP system carries the potential for product quarantine, microbiological retest, enhanced cleaning validation, and in serious cases, regulatory notification. BRC Global Standard Issue 9 and FSSC 22000 both require documented risk assessments on the impact of equipment failure on food safety controls. The SQF Institute research consistently identifies equipment reliability as one of the primary drivers of food safety non-conformances in processing facilities. When your CMMS links breakdown events to the food safety corrective actions triggered by those events, you have exactly the documented risk trail that both external auditors and internal finance teams find compelling.
The cost of a single product quarantine event — including retest fees, production hold costs, and potential disposal — can run to tens of thousands of pounds on a single shift. A CMMS that captures this data through your maintenance checklists and food safety action logs creates a compliance-risk dimension to the capital case that no finance director can dismiss as subjective. The regulatory compliance checklist framework ensures these events are systematically captured and linked to the equipment responsible.
The FDA's HACCP principles place equipment reliability at the centre of food safety control — and when regulatory compliance is on the line, finance teams authorise capital spending that would otherwise face years of deferral.
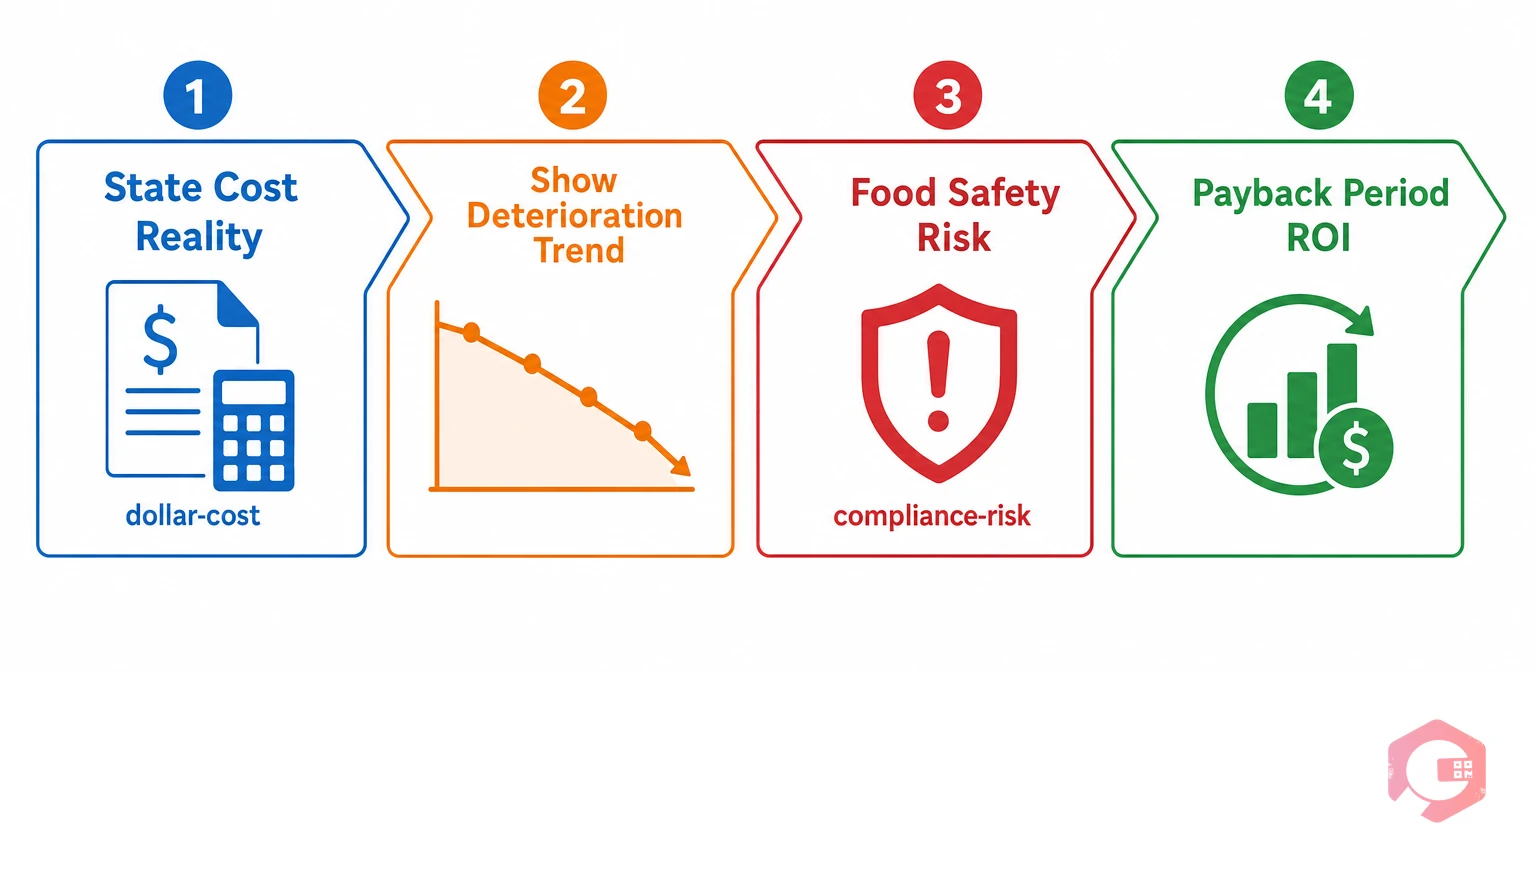
Gathering the data is only half the work. The other half is structuring it into a narrative that moves a finance director from scepticism to sign-off. Use this four-step structure for any capital replacement presentation in a food and beverage environment.
Open with a single number that combines 12-month maintenance spend and downtime cost for the asset in question. "This asset cost us £359,000 last year to operate — £47,000 in direct maintenance and £312,000 in production loss." One number, two components, immediate attention from the finance team. Do not bury the lead in a table of individual work orders.
Follow with the MTBF chart — 18 to 24 months of rolling failure frequency data. The visual trend does the persuasion work. A line moving consistently downward is worth more than any verbal argument about asset condition. Add the MTTR trend on the same chart if it shows a corresponding increase, and the picture of an asset approaching end of maintainable life becomes undeniable.
For F&B plants, this is the section that separates a strong capital case from an exceptional one. List the food safety corrective actions triggered by this asset's failures over the past 12 months: product quarantine events, microbiological retests, CIP re-runs, enhanced validations. Assign a cost to each category and total them. This number is rarely less than £20,000 and is sometimes larger than the direct maintenance spend — and it carries audit and regulatory exposure that finance teams understand is not acceptable to defer.
Divide the replacement asset price by the total annual cost of the current asset (maintenance spend + downtime cost + compliance-related costs). A payback period under three years typically meets standard capital investment criteria in food manufacturing. If the payback is under 18 months — which is common when downtime cost is high — frame it explicitly: "This replacement pays for itself in 14 months at current run rates." Finance teams approve investments with clear, short payback periods in the food sector, especially when the alternative is ongoing compliance risk.
Cryotos is built for exactly this workflow. The BI dashboard gives maintenance teams live visibility of asset cost, downtime frequency, MTBF, and MTTR — not as one-off manual calculations, but as continuously updated metrics drawn from live work order data. The downtime tracking module captures every production stop, assigns it to the responsible asset, and calculates cost automatically based on your configured production rate.
When the time comes to build a capital replacement case, the data is already there. Generate a 12-month asset cost report, export the MTBF trend, pull the PM compliance vs breakdown ratio, and the five-report package is ready. No manual spreadsheets. No hunting through paper records. The report builder produces formatted outputs that go directly into a board presentation.
Book a free Cryotos demo to see how the asset cost reporting, downtime tracking, and BI dashboard work together to produce the evidence your next capital replacement request needs.
The five most effective reports are the RAV ratio (maintenance cost as a percentage of replacement asset value), MTBF trend over 18–24 months, cumulative downtime cost, PM compliance versus breakdown ratio, and MTTR trend. Together they address every standard finance objection and provide a complete financial picture of the asset's true operating cost.
A maintenance spend consistently above 5–6% of replacement asset value signals a deteriorating asset. Spend above 8–10% RAV is widely considered strong financial justification for replacement. At this level, you are spending a significant fraction of the asset's replacement cost annually just to keep it operational — a pattern that accelerates as the asset ages.
Total the annual cost of the current asset: add direct maintenance spend, production downtime cost, and F&B-specific compliance costs such as product quarantine events and microbiological retests. Divide the replacement asset price by this total annual cost. A payback period under three years typically meets capital investment criteria in food manufacturing; under 18 months is considered a compelling case for immediate approval.
In food and beverage manufacturing, equipment failure frequency creates quantifiable food safety risk — product quarantines, enhanced cleaning validations, microbiological retests — that generates cost beyond direct maintenance spend. BRC Issue 9 and FSSC 22000 require documented risk assessments on equipment failure impact. A CMMS that links breakdown events to food safety corrective actions gives finance teams a compliance-risk dimension that often accelerates approval of capital requests that would otherwise face deferral.
Yes. A well-configured CMMS captures all the underlying data — work order history, breakdown events, PM task records, downtime duration — and generates the five key reports from that data automatically. There is no need for manual spreadsheet calculations; the CMMS turns your technicians' daily work records into a board-ready capital case on demand.


Cryotos AI predicts failures, automates work orders, and simplifies maintenance—before problems slow you down.


