Maintenance affects return on assets and asset turnover through two mechanical levers — it raises net income by cutting the cost of unplanned failure, and it raises revenue per dollar of assets by extending the productive hours of every machine on the balance sheet. Return on assets rises when scheduled maintenance replaces emergency repair; asset turnover rises when uptime and output per asset climb without a matching rise in total assets. This guide breaks down the two formulas, maps each maintenance decision to the line item it moves, and shows the four maintenance metrics that translate directly to both financial ratios.
Key Takeaways
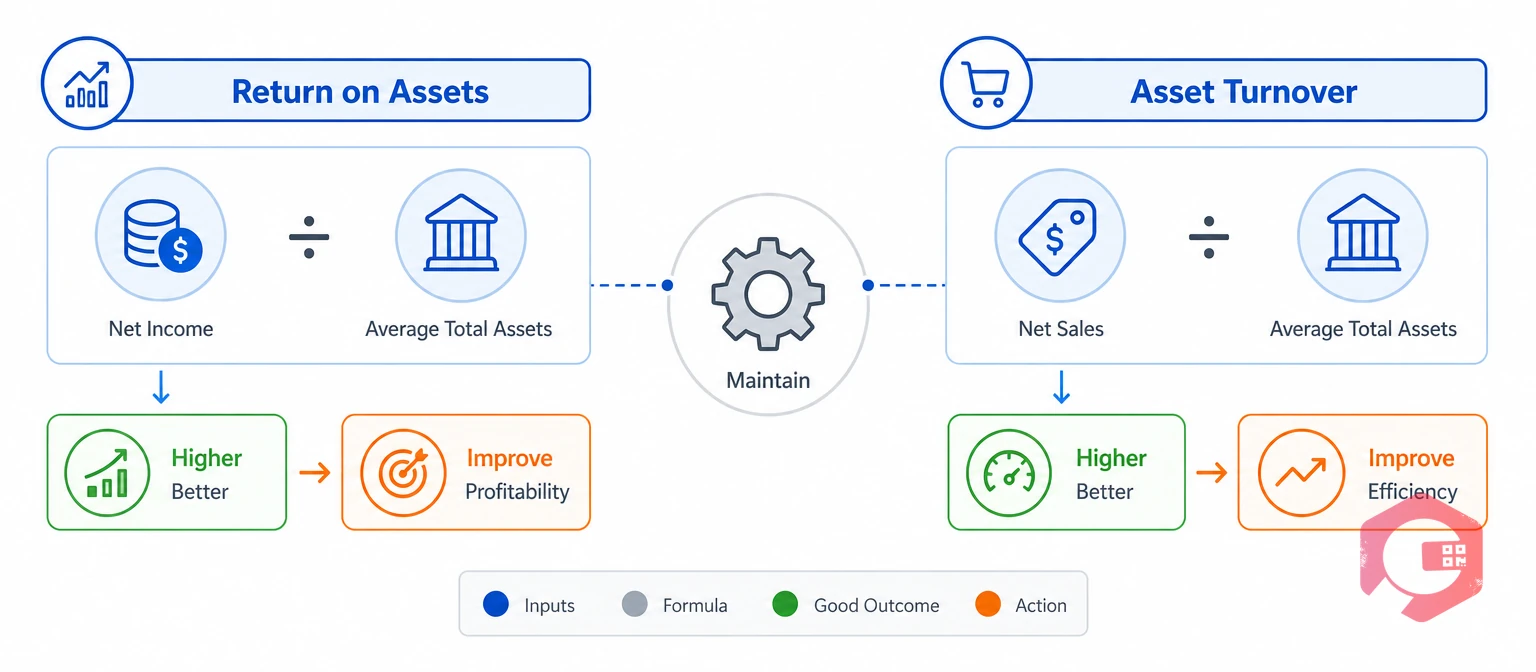
Return on assets (ROA) measures how much profit a company generates for every dollar of assets it owns. It is calculated as Net Income divided by Average Total Assets, expressed as a percentage. A plant that generates $5 million in net income from $50 million in assets has a 10% ROA.
Asset turnover measures how much revenue the same asset base generates. It is calculated as Net Sales divided by Average Total Assets, expressed as a ratio. The same $50 million in assets producing $100 million in revenue has an asset turnover of 2.0.
The DuPont decomposition of ROA splits it into two components: net profit margin and asset turnover. ROA equals net profit margin multiplied by asset turnover. Any lever that moves either component moves ROA. This matters because maintenance is one of the very few operational functions that shifts both components simultaneously — it protects margin by preventing costly breakdowns, and it lifts turnover by keeping productive assets in service.
Finance teams see maintenance as an operating expense that compresses net income. Maintenance teams see finance pressure as the reason PM budgets get cut right before unplanned downtime spikes. Both perspectives are right in the short run and wrong in the long run — the only reconciliation is to trace maintenance decisions to their actual impact on ROA and asset turnover line by line.
Maintenance affects ROA through both the numerator (net income) and the denominator (average total assets). The two work in opposite directions at the moment of a maintenance decision and in the same direction over the lifetime of an asset.
Every dollar of unplanned repair cost that a preventive maintenance program avoids flows directly to net income. Industry benchmarks consistently show that unplanned repairs cost 2 to 5 times more than the equivalent planned intervention — the premiums come from overtime labour, expedited parts, production loss, and secondary damage to adjacent assets.
A disciplined preventive maintenance program converts these avoided costs into operating profit every month, which is why mature maintenance organisations present their budget as a return on assets lever rather than a cost centre line.
Average total assets is the denominator of both ROA and asset turnover, and maintenance quality is one of the strongest determinants of how fast that denominator grows. Assets that fail prematurely must be replaced sooner. Each replacement is a capital expenditure that raises average total assets and lowers both ratios until the new asset earns back its carrying cost.
The opposite also holds — a well-maintained press that reaches 15 years of service instead of 10 delays replacement capex by five years and keeps average total assets lower across that window. Proactive maintenance therefore acts on the ROA formula from both sides at once: more income on top, fewer compounding asset additions on the bottom.
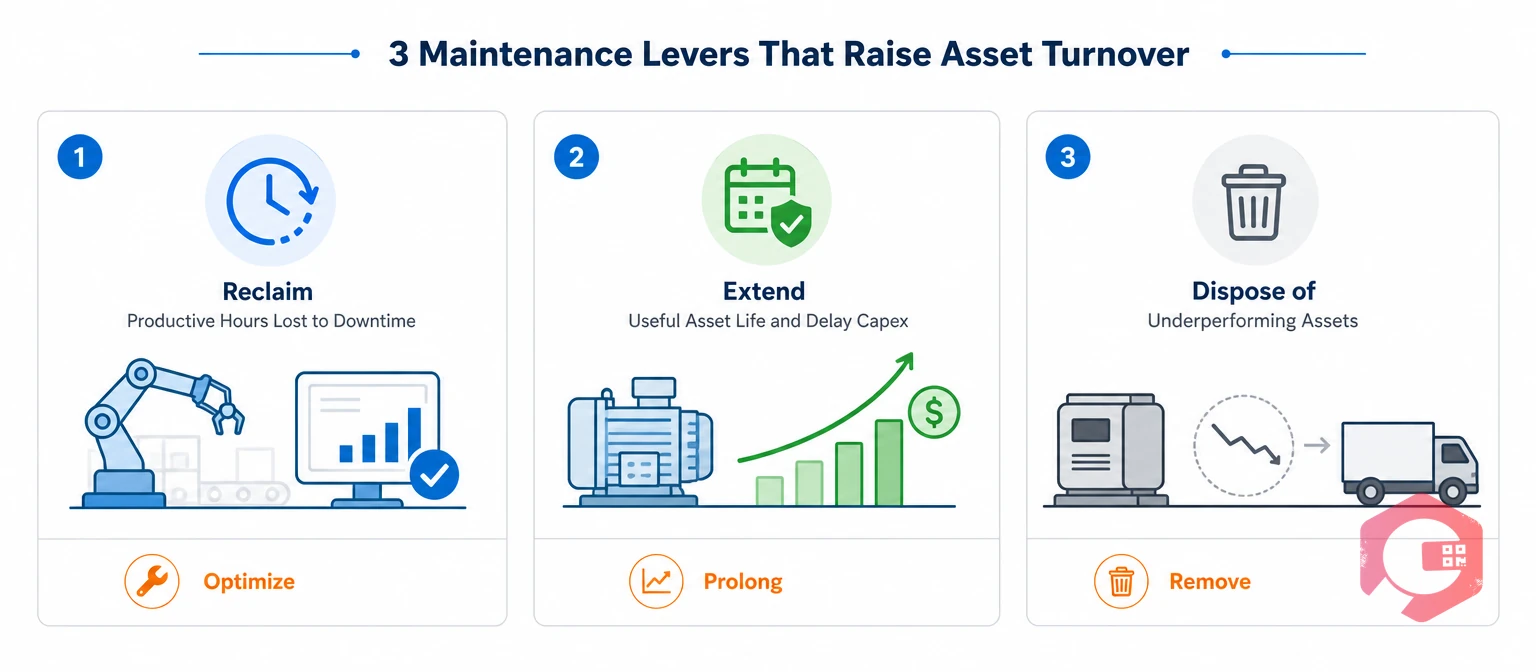
Asset turnover rises whenever a company generates more revenue from the same average total assets. Maintenance moves this ratio through three distinct levers, and a Computerized Maintenance Management System is the tool most plants use to track all three in one place.
Every hour a critical asset spends in an unplanned stop is an hour of revenue the plant does not earn. If a line running at $8,000 of output per hour loses 200 hours of unplanned downtime a year, that is $1.6 million of revenue the asset base failed to generate. A preventive maintenance program that recovers half of those hours lifts asset turnover without any new capital investment.
Asset turnover's denominator is sensitive to capital additions. A fleet of 40 forklifts retired at seven years consumes more average total assets than the same fleet retired at ten. Proper asset tracking and condition-based maintenance can add two to five years to the service life of major capital equipment, which is a structural improvement in asset turnover.
Not every asset earns its place on the balance sheet. A CMMS with accurate maintenance history makes it possible to identify equipment that generates disproportionate repair spend for low output. Selling or decommissioning those assets drops the denominator and raises both ratios in one accounting period.

Most maintenance teams track dozens of operational metrics, but only four translate cleanly to the ROA and asset turnover line items in a quarterly report. Finance leaders care about these four because each has a direct, predictable effect on either the numerator or the denominator.
The Four-Metric Financial Chain:
Each metric is a daily operational number and a quarterly financial signal at the same time. When maintenance managers present these four to the CFO rather than reactive-repair counts, the conversation about budget shifts from defending cost to allocating investment.
If you want to see the direct cash impact of improving MTTR on your own assets, run the numbers through the Cryotos MTTR calculator before your next budget review.
Reactive maintenance programs almost always produce lower ROA and asset turnover than comparable preventive programs over any time horizon longer than a single quarter. The gap compounds because every unplanned failure carries forward in three ways — higher repair cost this month, shorter asset life over the long run, and lost production that never returns.
| Financial Dimension | Reactive Maintenance | Preventive Maintenance |
|---|---|---|
| Cost per repair | 2–5× higher (overtime, expedited parts, secondary damage) | Baseline planned cost |
| Impact on net income | Compressed by emergency repair premium and lost production | Protected by predictable, scheduled spend |
| Effect on asset life | Shortens useful life by 20–40% over time | Extends useful life to or beyond manufacturer spec |
| Effect on capex cycle | Accelerates replacement, raising average total assets | Delays replacement, keeping denominator lean |
| Downtime profile | Unpredictable, concentrated during peak production | Planned, scheduled during low-demand windows |
| Effect on asset turnover | Depressed — lost revenue hours plus faster asset additions | Lifted — higher uptime plus a stable asset base |
| Effect on ROA | Compounds downward over multiple years | Improves steadily as PM discipline matures |
The row that matters most is the final one. A plant that stays reactive sees ROA degrade year on year even when revenue holds steady, because asset additions outpace earnings. A plant that commits to preventive maintenance sees ROA climb on the same revenue because the asset base works harder and lasts longer.
The clearest way to see how maintenance affects return on assets and asset turnover is to model the same plant before and after a disciplined preventive maintenance rollout. The example below uses round numbers for clarity, but the pattern reflects what most mid-sized manufacturers see in the first eighteen months of a serious PM program.
The asset turnover improvement looks modest at seven percentage points, but ROA jumps by over four full points because the preventive program moves both the numerator and the denominator in the right direction. Most of the ROA gain comes from avoided unplanned downtime; the rest comes from slower growth in average total assets as premature failures stop forcing early replacements.
The gap between a maintenance program that improves ROA and one that only looks busy is almost always a visibility gap. Reactive teams cannot show finance a credible connection between PM compliance this week and net income next quarter. Mature teams can, and a CMMS is the system that bridges the two.
Cryotos gives maintenance and finance leaders the shared data layer they need:
Maintenance teams using Cryotos have reported up to 30% reduction in unplanned downtime and 25% faster repair turnaround — improvements that flow straight into higher net income, longer asset life, and measurably better return on assets.
In almost every case, yes — but the gain only becomes visible over a full year or more because preventive maintenance requires a modest upfront spend before the avoided unplanned costs compound. Plants that measure ROA quarter by quarter sometimes see a brief dip when a PM program ramps up, followed by sustained improvement as net income rises and asset additions slow.
Both matter, and they move together far more often than they diverge. Asset turnover is the operational signal that tells you whether your asset base is being used efficiently, and ROA is the financial scoreboard that tells you whether that efficiency is reaching the bottom line. A manufacturer with high asset turnover but low ROA has an output problem that converts to a margin problem — usually through emergency maintenance costs or quality defects.
A CMMS does not improve ROA by itself — it is the system that makes a maintenance program disciplined enough to improve it. The ROA gain comes from scheduled PMs replacing emergency repairs, longer asset life, and reclaimed production hours. A CMMS gives the maintenance team the scheduling, tracking, and reporting to make those three things happen consistently.
Most organisations see measurable ROA improvement within twelve to eighteen months of a serious preventive maintenance program, with the first clear signal appearing in unplanned downtime cost within the first six months. The lag exists because asset-life gains only register once a replacement that was originally planned for a given year is pushed out to a later year.
Finance leaders should ask for MTBF, MTTR, PM compliance, and planned-to-unplanned ratio, alongside unplanned downtime cost in dollars. These five numbers let finance model next quarter's maintenance spend, forecast production hours lost, and connect both to projected net income. Reactive repair counts and total work order volume are operational metrics and do not belong in a financial review.
Extending an asset's useful life spreads its depreciation over more years, which lowers the annual depreciation expense and lifts net income — the numerator of ROA. It also delays the next capex event, keeping average total assets lower for longer. Both effects push ROA in the same direction, which is why asset-life extension is one of the highest-leverage outcomes a mature maintenance program can deliver.
Return on assets and asset turnover are the two ratios where maintenance investment compounds into measurable financial performance over every reporting cycle. Schedule a free demo to see how Cryotos turns daily maintenance work into the dashboards finance leaders use to track ROA month over month.



Cryotos AI predicts failures, automates work orders, and simplifies maintenance—before problems slow you down.