To split downtime into repair time and waiting time, record when hands-on work starts and ends separately from when the asset stops and restarts, then subtract one from the other. Total downtime is the full outage. Repair time is the part when someone is actively fixing the fault, and everything else is waiting time.
Most work orders capture only one number, so slow recovery gets blamed on technicians when the delay often sits in parts, approvals or response. This guide shows five steps to capture both numbers, with a worked example and rules that keep the data clean.
Key Takeaways
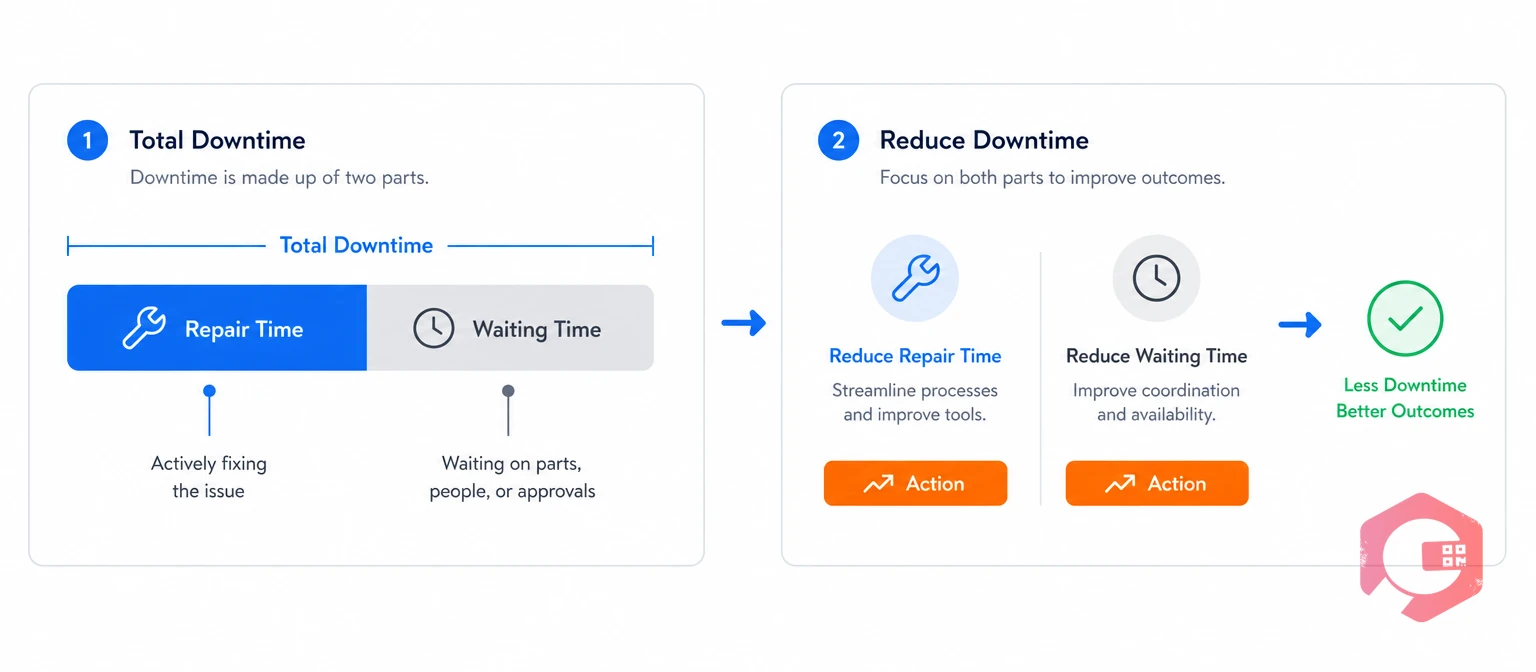
Total downtime is the time an asset is out of service, from the moment it stops to the moment it runs normally again. It always has two parts: repair time and waiting time.
Repair time is the period when a technician or engineer actively works on the fault. Some teams call it hands-on repair time or engineering time, and it covers diagnosis, the repair itself and the test run.
Waiting time is every minute of downtime when nobody is working on the fix. It is the gap that most work orders never measure. Common causes include:
For unplanned maintenance events, this waiting share can be the largest hidden loss. Standards such as ISO 55000 ask organizations to base asset decisions on reliable performance data, and groups like SMRP publish widely used maintenance metric definitions. Splitting repair time from waiting time gives you data of that quality.
Once the two are separate, you can see whether slow recovery is a repair problem or a waiting problem.
Start by recording when the asset stopped and when it ran normally again on every breakdown work order. These two timestamps set the window that both repair time and waiting time sit inside.
A Computerized Maintenance Management System gives each work order a field for both times, so you do not rely on memory or paper logs. Good downtime tracking also ties the timestamps to the asset, department and plant, which lets you compare lines later.
Accurate start and end times are the foundation, because both repair time and waiting time are measured inside that window.
Add two more timestamps to the work order: when hands-on repair started and when it ended. The gap between them is your repair time, and it is the number that total downtime hides.
With digital work orders on a mobile device, technicians can tap start and finish at the machine, so times are logged live instead of estimated at the end of the shift.
Live start and stop times turn repair time from a guess into a measurement.
Curious what your own numbers look like? Enter your repair times into the Cryotos MTTR calculator to see your average.
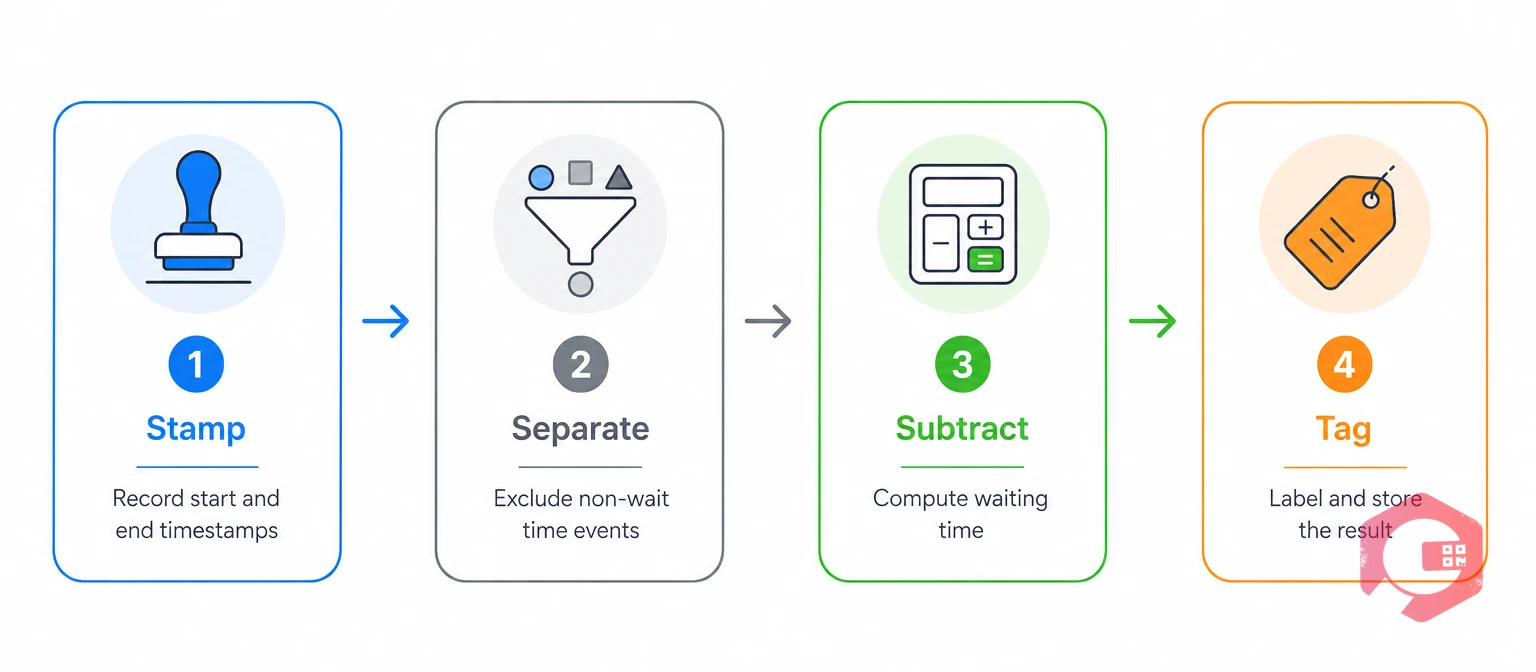
Waiting time equals total downtime minus repair time, calculated for every work order. If the repair ran in several sessions, add the sessions together first.
Waiting time = (Down end minus Down start) minus Hands-on repair time
The Repair-Wait Split Method:
Most maintenance teams can run this routine in under a minute per breakdown, because each step needs only a timestamp or a single pick from a list.
The method works because each step is small enough for a technician to finish in seconds.
On a single breakdown, repair time can be less than half of total downtime. The numbers below illustrate a conveyor motor that fails during a morning shift on a packaging line.
| Phase | Duration | Counts as | Typical reason |
|---|---|---|---|
| Fault reported until the engineer arrives | 45 min | Waiting time | Engineer busy on another job |
| Diagnosis of the motor fault | 30 min | Repair time | Hands-on work |
| Wait for a spare motor from stores | 2 h | Waiting time | Part not in stock |
| Fit the motor and run a test | 1 h 15 min | Repair time | Hands-on work |
| Total downtime | 4 h 30 min | 1 h 45 min repair plus 2 h 45 min waiting | Not applicable |
Total downtime is 4 hours 30 minutes, made up of 1 hour 45 minutes of repair time and 2 hours 45 minutes of waiting, about 61% of the outage. A report showing only 4.5 hours makes the repair look slow, when the real issue is a missing part and a busy engineer.
One breakdown can look like a repair problem when it is a stock and dispatch problem.

Tag each block of waiting time with a delay reason, because a total without a cause gives you nothing to fix. Keep the list to six to eight codes, so technicians can choose one in seconds.
Review the codes every month, and add a new code when “other” starts appearing often.
Delay codes turn waiting time from a total into a to-do list.
Add validation rules to the work order, so repair time cannot be logged outside the downtime window. Most maintenance teams that keep clean data enforce these rules in the system, not through reminders.
Rules in the system protect the data when the shift gets busy.
Separating repair time from waiting time gives you a cleaner view of mean time to repair (MTTR) and shows where recovery time is lost. Organizations define MTTR differently: some use active repair time, others use full restoration time. Pick one definition, apply it consistently, and report the other as a separate figure.
These figures also feed availability, one of the three components of overall equipment effectiveness (OEE), and fit the loss-tracking approach of total productive maintenance (TPM). Maintenance teams using Cryotos have reported up to 30% reduction in unplanned downtime and 25% faster repair turnaround. Asset maintenance management software from Cryotos links downtime, work orders and asset history in one place.
Knowing where the hours go is the first step to getting them back.
The most common mistake is estimating repair time at the end of the shift instead of logging it live. Maintenance teams run into five problems again and again.
Most of these problems disappear when times are logged live and the rules are enforced in the system.
Downtime is the full period an asset is out of service. Repair time is only the part when someone actively works on the fault. The rest is waiting time, such as waiting for parts or approvals.
Subtract hands-on repair time from total downtime. For example, 4 hours 30 minutes of downtime with 1 hour 45 minutes of repair leaves 2 hours 45 minutes of waiting. If the repair ran in several sessions, add the sessions before you subtract.
Yes, in most teams. Diagnosis, the repair itself and the test run count as repair time because someone is actively working. Travel, waiting for parts and waiting for approval count as waiting time, so write your rule down and make every technician follow it.
Both definitions are in use, so choose one and apply it consistently. Many teams report MTTR on active repair time and track total downtime and waiting time as separate figures. What matters most is that every report states which definition it uses.
Six to eight is a practical range. Fewer codes hide real causes, and more codes slow technicians down. Review the list monthly and add a code if “other” keeps appearing.
Yes. Waiting time usually comes from parts, approvals, permits and response, so stocking critical spares, shortening approval steps and improving dispatch can cut it without adding headcount.
Clear data starts with a work order that captures every stage of a breakdown. Schedule a free demo to see how Cryotos tracks downtime and work orders across your plants and assets.



Cryotos AI predicts failures, automates work orders, and simplifies maintenance—before problems slow you down.