
A maintenance strategy is a structured plan that defines how and when you maintain a specific asset to prevent failure, control costs, and meet safety or production targets. Choosing the right maintenance strategy for each asset is one of the highest-impact decisions a maintenance team makes — yet most facilities apply the same approach across all equipment by default.
That default approach is expensive. According to a Reliable Plant study, unplanned downtime costs manufacturers an average of $260,000 per hour. Most of that cost is traced to mismatched maintenance strategies — over-maintaining low-risk assets or under-maintaining critical ones.
Asset criticality — how much an asset's failure impacts safety, production, quality, and compliance — is the core input for any strategy decision. A pump feeding a cooling tower needs a different maintenance plan than the pump driving your primary production line. Reliability-centered maintenance (RCM) formalizes this logic, but you don't need a full RCM study to make smarter per-asset decisions today.
This guide walks you through a criticality-based selection framework you can apply immediately to every asset in your facility.
Before you can match a strategy to an asset, you need a clear picture of what each strategy does, what it costs, and where it fits.
You run the asset until it breaks and then repair or replace it. This is the right choice when an asset is non-critical, easy to replace, and its failure has no safety or production consequence. Think office printers, spare hand tools, or secondary lighting.
You perform maintenance on a fixed calendar or usage interval — every 90 days, every 500 operating hours. Preventive maintenance reduces unexpected failures but can lead to over-maintenance if intervals aren't calibrated to actual wear patterns. It works best on assets with predictable failure modes.
You monitor an asset's real-time condition — vibration, temperature, oil viscosity, pressure — and trigger maintenance only when readings cross a defined threshold. Condition-based maintenance optimizes maintenance spend but requires sensors and monitoring infrastructure. It fits assets where failure is gradual and detectable.
A step beyond CBM, predictive maintenance uses machine learning models trained on historical failure data to forecast failure before it occurs — often days or weeks in advance. PdM demands data maturity and IoT integration. Reserve it for your highest-criticality, highest-cost assets where the ROI justifies the setup investment. Cryotos supports IoT meter reading via SCADA and PLC integration to feed exactly this kind of data pipeline.

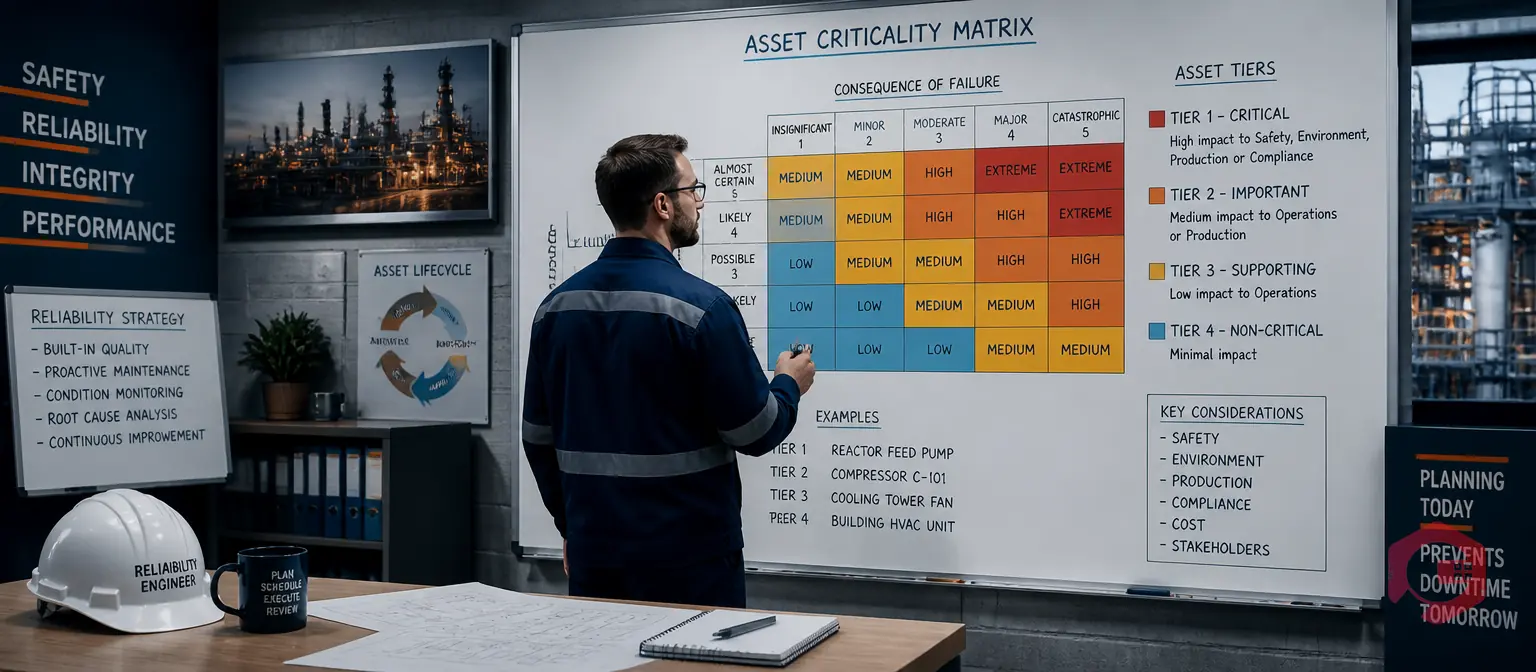
Criticality scoring is the foundation of strategy selection. Rate each asset on a scale of 1–5 across five dimensions. Multiply or sum the scores to get a total criticality index (CI).
Add the five scores. A total of 5–10 is low criticality, 11–17 is medium, and 18–25 is high. This index becomes the direct input to your strategy selection decision.
Once you have a criticality index for each asset, map it to the appropriate maintenance strategy using this decision matrix. This is the core of a criticality-based selection approach.
This matrix is not a rigid rule — it's a starting point. Adjust based on redundancy (a redundant pump can tolerate a lower strategy tier), spare parts availability, and your team's current monitoring capabilities.
Here's how to roll out a criticality-based maintenance strategy selection process across your asset base, whether you're managing 50 assets or 5,000.
You can't score what you haven't documented. Start with a complete asset tracking list that includes asset name, location, age, OEM maintenance specs, and current failure history. Even a spreadsheet works at the start; a CMMS makes it scalable.
Involve your maintenance supervisors, operations leads, and safety team. Cross-functional input improves accuracy. Use the scoring table above and record each factor score alongside the total CI. For large asset bases, start with the top 20% of assets by replacement value — these are usually where the biggest strategy mismatches hide.
Apply the selection matrix. Flag any asset where the current strategy doesn't match the recommended tier. These are your quick wins: assets running on reactive maintenance that should be on a PM schedule, or assets consuming expensive PM labor when CBM signals show they're healthy.
For Tier 1 and Tier 2 assets, run a simplified Failure Mode and Effects Analysis (FMEA). List the top 3–5 failure modes for each asset, their likelihood, and their consequence. This informs whether CBM (detectable failure) or PM (age-based failure) is the better fit within the same tier.
Set up your maintenance schedules in a preventive maintenance software system. Track MTBF and MTTR per asset. Review CI scores annually or after any significant failure event. Criticality isn't static — a production line reconfiguration can change an asset's tier overnight.
Even well-run maintenance teams fall into predictable traps when selecting strategies without a criticality framework.
Selecting the right maintenance strategy is only half the job. Executing it consistently — across shifts, sites, and technicians — is where most teams lose ground. Cryotos CMMS gives you the infrastructure to match strategy to asset and then hold the line.
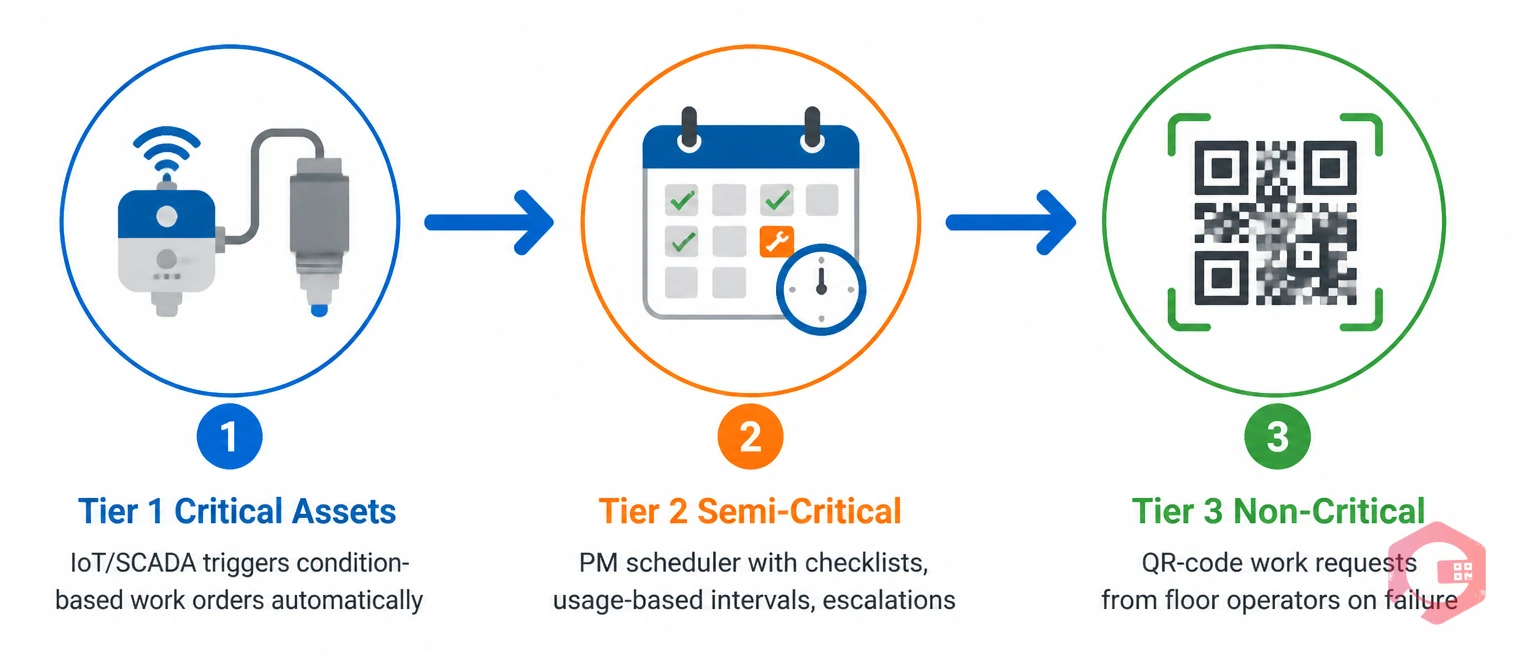
For Tier 1 critical assets, Cryotos connects to your IoT sensors via SCADA and PLC integration, streaming real-time meter readings that trigger condition-based work orders automatically when thresholds are crossed. For Tier 2 semi-critical assets, the preventive maintenance scheduler handles calendar-based and usage-based PMs with drag-and-drop ease, custom checklists, and automatic escalation when tasks are missed. For Tier 3 non-critical assets, QR-code work requests let any operator report a failure from the floor in seconds.
The result: teams using Cryotos report a 30% reduction in downtime and 25% faster repair times — outcomes that track directly to better strategy alignment. You can see this in practice at BorgWarner's implementation, where criticality-driven PM scheduling cut unplanned stoppages across their manufacturing lines.
Use the BI dashboard to monitor MTBF, MTTR, and OEE per asset tier — giving your team the data to validate that each strategy is performing as expected and flag assets that need a tier reclassification.
The most common mistake is applying a single maintenance strategy — usually time-based PM — to all assets regardless of their criticality. This leads to over-maintaining low-risk assets while under-protecting high-criticality equipment. Scoring each asset's criticality before assigning a strategy prevents this.
Review asset criticality scores and strategy assignments at least once a year. Also trigger a review after any significant failure event, major production change, new regulatory requirement, or capital upgrade that alters the asset's role or consequence of failure.
Yes. Start by scoring only your top 20–30 assets by replacement cost or production impact. Even a partial criticality-based approach on your most important equipment delivers significant results without requiring a full asset management overhaul.
Condition-based maintenance triggers action when a real-time sensor reading crosses a set threshold — for example, when vibration exceeds 5 mm/s. Predictive maintenance uses machine learning models trained on historical data to forecast failure before any threshold is crossed, giving days or weeks of advance warning. CBM is reactive to current readings; PdM is proactive about future ones.
A Failure Mode and Effects Analysis identifies the specific ways an asset can fail and the consequences of each failure mode. This directly informs whether time-based PM, condition monitoring, or predictive analytics is the best fit — because the right strategy depends on the failure pattern, not just the asset's criticality tier.
Choosing the right maintenance strategy for each asset doesn't have to be guesswork. With a structured criticality scoring model and a clear selection matrix, your team can move from blanket PM schedules to a targeted, cost-effective approach that protects what matters most. Cryotos asset maintenance management software gives you the tools to assign, schedule, track, and continuously improve the maintenance strategy for every asset in your facility — from a single platform your whole team can use.


Cryotos AI predicts failures, automates work orders, and simplifies maintenance—before problems slow you down.


