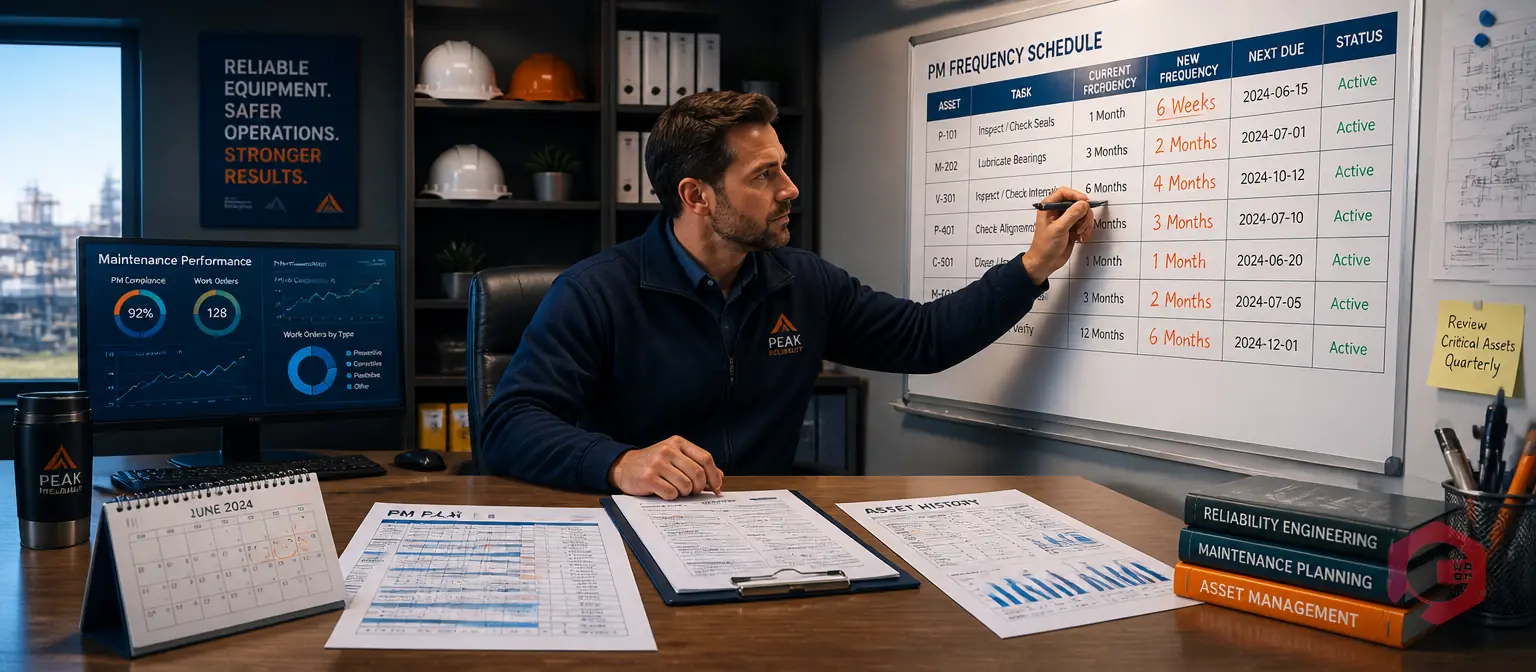
A maintenance strategy review is the process of evaluating whether your preventive maintenance (PM) intervals and tactics still match how your equipment actually fails — without rebuilding your entire program from scratch. Most maintenance teams set PM frequencies at installation using OEM specs, then leave them unchanged until a breakdown forces a rethink. Meanwhile, assets age, production volumes shift, failure patterns evolve, and intervals that worked at year one become dangerously misaligned by year three.
Industry research consistently puts 25–30% of PM tasks in industrial plants at the wrong frequency — too often, not often enough, or using the wrong tactic entirely. This guide covers how often to review PM frequencies, the 7 data signals that demand immediate action, how to tell a frequency problem from a tactic problem, and a repeatable 5-step process that keeps your PM program calibrated year after year.
A maintenance strategy review evaluates whether existing PM intervals and tactics still match current equipment failure behavior. It answers three specific questions: Is this task running too often? Not often enough? Is the inspection method itself wrong for this failure mode?
This is different from a full reliability-centered maintenance (RCM) analysis, which rebuilds your entire maintenance strategy from first principles. An RCM overhaul is the right tool every 5–10 years, or after a major operational change. A maintenance strategy review is the right tool for the annual and quarterly calibration in between. It works from 12 months of CMMS data, takes a fraction of the time, and consistently delivers 10–25% reductions in maintenance cost by eliminating PM tasks that add no reliability value.
Think of it this way: RCM sets the original intervals. Maintenance strategy reviews keep them honest.

Leaving intervals unchanged doesn't preserve your PM program — it degrades it silently. Several forces pull frequencies out of calibration over time.
Running a structured maintenance audit checklist annually catches most of this drift before it becomes a reliability problem. Without one, the average plant carries 25–30% of PM tasks that consume labor and parts without preventing a single failure.
The right review cadence depends on asset criticality, not a single schedule applied uniformly across your facility. The Society for Maintenance and Reliability Professionals (SMRP) recommends tiered review cycles based on the consequence of failure.
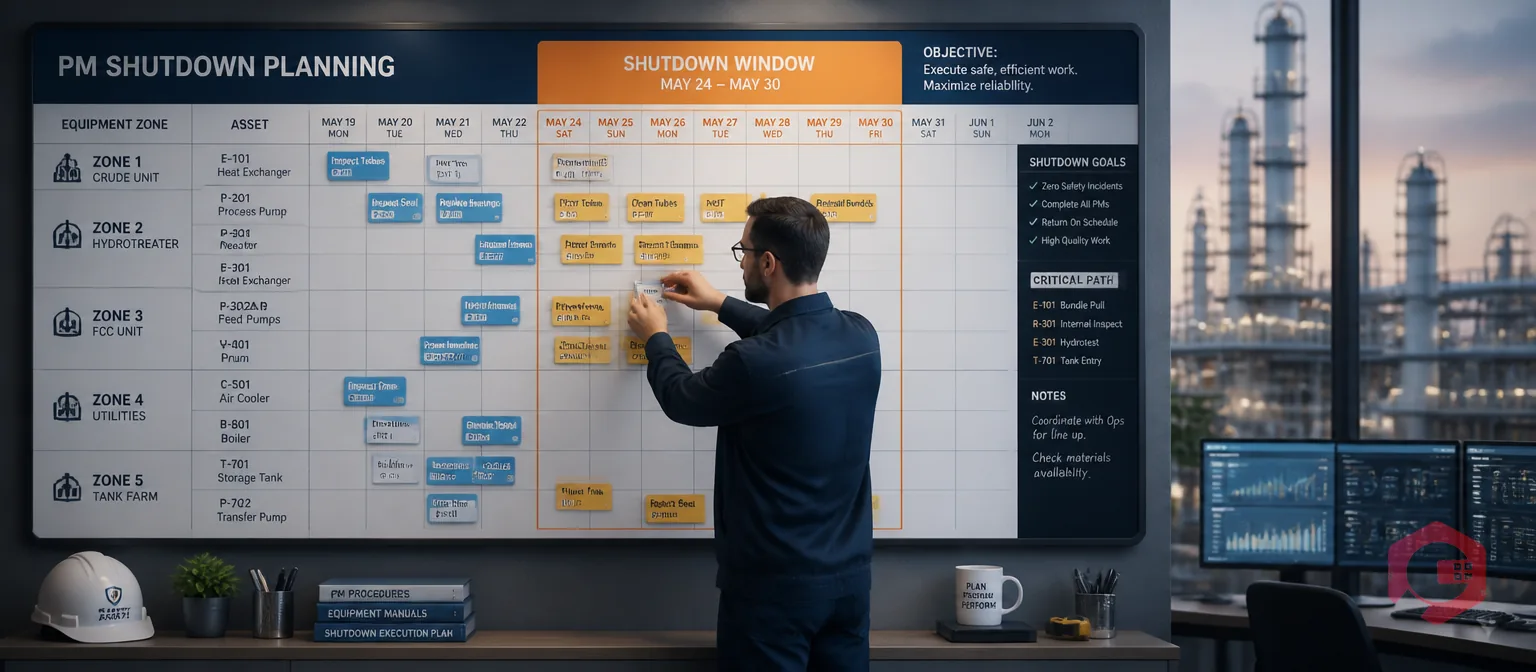
Annual reviews are the minimum baseline for every asset class. Run them at a fixed time — Q1 or ahead of a planned major shutdown — using 12 months of work orders, failure logs, and PM completion data.
Quarterly reviews apply to Tier 1 and Tier 2 assets: any equipment whose failure stops production, creates a safety hazard, or puts you out of regulatory compliance.
Event-triggered reviews happen immediately — regardless of where you sit on the review calendar. Set threshold alerts in your CMMS so these conditions surface automatically.

Teams with the lowest unplanned downtime rates don't wait for the annual review date. They act on data signals that appear weeks or months before the calendar says it's time. These seven conditions mean a PM frequency or tactic needs attention now.
1. MTBF is declining quarter over quarter. Mean time between failures shrinking more than 15–20% over two consecutive quarters is a direct signal that the current interval is too long. Use the MTBF calculator to quantify the gap, then shorten the interval before the next failure cycle completes.
2. PM completion rate drops below 85%. The SMRP benchmark is 90% completion; world-class programs sustain 95%+. A persistent drop below 85% usually signals one of two things: the schedule is unrealistic, or too many tasks are consuming labor that belongs elsewhere.
3. The same failure mode repeats within a single PM cycle. A failure mode appearing twice within one cycle is almost always a tactic problem, not a frequency problem. Shortening the interval will help slightly — switching to the right tactic will solve it entirely.
4. Three or more consecutive inspections find nothing. On a low-criticality asset, three clean inspections in a row is textbook over-maintenance. Extend the interval by 25–50%, monitor the next two cycles, and extend again if nothing surfaces.
5. A production or process change occurred. Any change that alters how an asset operates — higher throughput targets, different raw material inputs, longer shift patterns, ambient temperature changes — invalidates your baseline intervals.
6. Spare parts consumption spikes without a corresponding rise in planned work orders. Unexpected parts usage for a specific asset class signals informal reactive repairs happening between PM cycles.
7. Wrench time on PM tasks is rising while failures caught per inspection are falling. This ratio — defects found per PM task — is one of the cleanest efficiency signals in a PM program and is worth tracking monthly in your BI dashboard.
Changing an interval solves exactly one problem: the task runs too often or not often enough. But when the same failure keeps recurring despite adjusting frequency, the tactic is wrong — not the schedule. Use FMEA data to distinguish between the two before defaulting to "run it more often."
The clearest test: if shortening the interval still doesn't prevent the failure, the tactic needs to change. Shifting to condition-based maintenance on the right assets consistently reduces unplanned failures by 35–45% more than interval tightening alone.
A repeatable process produces defensible interval decisions that hold up to audits and transfer cleanly to whoever runs the next cycle.
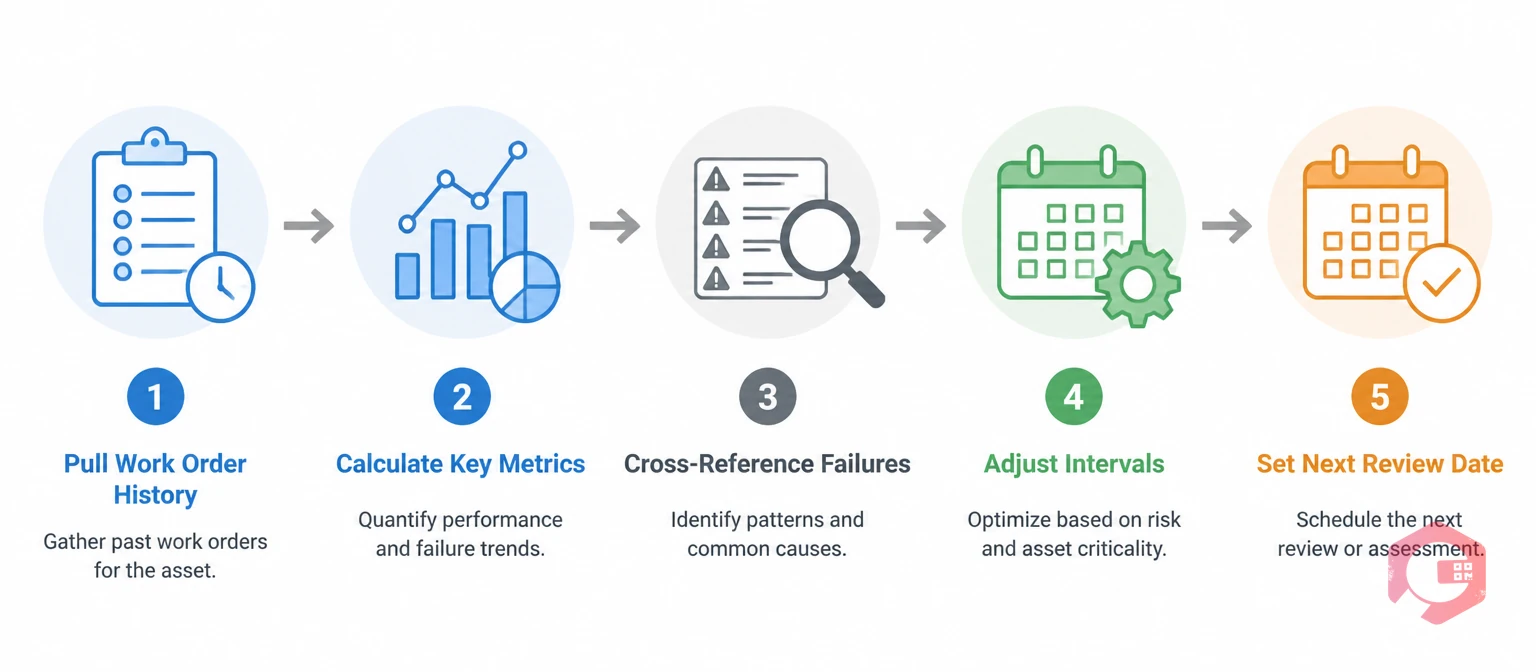
Step 1: Pull 12 months of work order history from your CMMS. Filter by asset, and look for failure patterns, repeat repairs, and tasks that are regularly skipped or deferred.
Step 2: Calculate MTBF, PM completion rate, and planned-to-reactive ratio per asset. A planned maintenance ratio below 70% on a critical asset is a red flag. Your CMMS report builder generates these metrics automatically; no spreadsheet required.
Step 3: Cross-reference failures against PM checklists. For each failure in your history, check whether the active failure mode is covered by an existing PM procedure.
Step 4: Adjust intervals and document every change with rationale. ISO 55002 requires documented review rationale for asset management programs.
Step 5: Set the next review date and log it against the asset record. Every changed interval needs a follow-up date: 90 days for critical assets, 6 months for standard assets. Automate this follow-up flag in your preventive maintenance software so no review date falls through the cracks.
Run through this before closing any PM frequency review. It takes under 10 minutes and catches the gaps that cause programs to drift back out of alignment after the review is done.
Review all PM frequencies at minimum once a year. Critical assets should be reviewed quarterly. Teams that run structured annual reviews consistently reduce maintenance costs by 10–25% compared to those that rely solely on original OEM-set intervals.
An RCM analysis rebuilds your entire maintenance strategy from first principles. A maintenance strategy review is narrower: it checks whether existing intervals and tactics still match current failure patterns, using 12 months of CMMS data.
The SMRP benchmark for PM completion rate is 90% or higher. World-class programs sustain 95%+. Teams below 85% typically carry over-maintained low-priority assets that consume technician capacity without delivering reliability value.
An interval is too long if failures occur between cycles or MTBF is trending downward over two or more quarters. An interval is too short if inspections consistently find nothing on a low-criticality asset.
When the failure mode isn't detectable by the current inspection method, changing frequency solves nothing. Use FMEA to match tactic to failure mode before defaulting to running any PM more often.
Seven conditions trigger an immediate review: an unplanned failure on a recently serviced asset; the same failure mode appearing twice within one PM cycle; any production or process change; MTBF declining more than 15% over two consecutive quarters; a change in regulatory inspection requirements; an unexplained spike in spare parts consumption; or wrench time rising while defects found per inspection are falling.
Record three things for every interval change: the specific data that drove the decision (MTBF trend, failure history, completion rate), the new interval and effective date, and the outcome you expect at the next review. Log this in the CMMS against the asset record — not in a separate spreadsheet or shared document.
Calibrating PM frequencies and tactics is one of the highest-return activities in maintenance management — and one of the most consistently neglected. Most teams know their intervals are wrong; far fewer have a systematic process to find which ones and fix them before the next breakdown does it for them.
Cryotos CMMS automates PM scheduling, tracks MTBF and completion rates in real time, and flags assets that meet any of the seven review triggers before the next failure occurs. Teams using Cryotos report 30% less downtime and 25% faster repairs — because the system catches interval drift before it becomes an unplanned outage.
See how Cryotos preventive maintenance software keeps PM intervals calibrated automatically — schedule a demo to see it working in your environment.


Cryotos AI predicts failures, automates work orders, and simplifies maintenance—before problems slow you down.


