
Most managers are still making today's decisions with yesterday's data. An MIS dashboard changes that — giving every level of leadership live visibility into the numbers that drive the business.
Walk into any operations meeting and the same pattern plays out. Someone shares a report pulled together the previous evening. Half the numbers are already out of date. Decisions get deferred because no one is confident the data is current. By the time the team agrees on what is happening, the window to act has already closed.
This is the environment most managers and supervisors still operate in - and it is entirely preventable. A well-configured Management Information System (MIS) dashboard replaces the cycle of manual reports, late data, and reactive decision-making with something better: a single, live view of the metrics that matter, available to the right people at the right time.
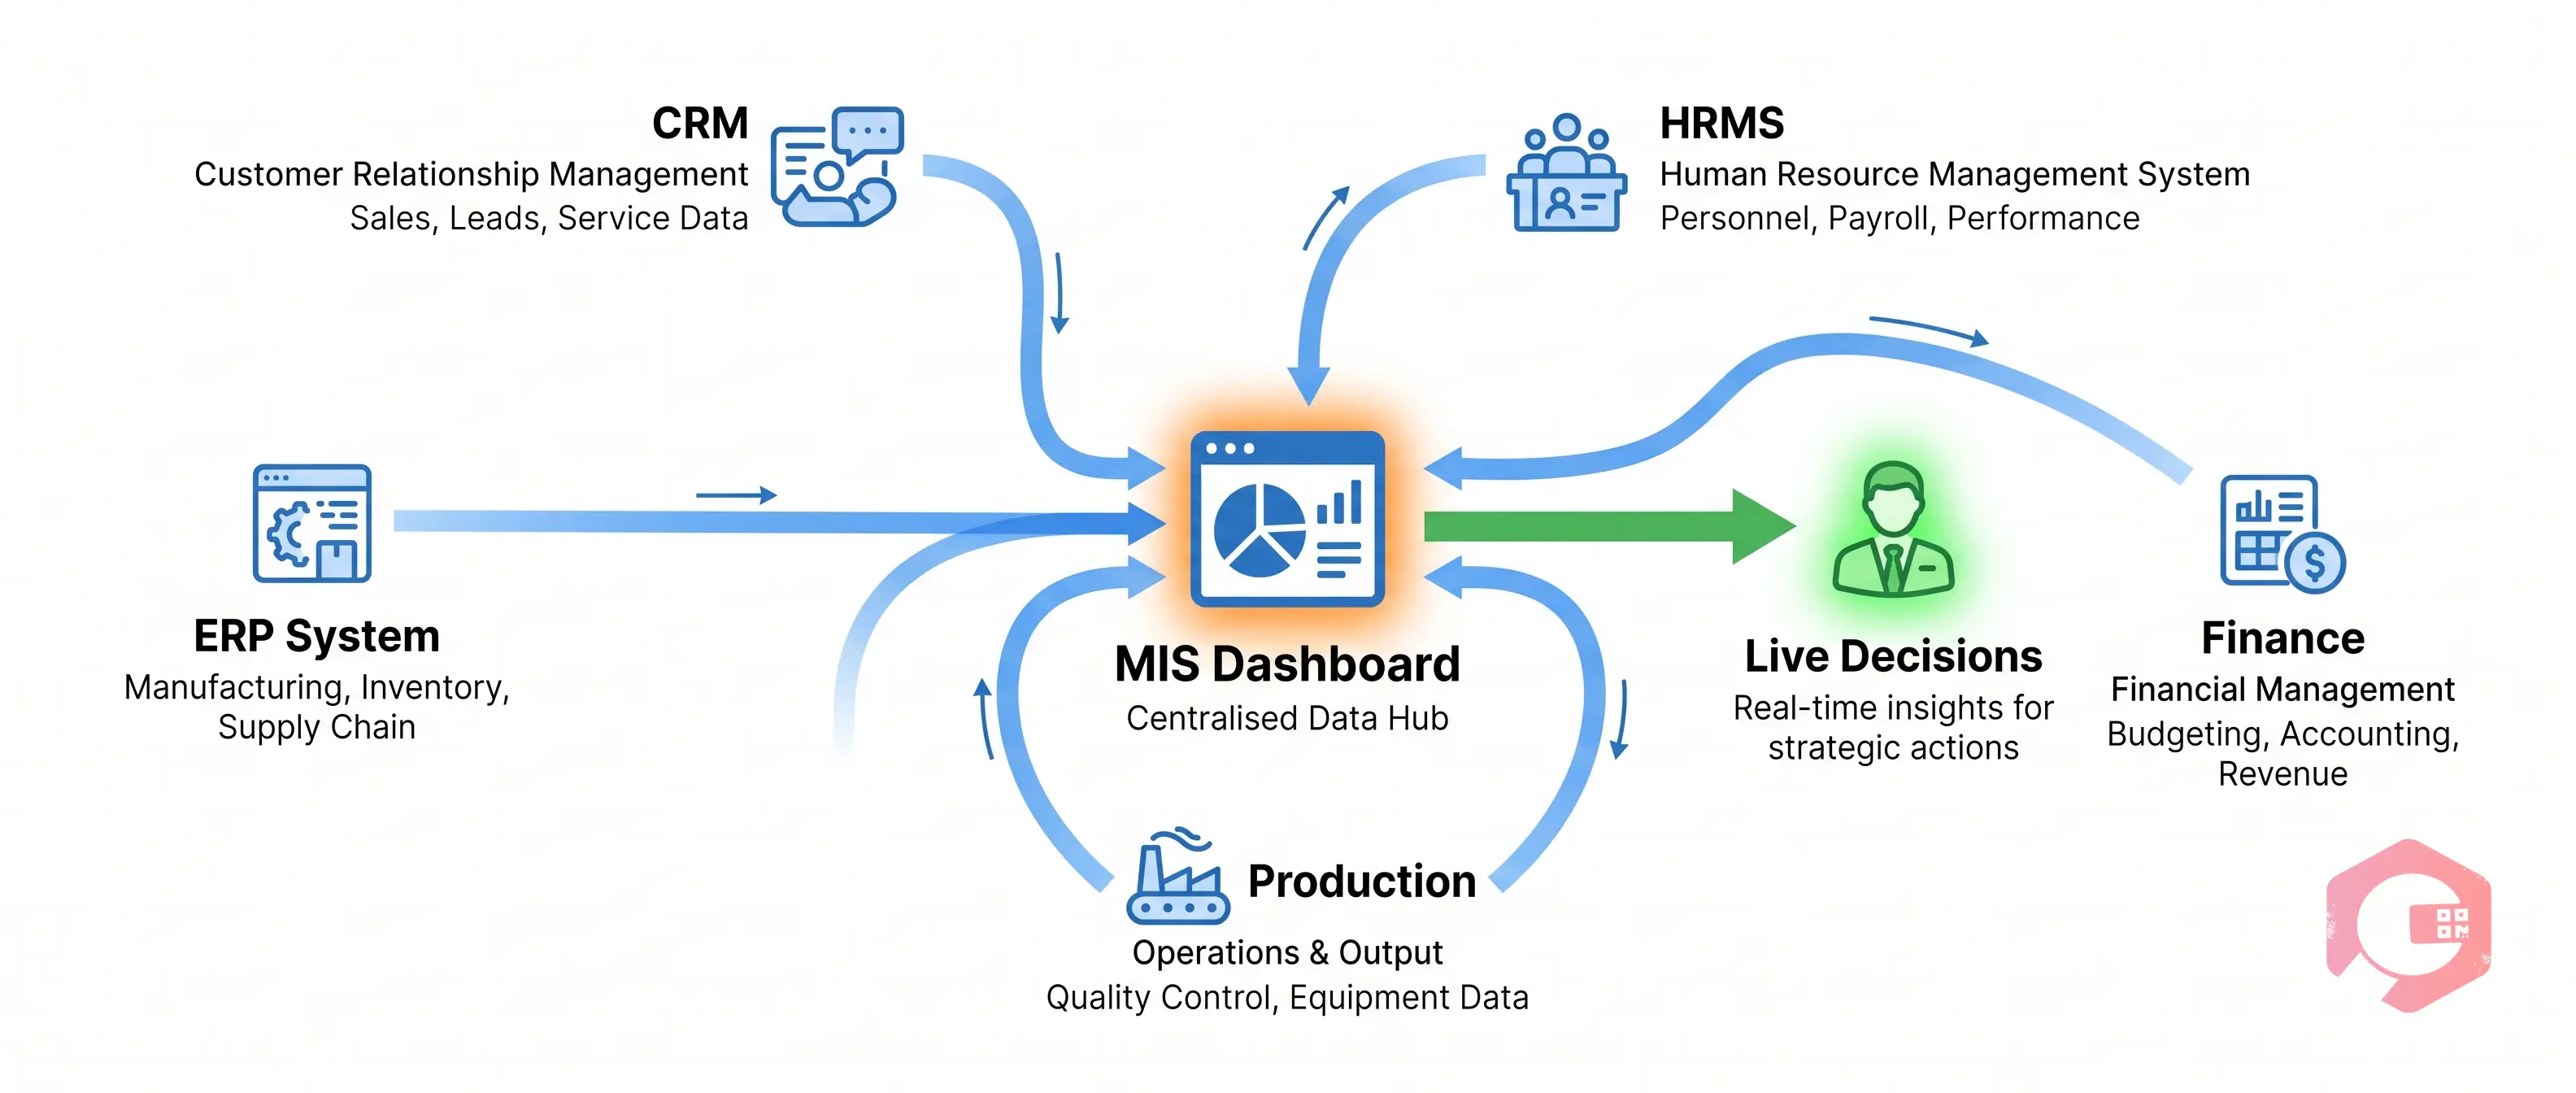
A Management Information System (MIS) dashboard is a centralized, visual interface that pulls data from across your business - ERP, HRMS, CRM, production tools, finance software - and displays it as live metrics, charts, and alerts that managers and supervisors can act on immediately.
The key word is live. Unlike a PDF report emailed every Monday morning, an MIS dashboard connects directly to source systems and refreshes continuously. When a production line slows, when a budget line goes over threshold, when a team's output drops below target - the dashboard surfaces it in real time, not after the fact.
Think of it as the cockpit of your operation. A pilot does not guess altitude or fuel level - they read the instruments. A manager using an MIS dashboard does not estimate headcount costs or delivery rates - they see them directly, with trend context and exception alerts built in.
Not all dashboards deliver equal value. The platforms that genuinely change how managers operate share a consistent set of capabilities that go well beyond basic charts and tables.
Data that updates as activity happens - not on a nightly batch schedule. When a work order closes, when a shipment is received, when an invoice is approved, the dashboard reflects it within moments. This is what transforms a reporting tool into an operational tool.
Every role has different priorities. A production supervisor cares about throughput and defect rates. A finance manager watches budget variance and cost per unit. A strong MIS dashboard lets each user configure their own view, pinning the metrics that drive their specific decisions without cluttering the screen with noise that belongs to someone else.
Setting a red-amber-green threshold on any metric means the system does the monitoring so managers do not have to. When attendance drops below the required level for the upcoming shift, when a machine's downtime hours cross the weekly limit, when a budget line reaches 90% of its allocation - the right person is notified automatically, before the situation becomes a crisis.
Summary numbers are useful for spotting trends. The ability to drill down into them is what enables action. A single click on a regional sales total should reveal performance by territory, then by rep, then by product line. Without this capability, a manager can see that something is wrong but cannot diagnose why.
Payroll data, individual performance records, and financial projections carry sensitivity that not every user should see. A well-designed MIS dashboard enforces access by role - supervisors see what is relevant to their team, directors see cross-functional summaries, and the finance team retains control over sensitive cost data.
Scheduled exports - daily digests, weekly summaries, monthly board packs - serve the broader stakeholder group that needs to stay informed without living inside the system. Automating this eliminates the manual report-building that consumes hours of management time every week.

Senior managers carry responsibility for decisions that span departments, budgets, and planning horizons. The quality of those decisions depends directly on the quality of the information available at the time they are made.
With an MIS dashboard, a manager responsible for operations across multiple sites can see output, downtime, and cost metrics for every location on one screen - without consolidating spreadsheets from four different teams. A finance manager can compare budget against actuals in real time, not after month-end close. An HR director can track headcount, attrition, and training completion across the organization without waiting for the quarterly HR report.
The practical result is faster decisions made with greater confidence. Quarter-over-quarter trends are visible at a glance. Underperforming units surface before board reviews rather than during them. Capital allocation conversations happen with current data rather than projections built on last month's numbers.
Managers also benefit from what an MIS dashboard removes from their week. Time previously spent chasing updates, consolidating reports, and cross-checking figures from different systems is reclaimed. Studies consistently show that managers in data-mature organizations spend up to 40% less time on information gathering and significantly more time on the strategic work that drives results.

Supervisors operate in a different time horizon from senior managers. Where a director is thinking in quarters, a supervisor is thinking in shifts. The question is not how the business is tracking against its annual plan - it is whether this team, right now, is going to hit today's target.
An MIS dashboard configured for supervisory use brings that shift-level clarity into sharp focus. Attendance and schedule coverage are visible before the shift begins. Individual output rates update throughout the day so a supervisor can spot an underperforming team member at 10 AM rather than discovering the shortfall at end-of-day. Quality metrics flag defect patterns the moment they start forming rather than appearing in a report the following morning.
For supervisors managing physical operations - warehouse teams, production floors, field service crews - the mobile accessibility of modern MIS dashboards is particularly valuable. A supervisor who can check team performance, open incidents, and SLA status from a smartphone on the floor does not need to return to a desk to stay informed. The information comes to them, where the work is happening.
The shift this creates in supervisor behavior is significant. Instead of responding to problems after they have already impacted output, a supervisor with real-time visibility can intervene while there is still time to recover. That is the difference between a shift that misses its target and one that hits it.

The case for MIS dashboards is well established across industries. Organizations that implement them consistently report the same categories of improvement - and the returns compound as usage matures.
When decisions are grounded in live data rather than aging reports, the pace of organizational response improves significantly. Research indicates that data-driven organizations make operational decisions up to five times faster than those still relying on periodic manual reviews. The quality of those decisions also improves because they are not based on assumptions about what the current situation might be.
The average manager spends between eight and twelve hours per week assembling data from multiple systems - pulling figures from the ERP, formatting them in a spreadsheet, distributing the output, and fielding questions about what the numbers mean. An MIS dashboard eliminates this cycle entirely. The data assembles itself, the distribution happens automatically, and managers spend that time on work that creates value rather than work that transmits information.
Threshold alerts mean problems are surfaced when they are still small. A rising defect rate in the first two hours of a shift can be investigated and corrected before it affects a day's output. A budget line trending over target in week two of the month can be addressed before the overspend is locked in. This proactive posture reduces the frequency and cost of operational emergencies across the board.
When performance data is visible, shared, and objective, accountability becomes a structural feature of the organization rather than something that depends on a manager's presence or attention. Teams that know their output is tracked in real time perform differently from those who know their numbers are reviewed once a week. The effect is genuine and measurable - and it works at every level of the organization.
Much organizational friction comes from departments working from different versions of the truth. Sales believes inventory is available; operations knows it is not. Finance sees costs one way; the business unit sees them another. An MIS dashboard that all functions draw from eliminates this problem at its source. When everyone is looking at the same numbers, the conversations that need to happen become straightforward rather than contentious.
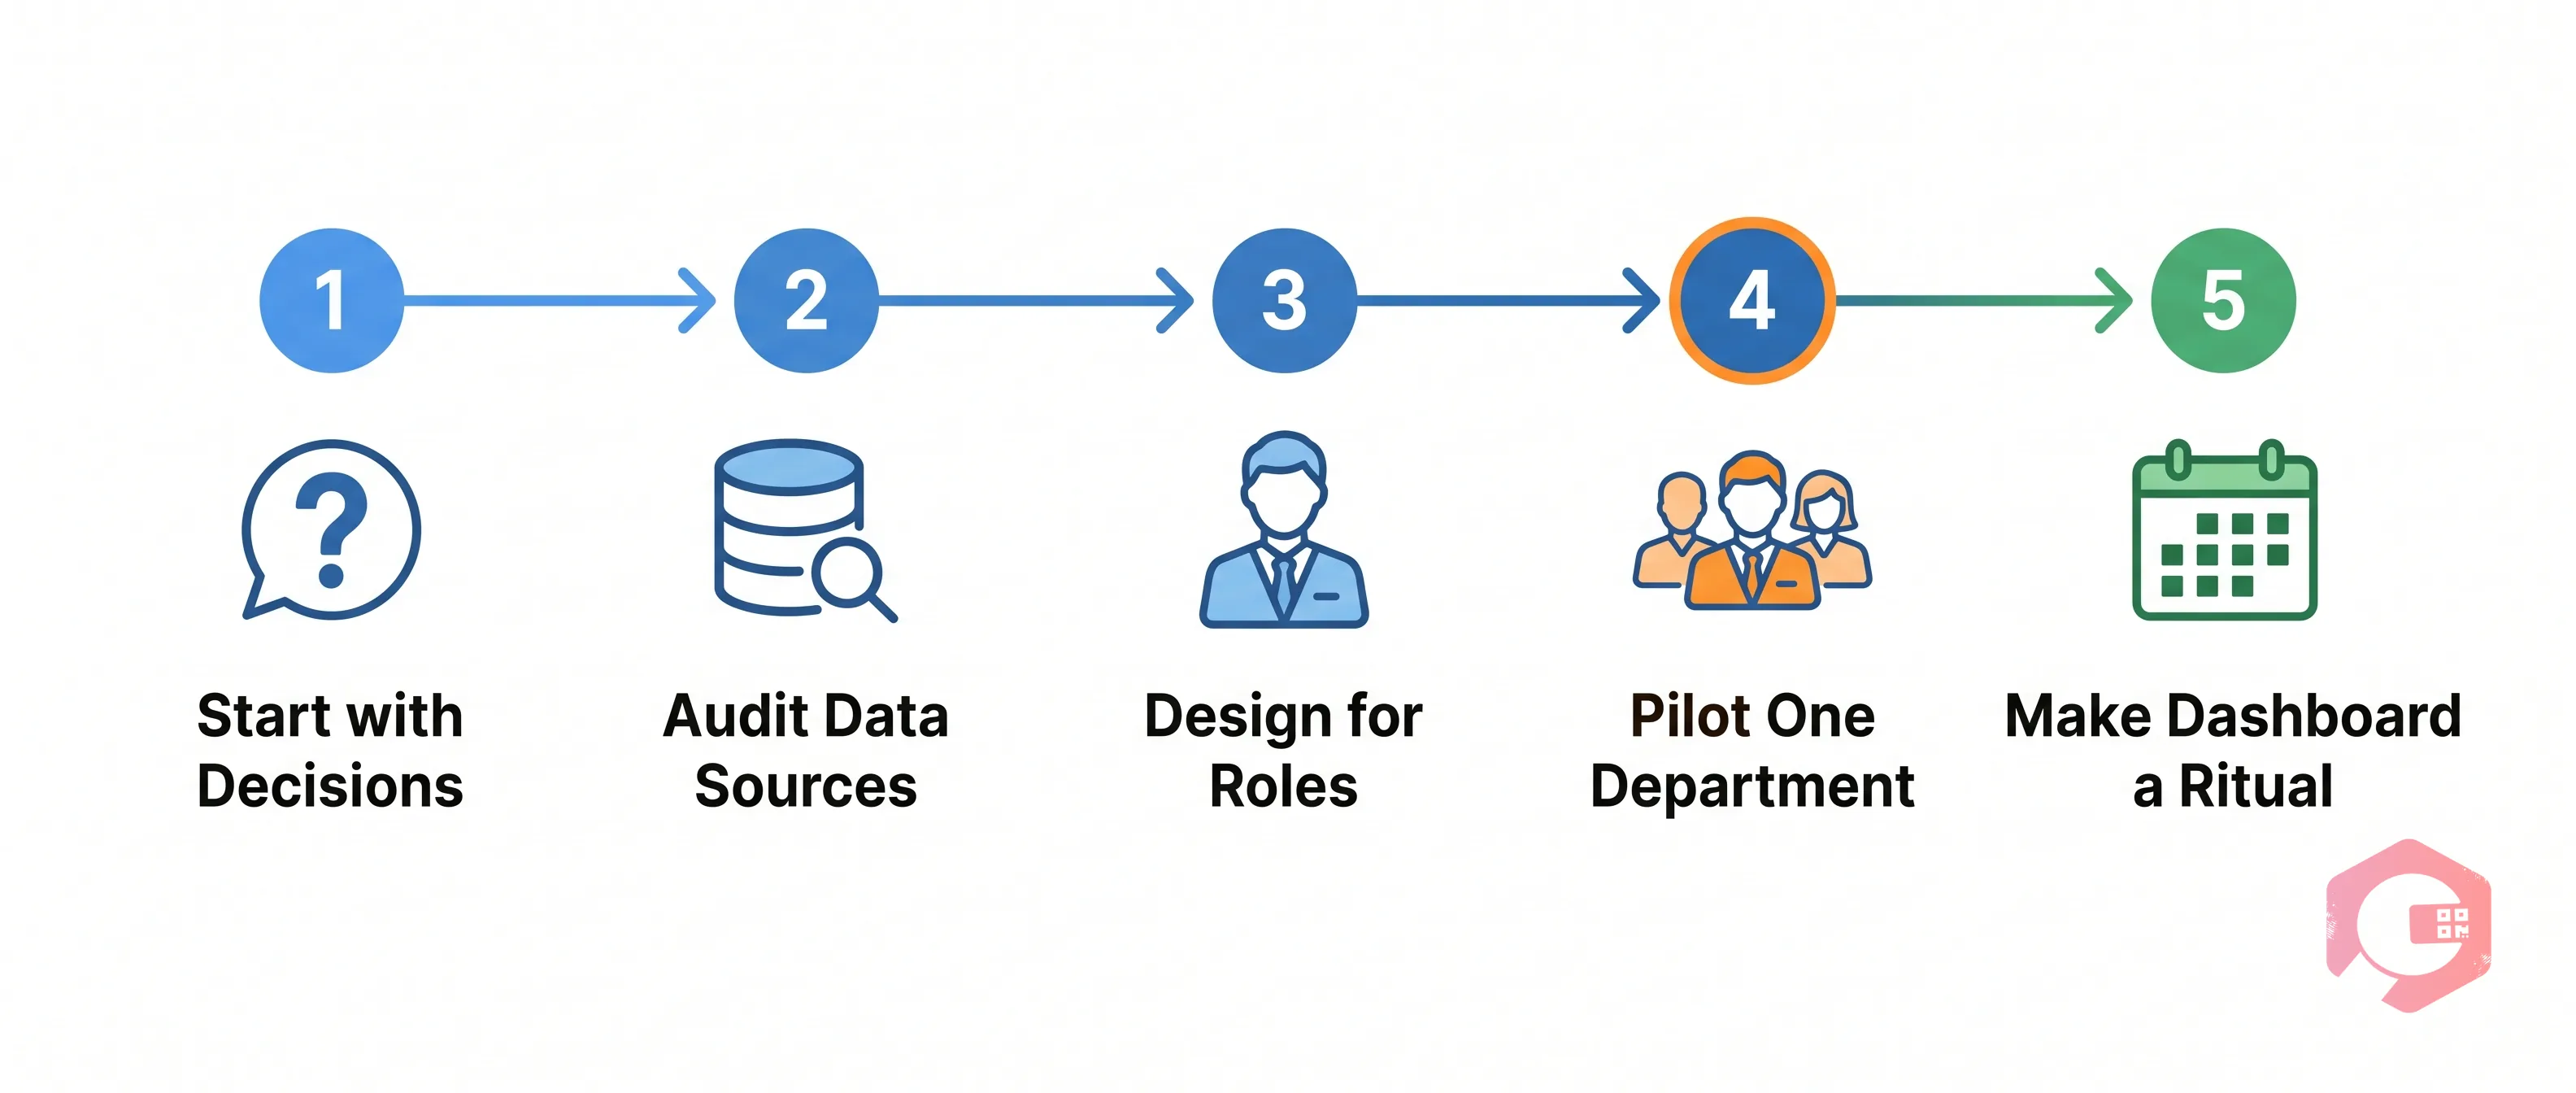
Successful implementations follow a consistent pattern. The organizations that get the most from their MIS dashboards are those that begin with business problems rather than technology features - and deploy incrementally rather than all at once.
The most useful question to ask before selecting a platform is: what decisions are we currently making slowly, poorly, or with low confidence? The answers define the metrics the dashboard must deliver. Starting with a data inventory or a feature comparison before answering this question produces a dashboard that is technically complete and operationally irrelevant.
An MIS dashboard is only as good as the data feeding it. Before configuration begins, identify where each required metric currently lives, how frequently it updates, and how reliable it is. Data quality problems that exist in source systems do not disappear when they reach a dashboard - they become more visible and more consequential. Fixing the foundation before building on it saves significant rework later.
A shift supervisor and a chief operating officer both need dashboards - but they need completely different dashboards. The most effective implementations build distinct views for each user persona: the metrics a supervisor needs to run a shift are not the metrics a director needs to run a quarterly review. Combining them produces a screen that serves no one well.
The most common reason MIS implementations fail is scope. A single-department pilot over thirty to sixty days surfaces adoption barriers, data quality issues, and configuration gaps that would have been far more expensive to discover after a full enterprise rollout. Build the habit of using the dashboard well in one team before deploying it across the organization.
The technology delivers its value only when the behavior changes. Establish weekly or daily dashboard reviews as a formal part of management cadence. Create clear protocols for what happens when a metric crosses a threshold. Train users not just on how to read the dashboard but on what action each data point should trigger. A dashboard that is looked at but not acted on is a reporting tool. A dashboard that changes behavior is an operational asset.
An MIS dashboard is designed specifically to support management decisions - it prioritizes operational KPIs, exception alerts, and role-appropriate visibility. A BI (Business Intelligence) dashboard typically serves a broader purpose, including exploratory analysis, ad hoc reporting, and data discovery. In modern platforms, the two have largely converged, and the terms are often used interchangeably.
A single-department pilot using a cloud platform like Power BI, Tableau, or a purpose-built operations dashboard can be live within four to eight weeks when the underlying data sources are clean and well-structured. A full enterprise rollout across multiple integrated systems typically takes three to nine months, depending on data complexity and the number of systems being connected.
Manufacturing, logistics, healthcare, retail, financial services, and IT service management organizations consistently report the strongest results - particularly those with large operational teams, multi-site complexity, or strict compliance reporting requirements. That said, any organization with more than a handful of systems and more than fifty employees will gain measurable value from centralizing visibility.
Yes. All major MIS and BI platforms offer responsive mobile interfaces or dedicated apps. For supervisors managing physical operations - manufacturing floors, warehouses, field service teams - mobile access is not a convenience feature but a core requirement. The value of real-time data disappears if accessing it requires leaving the floor and returning to a desk.
The gap between organizations that respond to problems and organizations that prevent them is, in large part, a data visibility gap. Managers who see what is happening in real time make better decisions, faster. Supervisors who can monitor their team's performance throughout a shift - not just at the end of it - deliver consistently better results.
An MIS dashboard does not make good managers unnecessary. It removes the information friction that prevents good managers from operating at their best. The data was always there. The dashboard makes it useful at the moment the decision needs to be made.
For organizations still running on morning reports and end-of-week summaries, the shift to real-time dashboard visibility is one of the highest-return operational improvements available - and it compounds over time as the organization learns to act on what it sees.
Want to see how a live operations dashboard transforms management decision-making? Book a free demo with Cryotos today.


Cryotos AI predicts failures, automates work orders, and simplifies maintenance—before problems slow you down.


