The difference in MTTF vs MTBF comes down to repair: MTTF measures the average life of parts that are replaced when they fail, while MTBF measures the average run time between failures of assets that are repaired and returned to service. Both turn failure history into numbers you can plan with. Used well, they tell you when to replace parts, how often to service equipment, how many spares to stock, and how much repair labor to budget.
Many teams track one of these numbers but never use it to make a decision. This guide compares the two metrics side by side, shows how to calculate each one with worked examples, and explains how to turn them into PM intervals, replacement plans, spare parts levels, and staffing.
Key Takeaways
MTTF vs MTBF is mainly a question of what happens after a failure. If the item is thrown away and replaced, use MTTF. If the item is repaired and keeps running, use MTBF.
| Attribute | MTTF (Mean Time to Failure) | MTBF (Mean Time Between Failures) |
|---|---|---|
| Applies to | Non-repairable items that are replaced after failure. | Repairable assets that are fixed and returned to service. |
| Typical examples | Bearings, seals, lamps, fuses, filters, electronic boards. | Pumps, motors, conveyors, compressors, packaging machines. |
| Basic formula | Total operating time of all units ÷ number of units that failed. | Total operating time ÷ number of failures. |
| Main planning use | Replacement timing and spare part demand. | PM intervals, availability, and repair staffing. |
| Pairs with | Part life and replacement cost. | MTTR (mean time to repair) and availability. |
| Common mistake | Treating MTTF as a guaranteed life. | Treating MTBF as a safe run time before service. |
In practice, one asset often needs both. A pump is repairable, so you track its MTBF. Its mechanical seal is replaced on failure, so you track the seal's MTTF.
Keep this split in mind for the rest of the guide: the MTTF vs MTBF choice decides which planning decision each number can support.
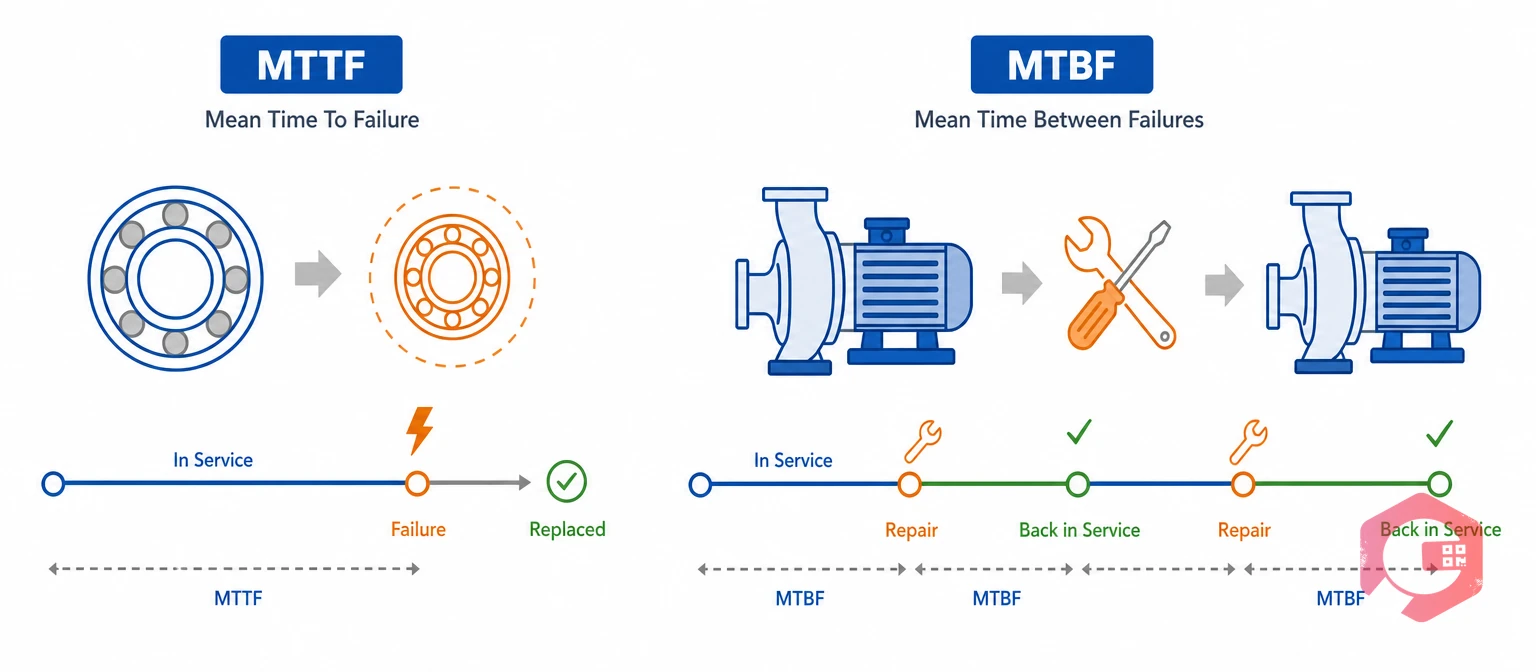
MTTF is the average operating time before a non-repairable item fails for the first and only time. Because the item is replaced rather than repaired, each unit contributes one failure and one lifetime to the average.
The term is defined in reliability standards such as IEC 60050-192, the international vocabulary for dependability. It is widely used in reliability engineering for components and spare parts.
MTTF = total operating time of all units ÷ number of units that failed
Say a plant tracks 10 identical mechanical seals on a group of pumps. Over time, all 10 fail, and their combined run time adds up to 52,000 hours. MTTF is 52,000 ÷ 10, or 5,200 hours.
MTTF tells you the average life of a part population, which is the starting point for replacement and spares planning. It is the half of the MTTF vs MTBF pair that belongs on your spare parts list.
MTBF is the average operating time between one failure and the next on a repairable asset. After each repair, the asset returns to service and the clock starts again.
The Society for Maintenance and Reliability Professionals (SMRP) lists mean time between failures among its standard reliability metrics, and most maintenance teams report it monthly or quarterly.
MTBF = total operating time ÷ number of failures
A transfer pump runs 4,380 hours in six months and has 6 breakdowns in that time. MTBF is 4,380 ÷ 6, or 730 hours. On average, the pump runs about a month between failures.
Want to check your numbers? Use the free Cryotos MTBF calculator to work out MTBF for any asset from run hours and failure counts.
Pick the metric by asking one question for each item: when it fails, do we repair it or replace it? The answer sets which number belongs in your asset record.
Most facilities end up with MTBF on the asset and MTTF on the parts list. That split is the practical answer to the MTTF vs MTBF question for a maintenance team.
MTBF becomes much more useful when you pair it with mean time to repair (MTTR). Together they give inherent availability, which shows how much of the time an asset is ready to run.
Availability = MTBF ÷ (MTBF + MTTR)
Using the pump above, MTBF is 730 hours. If the average repair takes 4 hours, availability is 730 ÷ 734, or about 99.5 percent. Cutting repair time to 2 hours lifts it to about 99.7 percent, while doubling MTBF to 1,460 hours gives the same result. In this case, halving repair time is worth as much as doubling run time, which is a point the MTTF vs MTBF debate often misses.
Failure rate is the number of failures per unit of operating time, and it is the inverse of MTBF when failures are random. A failure rate of 0.00137 failures per hour matches an MTBF of 730 hours. You can convert between them with the free failure rate calculator.
MTTF and MTBF only add value when they change a decision. A simple method keeps the numbers tied to action.

The Three-Lens Reliability Planning Method:
Run the method on your top 20 critical assets first. Those assets usually account for most unplanned downtime, so better decisions there pay back fastest.
Teams that apply the method each quarter turn the MTTF vs MTBF numbers in their reports into a living maintenance plan.
The most common mistake is to schedule service at the MTBF or MTTF value. An average is not a safe limit, because many failures happen before the average is reached.
If failures are random, reliability follows R(t) = e−t/MTBF. At a run time equal to MTBF, only about 37 percent of units are still running. That means about 63 percent have already failed before the "average" life.

The bathtub curve shows these three phases over an asset's life. A Weibull analysis of your failure times tells you which phase each failure mode is in, so you can choose the right task.
A packaging line tracks 24 drive belts. Their MTTF is 3,000 hours, and almost no belts fail before 2,200 hours, which is a classic wear-out pattern. The team sets a planned replacement at 2,000 hours, during a weekly stop. Belt failures drop sharply, and each change happens on planned time instead of in the middle of a shift.
Whichever side of MTTF vs MTBF applies, use the failure pattern, not the average alone, to set every interval. That one rule separates good reliability planning from guesswork.
Failure averages also tell you how many parts and labor hours a year of operation will need. The math is simple and easy to explain to finance.
For example, 12 pumps run 8,000 hours a year each, and their seals have an MTTF of 4,000 hours. Expected seal failures are 12 × 8,000 ÷ 4,000, or 24 a year. If each seal change takes 3 hours with two technicians, plan for 144 labor hours.
Link these numbers to inventory management, so minimum stock levels match real failure rates instead of guesswork.
When spares and labor follow the data, fewer repairs wait for parts and fewer shifts run short of hands. This is where MTTF vs MTBF stops being a definitions question and becomes a budget question.
Most bad reliability decisions come from bad inputs, not bad math, and the MTTF vs MTBF numbers are only as good as the records behind them. Maintenance teams that successfully use failure data avoid these errors:
Fixing data habits, such as logging failure codes and run hours on every work order, does more for reliability numbers than any new formula.
A Computerized Maintenance Management System collects the run hours, failure codes, and repair times that MTTF and MTBF depend on. It then puts the results in front of the people who plan the work.
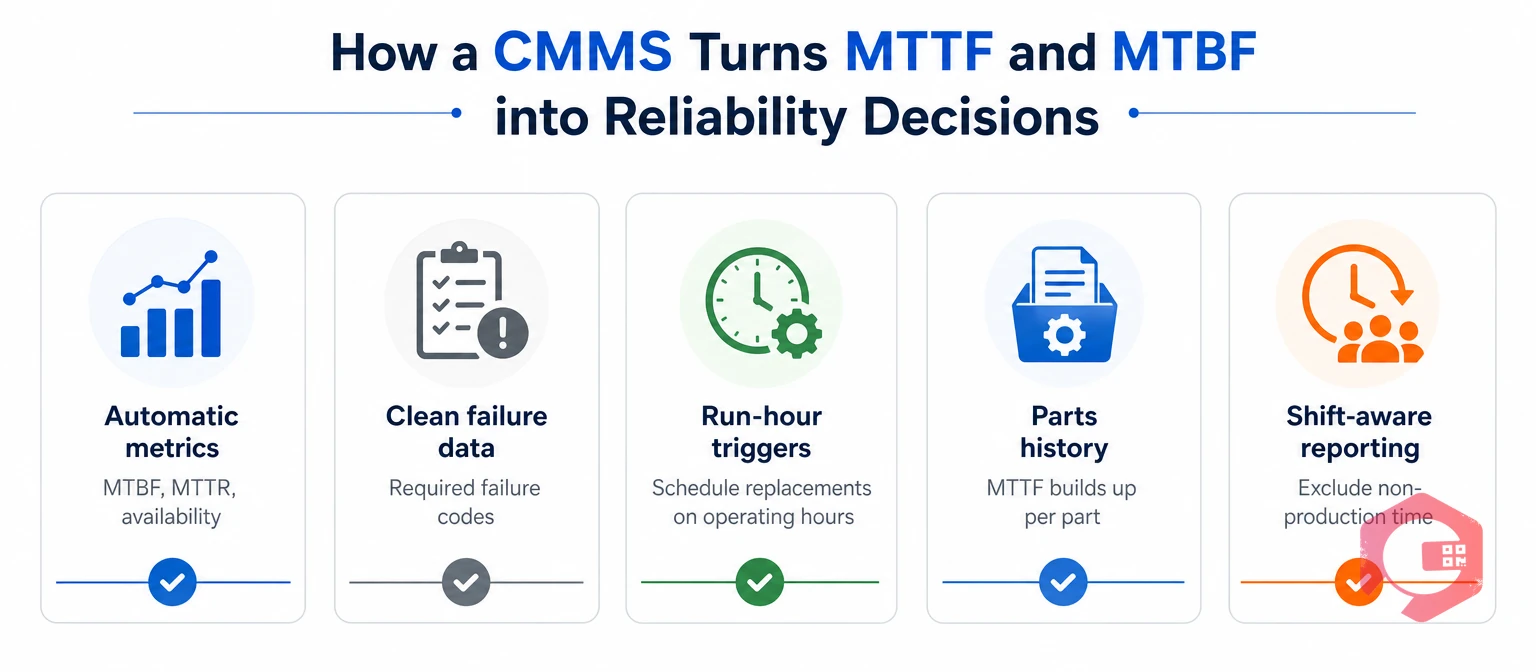
Better data leads to better decisions. Maintenance teams using Cryotos have reported up to 30% reduction in unplanned downtime and 25% faster repair turnaround. Much of that comes from acting on failure data instead of only reporting it.
Feed what you learn back into your FMEA and reliability-centered maintenance reviews, so each new failure improves the next plan.
MTTF applies to items that are replaced when they fail, and it measures their average life. MTBF applies to assets that are repaired, and it measures the average run time between failures. The choice depends on whether you repair or replace the item.
Yes. Most teams track MTBF for the main asset, such as a pump or motor, and MTTF for its replaceable wear parts, such as seals, bearings, and filters.
A higher MTBF means fewer failures, which is usually good. However, availability also depends on repair time, so an asset with high MTBF and long repairs can still cause large losses.
Usually not. Many parts fail before the average, so replacing at MTTF lets a large share fail first. For wear-out parts, replace earlier based on the failure pattern, and for random failures, use condition monitoring.
More is better. A handful of failures gives a rough guide, while a larger history gives a steadier number. Combine small samples with similar assets only if they share the same design and duty.
Start with your most critical assets. Track MTBF for each one, then add MTTF for the two or three wear parts that fail most often. Expand once failure codes and run hours are recorded reliably on every work order.
No. Planned maintenance stops are not failures, and their hours are not operating time. Counting them as failures makes MTBF look worse, while counting their hours as run time makes it look better than it is.
Used together, MTTF and MTBF tell your team when to replace parts, how often to service assets, and what to stock. Schedule a free demo to see how Cryotos calculates MTBF, MTTR, and part life from your own work orders and turns them into planned work.



Cryotos AI predicts failures, automates work orders, and simplifies maintenance—before problems slow you down.