

Integrating OEM telematics data into your maintenance system means connecting data from your equipment or fleet manufacturer straight into your maintenance software. That data includes engine hours, fault codes, GPS location, and battery state. Once it's connected, this data can trigger real maintenance work. It no longer just sits unread in a separate dashboard. Most fleets and heavy-equipment operators already pay for OEM telematics hardware. The real problem is speed. A fault code needs to become a work order fast, before a small sensor issue turns into a costly roadside breakdown. This guide covers what OEM telematics integration involves. It shows how data moves from the equipment to a technician's phone. It also covers what a Computerized Maintenance Management System can and can't do with it today.
Key Takeaways
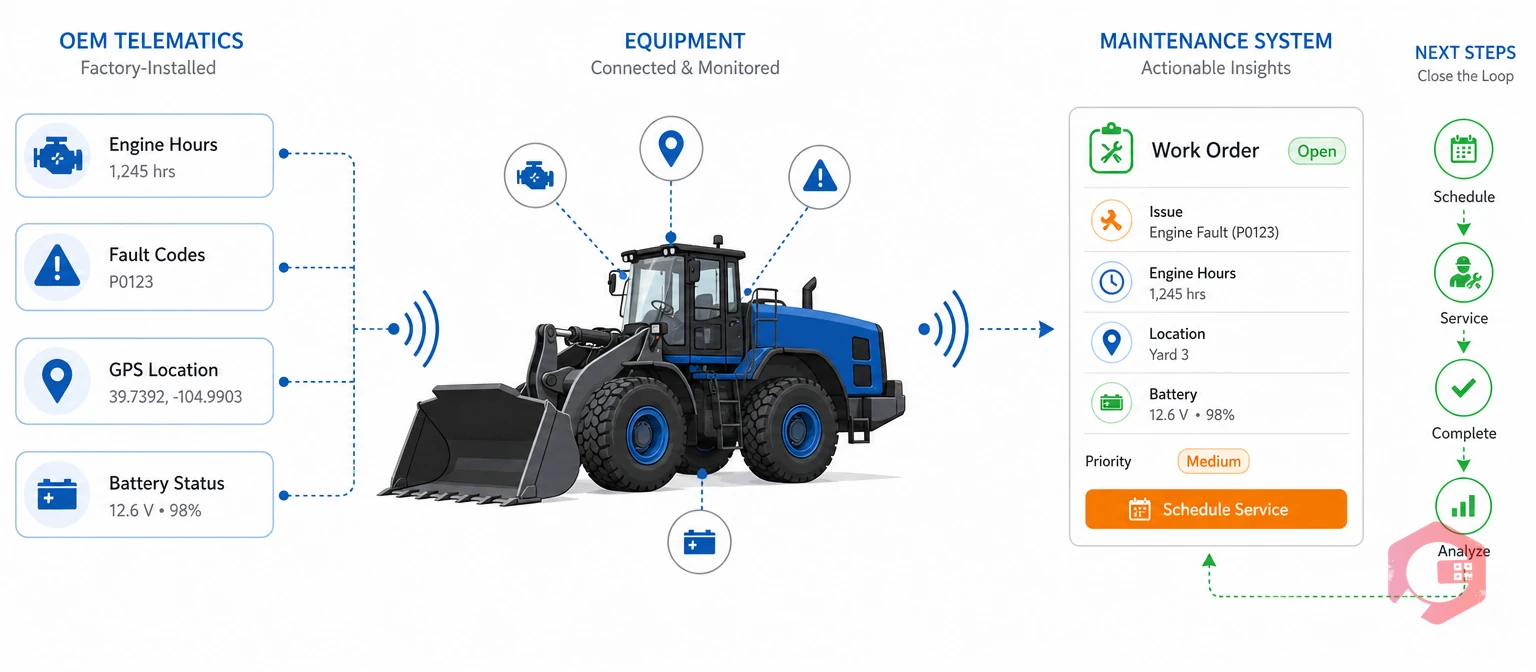
OEM telematics integration is feeding a manufacturer's factory telemetry data straight into a maintenance system so it can trigger action on its own. A fleet manager doesn't have to log into a separate telematics portal and decide what needs attention. The data flows straight into the system that creates and assigns work orders.
Telematics is the broader field that combines telecom and vehicle monitoring tech to send data over a distance. OEM telematics is the factory-installed version. Makers like Ford, GM, Caterpillar, Volvo, and John Deere build the sensors and modems right into the equipment. Aftermarket telematics is different. It gets added later as a separate plug-in device.
Every OEM platform sets up its data a bit differently. Still, most fleets and heavy-equipment operators can count on the same core signals:
Industry data shows 30–40% of industrial facilities now use some form of predictive maintenance. Yet only 55% report higher maintenance staff productivity after adopting it, according to Reliable Plant. That gap is telling. Most facilities and fleets aren't short on data. They're short on a system that turns that data into a scheduled, assigned, trackable job.
Condition-based maintenance is scheduling service around an asset's real condition instead of a fixed calendar date. This approach, explained in more depth in our condition-based maintenance glossary entry, depends on exactly this kind of measured signal. Engine hours, fault codes, and usage patterns replace guesswork with real evidence. A truck that runs 18 hours a day needs service sooner than one that sits idle most of the week, and only telematics data can tell you which is which.
Maintenance teams that connect telematics feeds straight to their CMMS close the productivity gap Reliable Plant's research points to. The data doesn't just get collected. It gets routed to a technician, with full context already attached, before the problem gets worse.
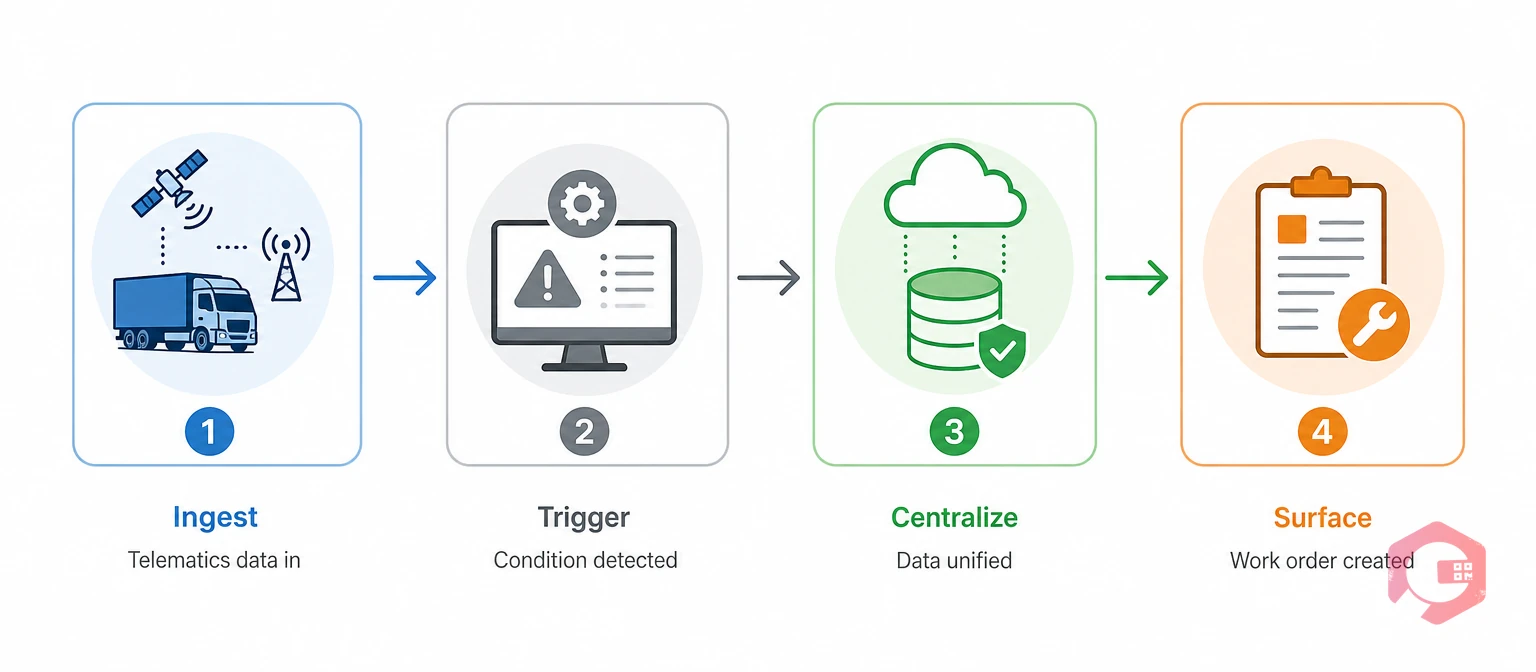
The Four-Layer OEM Telematics Stack:
Telematics data usually reaches a CMMS through SCADA systems, PLCs, edge devices, or a direct API feed. It travels over wired links like Modbus and OPC UA, or wirelessly through MQTT. Cryotos's IoT meter reading module is built to take in exactly this kind of feed. It maps hour meters, fault events, and battery data to the right asset record in real time.
Once the data lands, threshold rules decide what happens next. A warning-level fault might just log an event and notify a supervisor. A critical threshold — a coolant temperature spike, or an hour meter crossing its service interval — auto-generates a work order and assigns it to the nearest qualified technician.
The asset record holds the full picture. Purchase history, past repairs, and now live telematics data all sit in one place. When equipment moves between sites or routes, that history travels with the asset. It doesn't stay behind in someone's notebook.
Dashboards and mobile alerts turn the trigger into visible action. A push notification reaches a technician's phone. A manager sees an updated fleet health view. A running record of MTTR and downtime trends feeds the next planning cycle.
See how much unplanned downtime is actually costing your operation with Cryotos's unplanned downtime calculator.
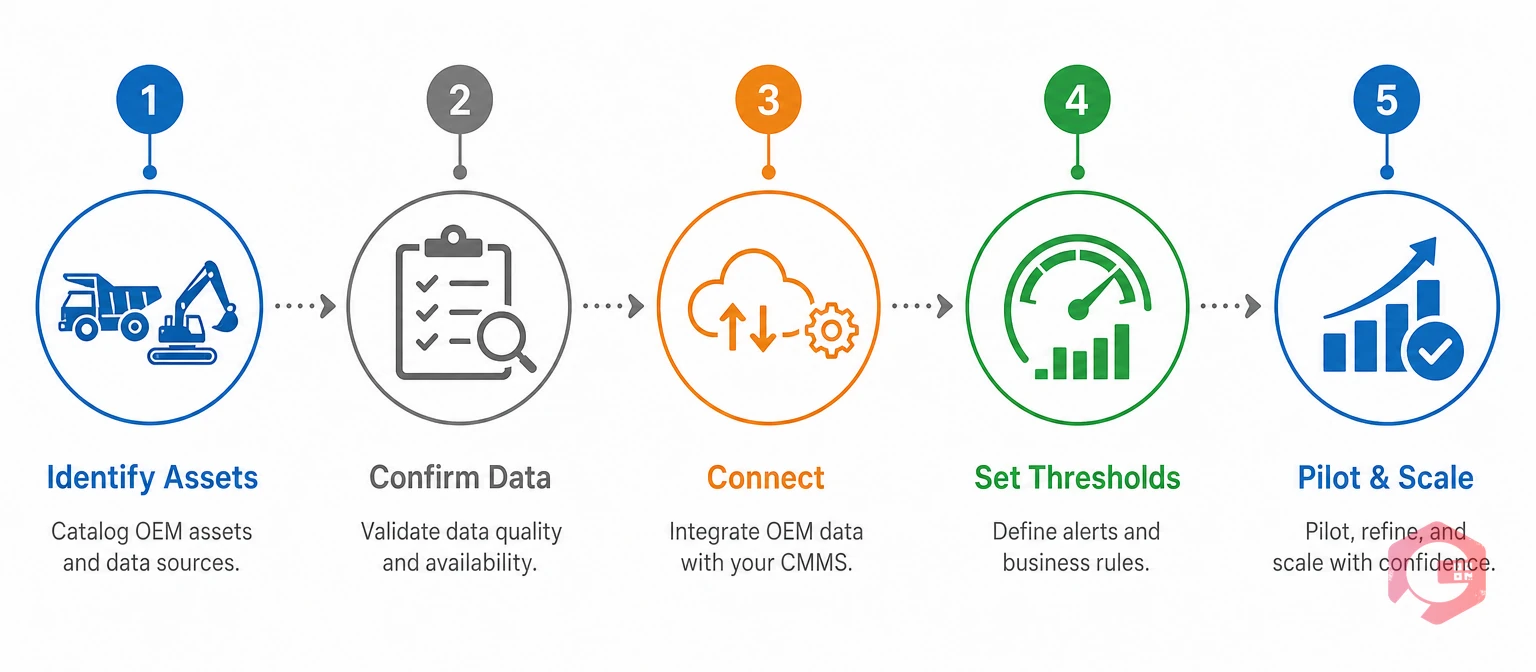
Connecting OEM telematics data to a CMMS follows a repeatable sequence. It works whether you manage ten delivery vans or two hundred pieces of heavy equipment.
Start with the assets where an unplanned failure costs the most — in downtime, safety risk, or missed client commitments. These become your pilot group. Don't try to connect an entire fleet on day one.
Most factory telematics systems already track engine hours, fault codes, and location data. The U.S. Department of Energy's fleet telematics guide lists the data points these systems tend to offer. Check what you already have before you buy new gear.
Decide whether the feed will route through an existing SCADA system, an edge gateway, or a direct API connection. Verify your CMMS receives clean, consistent data before you configure any automation rules on top of it.
Set warning and critical thresholds for each monitored value, based on manufacturer specs and your own failure history. This is where condition monitoring turns raw numbers into a real maintenance decision.
Run the connected assets for 30 to 60 days. Confirm alerts fire correctly and work orders reach the right technician. Then extend the same setup to the rest of the fleet or facility.
Reactive maintenance and telematics-triggered maintenance differ in one key way. It's how fast a problem moves from detected to fixed.
| Dimension | Reactive Maintenance | Telematics-Triggered Maintenance |
|---|---|---|
| Service scheduling | Calendar-based; ignores actual usage | Meter-triggered at the correct hour interval |
| Fault detection | Reported after a breakdown or visible problem | Flagged the moment a threshold is crossed |
| Response time | Hours to days, via phone call or verbal report | Automatic work order plus mobile alert |
| Fleet-wide visibility | Site or vehicle level only | Dashboard view across every connected asset |
| Audit and compliance records | Assembled by hand before an audit | Retrievable per asset in seconds |
The gap between these two columns is exactly what a downtime tracking module is built to close. It connects the fault to the fix and records how long that gap actually lasted.
It helps to be direct about the current limits here. Vendor claims in this space often overstate what's actually connected behind the scenes.
A named OEM connector is a ready-made link between a CMMS and one manufacturer's own telematics portal, with no extra setup in between. Most maintenance platforms, Cryotos included, don't offer this yet. Instead, they connect one layer down from the OEM's branded portal, at the protocol and data layer.
In practice, this means a CMMS can usually take in data if an OEM system exposes it through an API, SCADA feed, or edge gateway. A one-click link to a specific OEM's own portal is usually not what's really on offer. That's true no matter how the feature gets marketed. Buyers comparing vendors should ask a simple question: is this a named connector, or a protocol-level feed that still needs a gateway in between? The answer changes how much setup work your team should expect.
Maintenance teams using Cryotos have reported up to a 30% cut in unplanned downtime. They also report 25% faster repairs after connecting meter and telematics data into the platform. Technicians show up with sensor history, asset records, and the right parts already loaded. They no longer have to diagnose the problem from scratch while standing in front of the machine.
Most facilities and fleets that make this shift see a similar pattern. The first 30 to 60 days bring more alerts than expected. Then emergency callouts drop fast once the thresholds get tuned. A BI dashboard view across every connected asset makes that tuning process easy to see, instead of a guessing game.
This pattern holds well beyond road fleets, too. Teams that track meter-based triggers alongside reliability-centered maintenance ideas tend to see fewer surprise failures over time. The data feeding the program gets steadier the longer it runs.
OEM telematics integration connects the diagnostic data a manufacturer's factory-installed system already generates — engine hours, fault codes, GPS location, and battery state — straight into a maintenance platform. That connection lets the system create work orders on its own. The data no longer sits unused in a separate dashboard.
A CMMS compares incoming telematics readings against pre-set thresholds. When a reading crosses a warning or critical line, such as an hour meter hitting its service interval or a fault code flagging a serious issue, the system creates a work order automatically. It assigns the job to a technician and updates the asset's health record at the same time.
Cryotos connects at the protocol and data layer through its IoT meter reading module. It takes in feeds through SCADA, PLC, edge devices, or API, using standards like Modbus, OPC UA, and MQTT. It does not yet offer a named, ready-made link to one specific OEM's own telematics portal.
Most CMMS platforms receive telematics data through wired protocols like Modbus and OPC UA, or wirelessly through MQTT. An edge computing device often filters raw sensor data down to significant events before sending it to the cloud. Any sensor or system that communicates through these standards, or pushes data via API, is generally compatible.
Cost depends on your fleet or facility size and how much middleware sits between the OEM's system and the CMMS. A focused pilot on 5 to 10 critical assets is the standard way to validate the setup before you commit to a full rollout. That approach limits upfront cost while still proving out the ROI.
Turning OEM telematics data into action shouldn't require a data science team or a rebuilt maintenance program from scratch. Schedule a free demo to see how Cryotos connects your existing telematics feeds to real, trackable maintenance work.




Cryotos AI predicts failures, automates work orders, and simplifies maintenance—before problems slow you down.



