

Your planned vs. unplanned maintenance ratio shows what share of your maintenance work is scheduled ahead of time versus triggered by a surprise breakdown. Most reliability programs chase an 80/20 split. That's 80% planned, 20% unplanned. It's a decent starting point. But it hides a lot of real-world variation. A hospital sterilizer, a food-plant chiller, and a fleet of drilling rigs don't carry the same risk. So a "healthy" ratio looks different for each one.
Key Takeaways
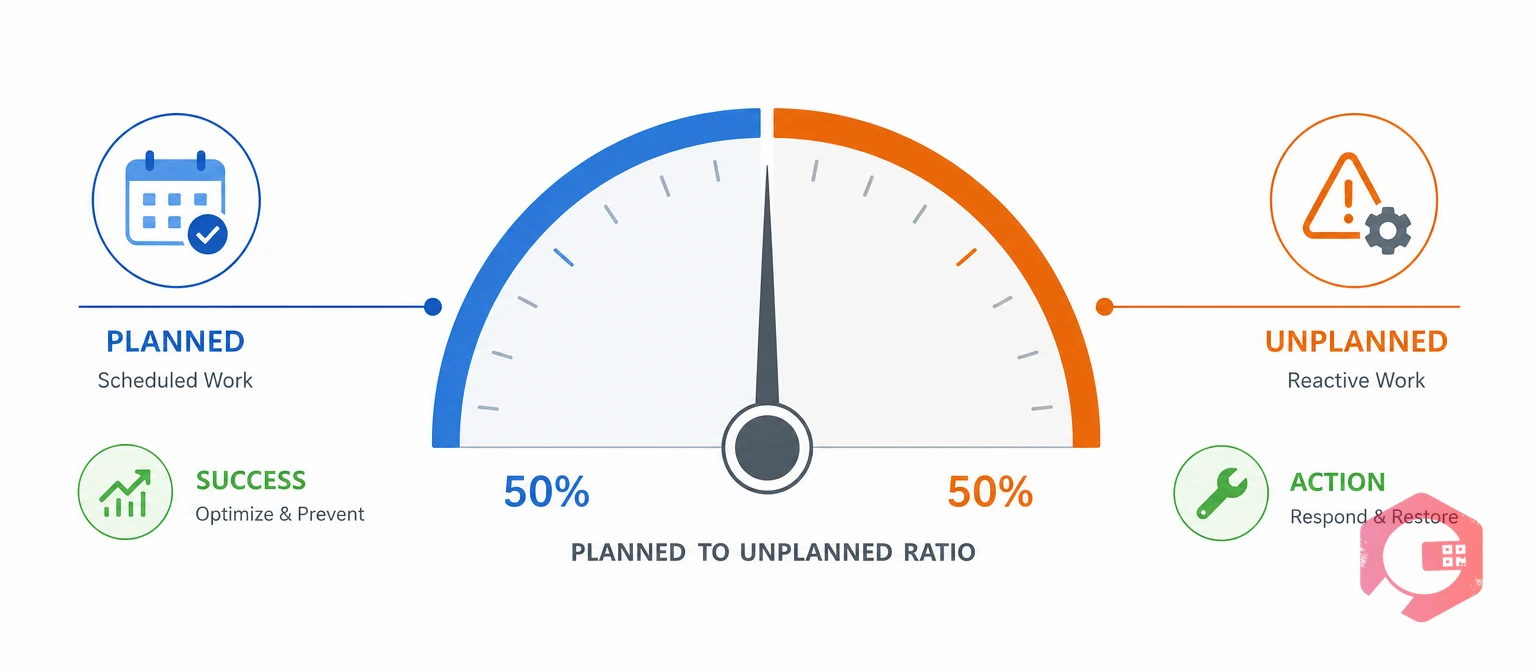
The planned-to-unplanned maintenance ratio is the split between maintenance work you scheduled ahead of time and maintenance work triggered by an unexpected failure. Teams usually write it as a percentage pair, like "75/25." The first number is planned work. The second is reactive or unplanned work.
Most teams track this using labor hours or completed work orders. A planned work order has a scope, parts, and a technician lined up before the asset needs attention. An unplanned maintenance job starts the moment something breaks. There's no time to prep parts or plan labor around it.
Most teams that hold a strong ratio review it every month. They break it out by asset class. A single plant-wide average can hide one struggling line inside an otherwise healthy plant.
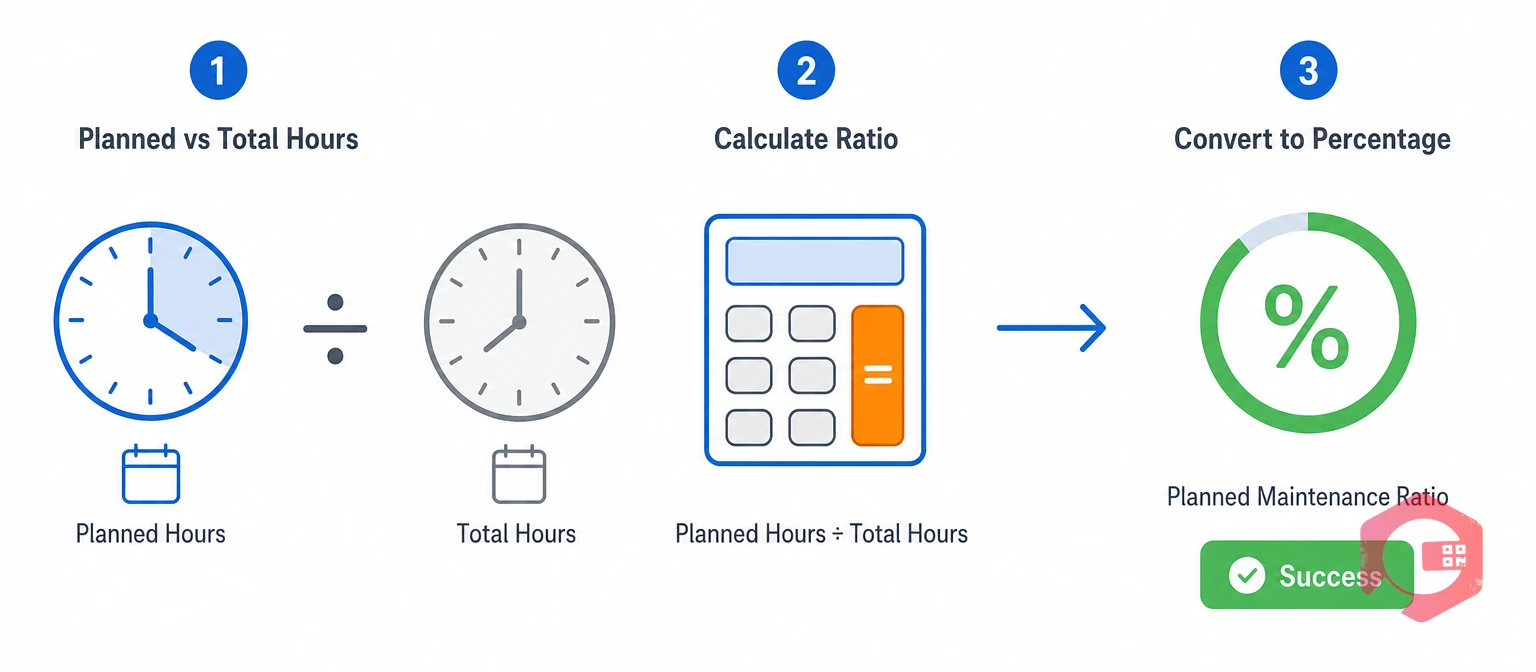
You calculate this ratio by dividing planned maintenance hours by total maintenance hours. Then you do the same for unplanned work. The two percentages should add up to 100%.
Planned % = (Planned Maintenance Hours ÷ Total Maintenance Hours) × 100
Unplanned % = (Unplanned Maintenance Hours ÷ Total Maintenance Hours) × 100
Picture a mid-size manufacturing plant. It logs 800 total maintenance hours in a month. Of those, 600 hours went to scheduled preventive maintenance software work orders. The other 200 hours went to emergency repairs.
That plant runs a 75/25 ratio. It's close to the common 80/20 target, but not quite there. A single month is just a snapshot. Teams that manage this metric well track it as a rolling 3- or 6-month average. One bad week from a single failure can swing a monthly number without pointing to a real trend.
Work orders can substitute for hours if your Computerized Maintenance Management System doesn't track time closely. But hours give you a more accurate picture. A single reactive job often runs far longer than a routine planned task.
Hours give you a cost-weighted view. A reactive breakdown that takes eight hours to fix should carry more weight than a five-minute filter swap. Hours capture that difference on their own.
Work order counts are simpler to pull. They work well for a quick weekly check on trend direction. Most teams that report to leadership use hours for the official number and counts for a fast internal check.
| Input | Planned Maintenance | Unplanned Maintenance |
|---|---|---|
| Trigger | Calendar, meter, or condition-based schedule | Failure, alarm, or breakdown |
| Lead time | Days to weeks | None to a few hours |
| Typical cost multiplier | 1x (baseline) | 3x to 5x |
Next, let's look at how planned and unplanned work differ once you're past the math.
Planned maintenance is scheduled before an asset fails. Unplanned maintenance happens after it already has. That one split drives almost every other gap between the two: cost, safety, parts, and how much control your team has over the outcome.
| Factor | Planned Maintenance | Unplanned Maintenance |
|---|---|---|
| Timing | Set by a schedule or condition trigger | Set by the failure itself |
| Parts | Ordered and staged ahead of time | Sourced under pressure, often at a premium |
| Labor | Assigned during normal shifts | Often overtime or emergency callout |
| Risk level | Lower — work is isolated on a controlled timeline | Higher — troubleshooting happens under time pressure |
| Typical driver | Preventive maintenance software or condition monitoring | A sudden failure or missed warning sign |
Neither type disappears in a mature program. A small share of corrective maintenance is normal. Not every failure is worth the cost of preventing. The goal isn't zero unplanned work. It's keeping that share small enough that it doesn't run your schedule for you.
Think of planned maintenance as an oil change you booked for next Tuesday. You know the cost, the parts, and how long it takes. Unplanned maintenance is your car breaking down on the highway instead. Same basic job. Wildly different cost and stress level. That analogy tends to land well with finance and operations leaders who don't work in maintenance every day.
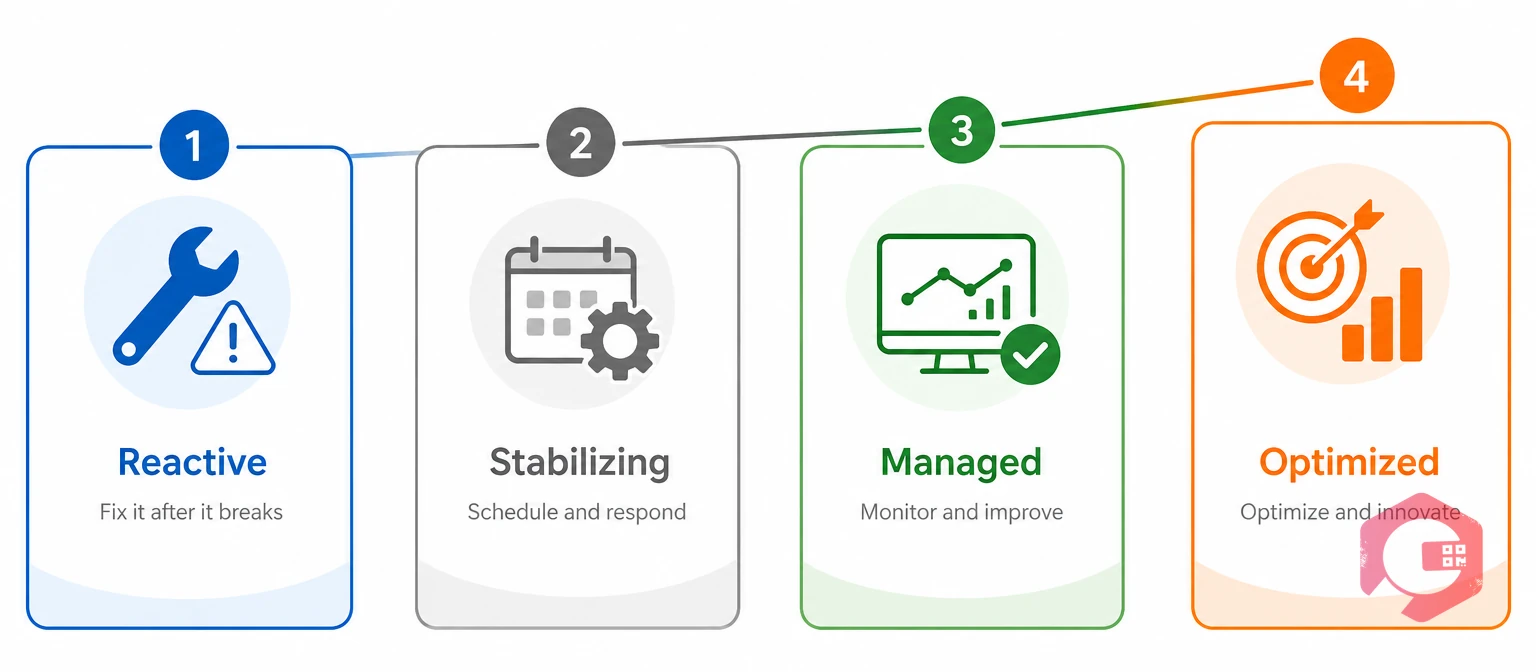
A healthy planned-to-unplanned maintenance ratio usually falls between 80/20 and 90/10. But the right number depends on your industry's failure consequences and asset criticality. A single target treats a bottling line the same as an MRI machine. That doesn't hold up in the real world.
The Four-Tier Maintenance Ratio Health Scale:
This is where the ratio needs to flex by sector. A Tier 3 result is a strong outcome for general manufacturing. But that same number in a pharmaceutical cleanroom or a power plant would be a gap worth closing. Reliability programs built around reliability-centered maintenance push high-criticality assets toward Tier 4. Lower-consequence equipment can stay at Tier 3.
For a related look at this same trade-off from an asset-type angle, see our breakdown of the ideal preventive-to-reactive maintenance ratio. That piece looks at maintenance strategy mix. This one looks at what's realistic sector by sector.
Most plants that haven't invested heavily in reliability programs sit somewhere in Tier 2. That's closer to a 60/40 or 65/35 split than most teams would like to admit. That's not a failure. It's a normal starting point. The tier scale gives you a way to track progress, instead of comparing yourself to one "perfect" number.
Healthy maintenance ratio benchmarks range from roughly 70/30 in general manufacturing up to 90/10 or higher in healthcare, pharma, and power generation, where failure consequences are most severe. The table below gives you a starting target by sector. Adjust it up or down based on your own mix of asset criticality.
| Industry | Target Planned Ratio | Health Tier | Why This Range |
|---|---|---|---|
| General Manufacturing | 75-85% | Managed | Mixed criticality; some redundant lines tolerate reactive work |
| Food & Beverage | 80-90% | Managed to Optimized | Sanitation windows and shelf-life pressure limit downtime |
| Healthcare Facilities | 90%+ | Optimized | Life-safety equipment; failures affect patient safety |
| Oil & Gas / Drilling | 80-90% | Optimized | Remote assets, long parts lead times, high downtime cost |
| Power Generation | 90%+ | Optimized | Grid reliability rules and compliance windows |
| Hotels & Facilities | 70-80% | Managed | Guest-facing, but lower safety consequence per failure |
The Society for Maintenance & Reliability Professionals (SMRP) publishes broader benchmarking work that backs up this same pattern. Industries with higher failure consequences report tighter planned-maintenance targets than industries with more forgiving downtime economics.
The ISO 55000 asset management standard takes a similar view. It treats maintenance strategy as a risk-based choice tied to what an asset actually does for the business. It isn't a one-size-fits-all rule. That's the same logic behind the tier scale above: a critical asset earns a tighter ratio target, and a low-risk one doesn't need to chase the same number.
Use Cryotos's unplanned downtime calculator to see what closing even a 10-point gap in your ratio could be worth in avoided downtime hours.
Your planned-to-unplanned ratio doesn't sit on its own. It moves alongside a few other core reliability numbers. Reading them together tells you far more than any single metric can on its own.
A rising planned-maintenance ratio usually pushes MTBF up too. Fewer assets are failing without warning between scheduled services. If your ratio is improving but MTBF isn't moving, your PM tasks may not be targeting the failure modes that actually matter.
Planned repairs tend to have a shorter, more predictable MTTR. Parts and labor are staged ahead of time. A high unplanned share almost always drags your average MTTR up, since reactive jobs involve more diagnosis time and part delays.
Unplanned downtime is one of the three core losses that lower OEE, alongside speed loss and quality loss. Tightening your planned-to-unplanned ratio is one of the most direct levers you have for improving the availability piece of that formula.
Most teams that improve one of these metrics see the others follow within a few months. They're all downstream of the same root cause: how much of your work is planned versus reactive.
A ratio drifts toward unplanned work when scheduled PMs get skipped, deferred, or written too loosely to catch real failure modes before they happen. This is rarely one dramatic cause. It's usually a handful of small gaps that pile up over months.
Most facilities that reverse this drift start by auditing their downtime tracking data before touching anything else. A low PM compliance rate almost always explains a weak ratio better than any single equipment issue does.
Even teams that measure this ratio often can still draw the wrong conclusions from it, if they're not careful about what's actually being counted.
The Occupational Safety and Health Administration (OSHA) has flagged inconsistent recordkeeping as a common factor behind maintenance-related incidents. A clean, consistent ratio calculation isn't just a reporting nicety. It's part of a safer program.
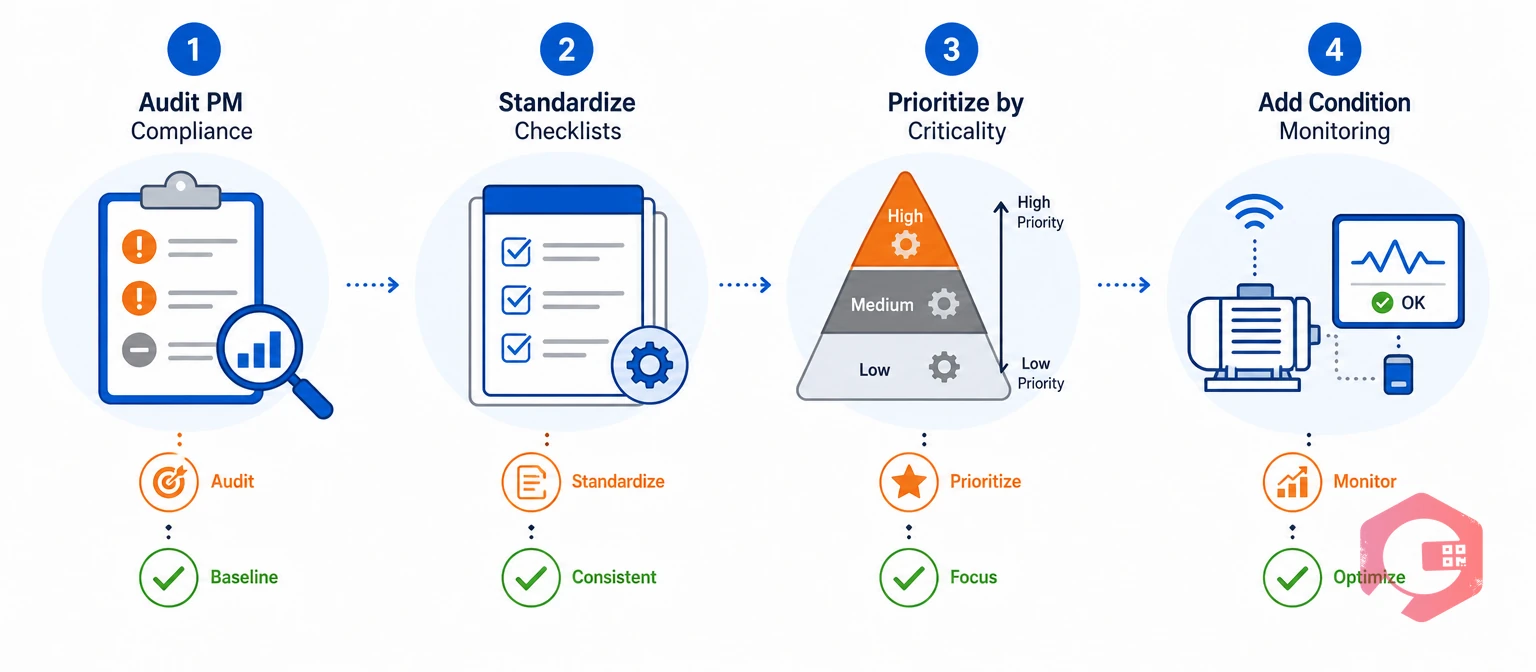
You improve your planned maintenance ratio by closing PM compliance gaps first, then adding condition-based triggers to catch the failures your calendar schedule misses. This order matters. Adding more sensors before your basic PM program is reliable just adds more data to a process that's already behind.
Maintenance teams using Cryotos have reported up to 30% reduction in unplanned downtime and 25% faster repair turnaround after using this kind of structured, criticality-based approach. Most of that gain came from PM compliance improvements alone, before any sensor spend.
A modern preventive maintenance software platform makes this sequence far easier to run day to day. It tracks compliance on its own, instead of relying on a spreadsheet someone has to remember to update.
Don't aim to jump from Tier 2 straight to Tier 4 in one quarter. Most successful programs target a single tier improvement every 90 days instead. That pace gives technicians time to build new habits around checklists and scheduling. It also avoids burning the team out chasing an unrealistic overnight fix.
Leadership teams respond best to this metric when it's tied to a dollar figure, not just a percentage. Pair your current ratio with an estimated cost-per-point of unplanned work, using your average reactive repair cost and your total maintenance hours. A 10-point ratio gap suddenly reads very differently as "$180,000 a year in avoidable repair cost" than it does as a bare number on a slide.
It also helps to show the trend line, not just the current snapshot. A ratio that moved from 65/35 to 78/22 over two quarters tells a much stronger story than a single 78/22 data point on its own, since it proves the program is actually working rather than just having a lucky month.
If you're asking for budget to fix a weak ratio, tie the request directly to a specific, named gap you found in your audit, rather than a general call for "better maintenance software." A request built around "we're losing 40 hours a month to PM backlog on our top three lines" is far easier for a finance team to approve than a vague pitch about efficiency, because it comes with a number they can check later.
A strong planned-to-unplanned ratio is a good sign, but it isn't the full picture. Two plants can post the exact same 85/15 split and be in very different shape underneath that number.
A high planned ratio built on cheap, low-value PM tasks can still coexist with a handful of expensive, poorly maintained critical assets. If you only watch the plant-wide ratio, those problem assets can hide in plain sight behind a healthy-looking average.
A completed planned work order isn't automatically a good one. A rushed PM that skips half its checklist steps still counts as "planned" in most CMMS reports, even though it may not actually prevent the failure it was designed to catch.
A plant can maintain a decent ratio for months while its PM backlog quietly grows, simply by classifying overdue-but-eventually-completed tasks as planned work. Pair this ratio with a backlog-age report to catch that pattern early, before it shows up as a sudden drop in your monthly number.
None of this means the ratio isn't useful. It means it works best alongside PM compliance rate, backlog age, and cost-per-asset data, not as a single number reported in isolation.
Every plant starts this journey from a different point. A roadmap built for a Tier 1 operation looks nothing like one built for a Tier 3 operation trying to reach Tier 4. Here's a general path most teams follow, broken out by starting tier.
Most maintenance teams that successfully move up a tier don't do it by working harder across the board. They do it by focusing effort on the specific assets and checklist gaps that are dragging their number down, one tier at a time.
A good starting target is 80% planned to 20% unplanned for most general industrial operations. Safety-critical sectors like healthcare and power generation should aim higher, often 90% or more.
Most maintenance teams recalculate this monthly and review it as a rolling 3- to 6-month average. A single bad month can distort the trend without reflecting a real program problem.
Not necessarily. A small share of unplanned work is normal even in mature programs, since not every failure is worth preventing. A ratio near 100% can sometimes mean you're over-maintaining low-risk assets, rather than covering the ones that matter most.
The most common cause is a growing PM backlog. Scheduled work orders get pushed back again and again, until the equipment fails before the deferred task ever gets done. Auditing your PM compliance rate is usually the fastest way to find the root cause.
Both matter. But a Computerized Maintenance Management System removes a lot of the manual tracking failure that causes PMs to slip in the first place. That's often the bigger lever, even ahead of adding headcount.
Yes, but with a lighter process. A small operation can track this monthly with a simple spreadsheet or a lightweight CMMS. It doesn't need the full asset-criticality tiering that a large multi-site plant would use.
PM compliance rate measures whether scheduled tasks got done on time. The planned-to-unplanned ratio measures the overall mix of your total maintenance workload. A team can have high PM compliance and still carry a weak ratio, if their PM schedule doesn't cover enough of their critical assets.
Most plants that stay disciplined about PM compliance see a one-tier improvement within 6 to 12 months. Moving from Tier 1 straight to Tier 4 in less time than that is rare, and usually means the underlying data isn't being tracked carefully.
Yes, for genuinely low-risk, low-cost assets where a run-to-failure strategy makes more financial sense than scheduled upkeep. The key is making that choice on purpose, asset by asset, rather than ending up there by default because PMs kept getting skipped.
Getting this ratio right isn't a one-time fix. It takes ongoing visibility into compliance, downtime, and asset criticality. Schedule a free demo to see how Cryotos helps maintenance teams track their planned-to-unplanned ratio automatically and close the gaps that are dragging it down.



Cryotos AI predicts failures, automates work orders, and simplifies maintenance—before problems slow you down.



