

The ideal preventive-to-reactive maintenance ratio is roughly 80% preventive work to 20% reactive work, expressed as an 80/20 split or a 4:1 ratio. World-class facilities in asset-intensive industries push this further, toward 90% preventive and 10% reactive. Most facilities that never build a structured maintenance program run the opposite split, closer to 30% planned and 70% reactive, which drives up repair costs, overtime, and unplanned downtime.
Key Takeaways
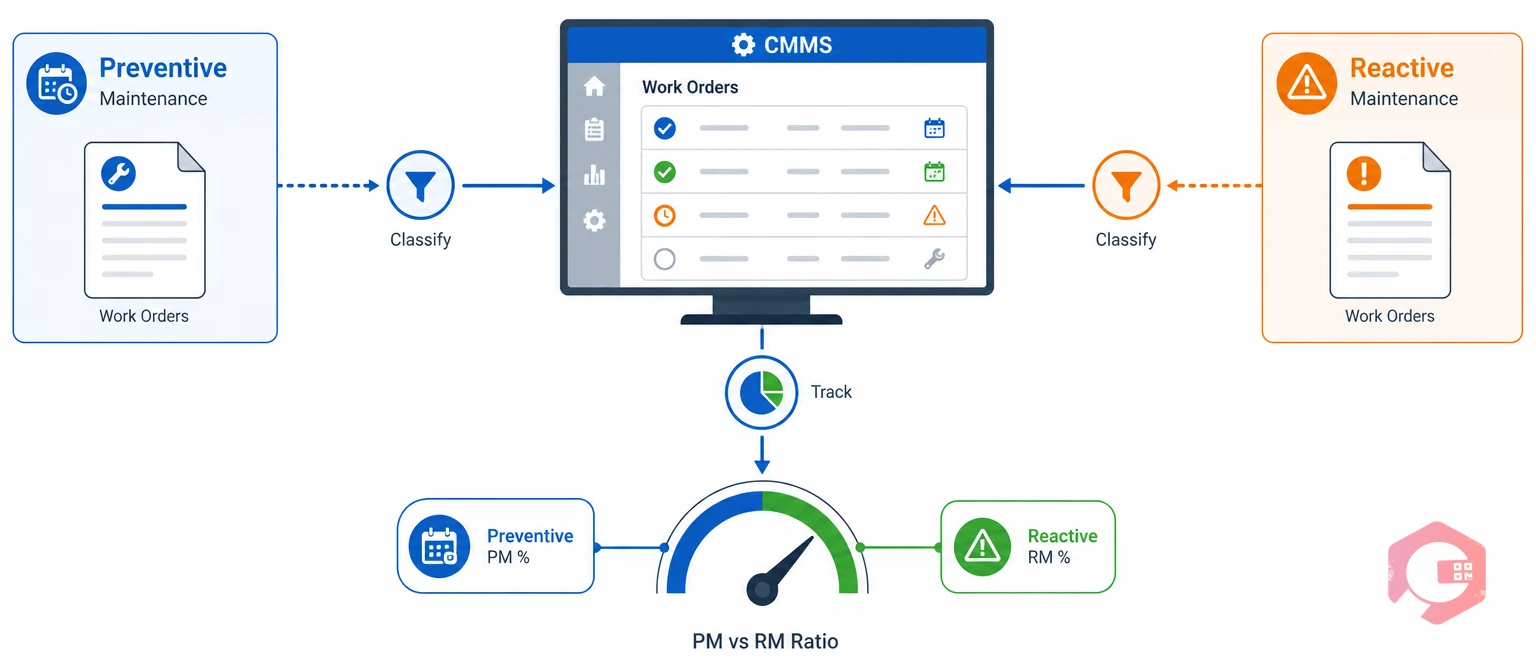
The preventive-to-reactive maintenance ratio measures how much of a maintenance team's work is planned in advance versus how much responds to unplanned breakdowns. Teams usually express it as a percentage split, such as 80% preventive and 20% reactive, or as a simple ratio like 4:1. It's one of the clearest single indicators of whether a maintenance program runs proactively or spends its days firefighting.
Preventive maintenance is scheduled work performed on a fixed interval or usage trigger to prevent failure before it happens. Reactive maintenance, by contrast, is unplanned work triggered after a failure or fault has already occurred. A work order raised from a PM calendar counts as preventive; a work order raised from a breakdown call counts as reactive.
Most maintenance teams don't struggle to define the two categories — they struggle to measure them consistently. A manager estimating the split from memory at month-end almost always overstates the preventive share, because reactive work tends to blur into "urgent PM" language after the fact. A Computerized Maintenance Management System (CMMS) solves this by tagging every work order as preventive, corrective, or reactive the moment it's created, rather than relying on a manager's after-the-fact judgment.
That distinction matters because the ratio is only useful if it reflects reality. A number built from clean, consistent classification data supports real decisions about staffing and PM frequency; a number built from guesswork just confirms whatever the manager already believed going in.
A high reactive share does more than raise repair costs — it compounds across nearly every part of a maintenance operation. Unplanned failures happen without warning instead of during a controlled shutdown, which pushes up overtime, expedited parts spend, and safety risk all at once.
A high preventive share, done well, stabilizes production schedules and turns maintenance spend into a predictable budget line instead of a stream of emergencies. That predictability is exactly what the Society for Maintenance and Reliability Professionals points to when it treats planned-versus-unplanned work as a core reliability benchmark — the split doesn't just describe past performance, it forecasts future cost.
For maintenance managers, the ratio isn't a vanity metric. It's the number that tells leadership whether the maintenance function controls its asset base or gets controlled by it, and it's the number most often used to justify — or challenge — headcount, CMMS investment, and reliability programs.
Documented ratio improvement, backed by cost data comparing preventive spend to avoided reactive cost, is one of the strongest evidence bases a maintenance manager can bring into a capital planning meeting. Facilities operating under formal asset management standards, such as the ISO 55000 asset management standard, treat this kind of documented, evidence-based maintenance program as the expectation rather than the exception.
There's no single universal target for every facility. Many reliability programs cite roughly 80% preventive and 20% reactive as an aspirational benchmark, while world-class facilities in asset-intensive industries push toward 90% preventive and 10% reactive.
A food processing line running under strict regulatory pressure needs a tighter preventive target than a low-consequence utility asset in a warehouse. Older equipment nearing end-of-life often runs a higher reactive share almost by design, since it no longer responds predictably to fixed PM intervals.
Maintenance teams that chase a generic 80/20 number without adjusting for their own equipment mix often end up either over-servicing low-risk assets or under-protecting the ones that actually drive downtime cost. Setting a realistic, asset-class-specific target — rather than copying a number from a textbook — is what turns the ratio into a useful planning tool instead of a scoreboard nobody trusts.
See where a specific asset class stands today using Cryotos's MTBF calculator before setting a target ratio for it.
Industry context changes what "good" looks like. The table below lines up typical current performance against realistic and world-class targets across common asset-intensive sectors.
| Industry | Typical Reactive Share Today | Realistic Target Ratio | World-Class Benchmark |
|---|---|---|---|
| Manufacturing | 40-60% | 80/20 | 90/10 |
| Food and beverage | 30-50% | 85/15 | 92/8 |
| Oil and gas | 35-55% | 80/20 | 90/10 |
| Healthcare facilities | 25-40% | 85/15 | 93/7 |
| Facilities and property management | 45-65% | 75/25 | 85/15 |
These figures are directional starting points, not fixed rules — a facility running older equipment or a leaner maintenance team should expect a more gradual climb toward the world-class end of its range.
The distance between a facility's current reactive share and its realistic target matters more than the absolute number itself. A manufacturing plant sitting at 55% reactive has a longer road than one sitting at 42%, even though both fall inside the same "typical today" range, and that distance should shape how aggressive the improvement plan needs to be.
Facilities in regulated sectors — food and beverage, healthcare — tend to move faster toward their target once accurate classification is in place, largely because compliance pressure already forces disciplined documentation of every work order. Facilities and property management portfolios often move slower, since asset diversity across a large property mix makes a single fleet-wide PM interval harder to standardize.
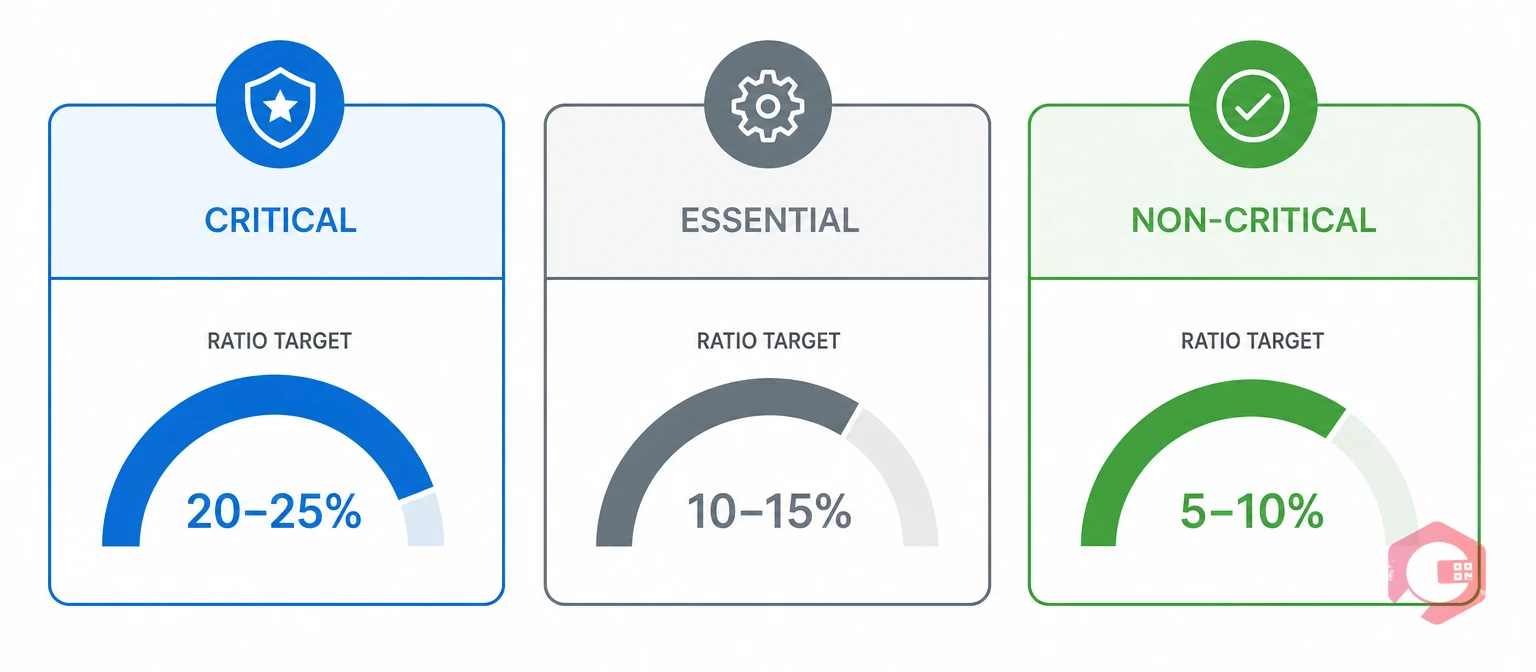
The 3-Tier Criticality Ratio Framework gives maintenance teams a way to set different ratio targets by asset importance instead of applying one number across an entire fleet:
Not every asset should carry the same ratio target. Tagging assets by criticality and setting a different ideal ratio for each tier means a bottleneck production line gets held to a stricter preventive target than a low-impact utility asset — instead of every asset competing for the same fixed PM budget.
This tiered approach also protects PM budget from getting spread evenly across assets that don't deserve equal attention. A facility with limited technician hours gets more value assigning extra preventive coverage to its critical tier first, then extending that discipline outward to essential and non-critical assets as capacity allows.
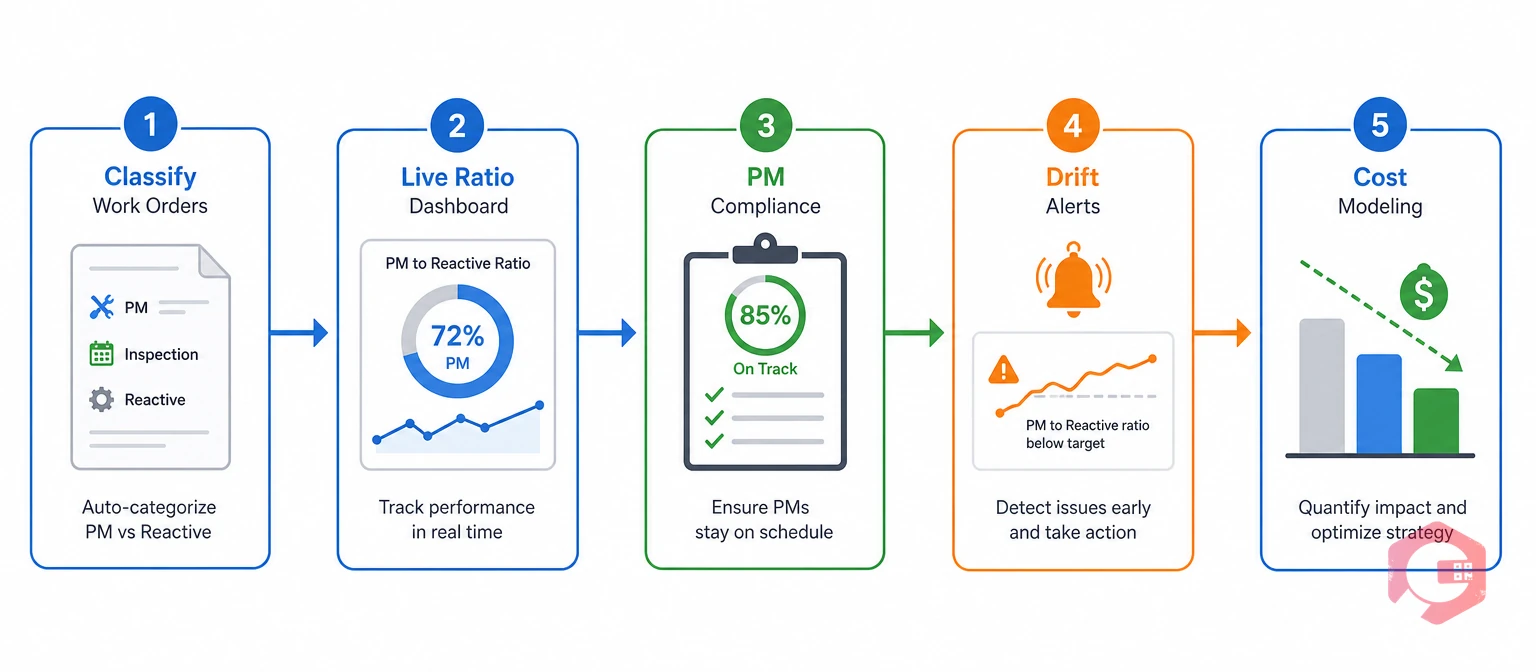
Improving the ratio starts with measuring it accurately, then using that data to drive specific scheduling and staffing decisions.
Every work order should get tagged as preventive, corrective, or emergency/reactive at the point of creation — whether it came from a PM schedule, an inspection finding, or an incident report. Classification that happens automatically, rather than being assigned after the fact, means the ratio gets calculated from clean data instead of a manager's best guess at month-end.
A ratio that only gets reviewed once a month is already stale by the time anyone sees it. A live dashboard — broken down by site, asset class, and team — shows the current split, the trend over the last 3, 6, and 12 months, and how far a team sits from its target, without waiting for someone to assemble a report.
The ratio only improves when preventive work actually gets completed on schedule. Tracking PM compliance — the percentage of scheduled preventive tasks finished on time — alongside the ratio itself shows whether a slipping number comes from rising breakdowns or from PMs that are being deferred or skipped.
Every reactive work order should trace back to the incident, near-miss, or fault report that triggered it. That linkage shows not just how much reactive work is happening, but why — which failure modes, which assets, and which root causes drive the reactive share of the ratio.
Automated alerts that fire when the reactive share for a site or asset class rises above a defined threshold let managers intervene early — adjusting PM frequency, reallocating technicians, or investigating a recurring failure — before a small drift becomes a real trend. Facilities running a modern preventive maintenance software platform can build this kind of alerting directly into PM scheduling instead of relying on someone noticing the drift manually.
Rolling up labor hours, parts, and contractor costs by work order type shows the true cost gap between a planned PM task and the emergency repair it would have prevented. That gap is usually the single most persuasive number in the entire ratio conversation, because it turns an abstract target into a line-item budget decision.
A pump seal replaced on a routine PM might cost a few hundred dollars in parts and an hour of labor. The same seal failing in service can trigger a production stoppage, an expedited parts order, and overtime labor — easily ten times the planned cost once lost output gets factored in. Tracking that gap by asset class shows exactly where a shift toward preventive work pays for itself fastest.
Once the ratio is tracked accurately, it stops being a lagging statistic and becomes an input to ongoing decisions about scheduling, staffing, and spending.
When ratio and failure data show reactive work concentrated on specific assets, that pattern usually points to a PM interval that's too long, too short, or targeting the wrong failure mode entirely. Ratio analysis turns directly into a PM schedule adjustment instead of a guess about which interval to change.
A stable, preventive-heavy ratio lets managers plan technician workload and shift coverage weeks in advance. Seeing how much technician capacity currently goes to reactive firefighting informs real decisions about headcount, contractor use, and shift structure — rather than reacting to whichever crisis happened last week.
Every reactive work order that traces back to a specific asset and root cause builds the case for a capital replacement, a redesigned PM interval, or additional planned downtime for that asset class. A documented, improving ratio gives that conversation a data trail instead of an anecdote.
Mean Time Between Failures (MTBF) and Mean Time to Repair (MTTR) are the two metrics that show whether an improving ratio is actually translating into better reliability, not just better paperwork. As the preventive share rises, MTBF should climb and MTTR should fall — that correlation is the evidence base for continued investment in preventive maintenance.
A rising preventive share that doesn't move MTBF at all is a signal worth investigating on its own. It often means the added PM work is targeting the wrong failure modes, or that downtime tracking isn't capturing the full picture of what's actually failing and why.
Maintenance teams using Cryotos have reported up to 30% reduction in unplanned downtime and 25% faster repair turnaround as ratio, MTBF, and MTTR data start feeding directly into scheduling decisions instead of sitting in separate spreadsheets.
AI-powered ratio analytics let a maintenance manager ask a plain-English question and get an instant, chart-based answer instead of building a custom report. Questions like "What is our preventive-to-reactive ratio this quarter compared to last quarter?" or "Which sites are furthest from their target ratio?" get answered without exporting data to a spreadsheet first.
That speed matters most in the moments when a manager needs an answer during a budget meeting or a shift handover, not three days later once someone has time to build a report. A dashboard that already holds classified work order data, PM compliance history, and cost rollups can answer these questions the moment they're asked, because the underlying data was already structured correctly at the point of entry.
Comparing a team's ratio against commonly cited industry benchmarks — such as the 80/20 target referenced across reliability literature — gives managers an external reference point rather than judging performance in isolation. A ratio that looks strong in isolation can still lag behind what similar facilities in the same industry are achieving.
Because a well-built CMMS tracks the ratio continuously rather than as a periodic audit, teams can review the trend monthly, catch regressions early, and treat the ratio as a living KPI rather than an annual reliability report exercise.
Most facilities that sustain ratio improvement over multiple years run a short, consistent monthly review rather than a sprawling quarterly deep-dive:
A team that reviews these four points every month rarely gets surprised by a sudden reactive spike, because the early warning signs show up in the trend line weeks before they show up in a maintenance budget overrun.
Shifting a maintenance program from a reactive-heavy split toward an 80/20 or 90/10 target rarely happens through one policy announcement. A phased rollout keeps the change manageable and gives a team real data to act on before scaling it fleet-wide.
Pick one asset class — pumps, HVAC units, or conveyor motors, for example — and apply accurate classification and a live dashboard there first. This gives the team a manageable dataset to validate the tracking approach before rolling it out across the entire facility.
Decide which assets warrant the strictest ratio target before an 80/20 default becomes the standard everywhere. Retrofitting a tighter target onto a critical asset after a near-miss is a much harder conversation than setting the tier up front.
A team that starts optimizing the ratio before work orders are classified consistently ends up optimizing noise. Clean classification always comes first — the ratio itself only becomes trustworthy once every work order lands in the right bucket automatically.
Once the pilot asset class has run through at least one full PM cycle under the new tracking approach, review how the ratio, PM compliance, and reactive work order count moved together. That first dataset usually shows clearly whether the target ratio for that asset class was realistic or needs adjustment.
A few recurring mistakes show up across maintenance programs trying to improve their ratio, and most trace back to treating the number as a scoreboard rather than a diagnostic tool:
Reliability practitioners at Reliabilityweb consistently point to the same lesson across these mistakes: a ratio target only works if a team reviews it against real cost and failure data on a regular cadence, not as a number set once and left alone.
Most reliability programs treat 80% preventive and 20% reactive as the standard target, often expressed as a 4:1 ratio. World-class, asset-intensive facilities push further, toward 90% preventive and 10% reactive, though the right number depends on asset criticality and industry.
Divide the number of preventive work orders completed in a given period by the total number of work orders completed, then express reactive work orders as the remaining share. Accuracy depends entirely on how consistently work orders get classified at the point of creation.
A high reactive share increases unplanned downtime, drives up overtime and expedited parts spend, shortens asset life, and raises safety risk because failures happen without warning rather than during a controlled shutdown.
No. Critical assets that could stop production or create a safety hazard typically need a stricter target, often 90/10 or tighter, while non-critical assets can run a looser split without meaningfully increasing business risk.
Most facilities see measurable improvement within two to three PM cycles once accurate classification and a live dashboard are in place, though a full shift from a reactive-dominant culture to an 80/20 target often takes six to twelve months of consistent PM compliance.
Usually, yes, but only when the shift is tracked alongside MTBF, MTTR, and total cost data. A ratio that improves on paper without a corresponding drop in downtime or repair cost usually signals a classification problem rather than a real reliability gain.
At minimum, a system that classifies work orders by type at creation, calculates the split automatically, and displays the trend over time. Manual tracking in spreadsheets works for very small operations, but it breaks down quickly once a facility runs more than a few hundred work orders a month.
A 90/10 split is achievable for smaller facilities too, but it takes longer to reach without dedicated reliability staff. Most small and mid-sized operations see faster, more sustainable progress by targeting 80/20 first and treating 90/10 as a longer-term goal once PM compliance is consistently above 90%.
Tracking the preventive-to-reactive ratio isn't a one-time audit exercise — every work order, PM schedule, and incident report feeds a live number that shows exactly how proactive a maintenance program really is. Schedule a free demo to see how Cryotos gives your team the classification, dashboards, and criticality-based targets it takes to move that ratio toward the number your assets actually need.




Cryotos AI predicts failures, automates work orders, and simplifies maintenance—before problems slow you down.



