

Predictive maintenance ROI is the financial return a plant gets from fixing equipment before it fails, instead of after. You measure it as total savings minus program cost. Savings come from avoided downtime, lower labor costs, longer asset life, and leaner inventory. Most facilities underestimate predictive maintenance ROI. They price the sensors. They forget to price the reactive costs those sensors remove.
Independent research puts the typical return well above 100% in year one. A NIST-backed field study measured a 3.5:1 return when one plant moved from reactive to predictive maintenance. This guide covers the formula, a worked example, real benchmarks, and the steps for a business case that gets approved.
Key Takeaways
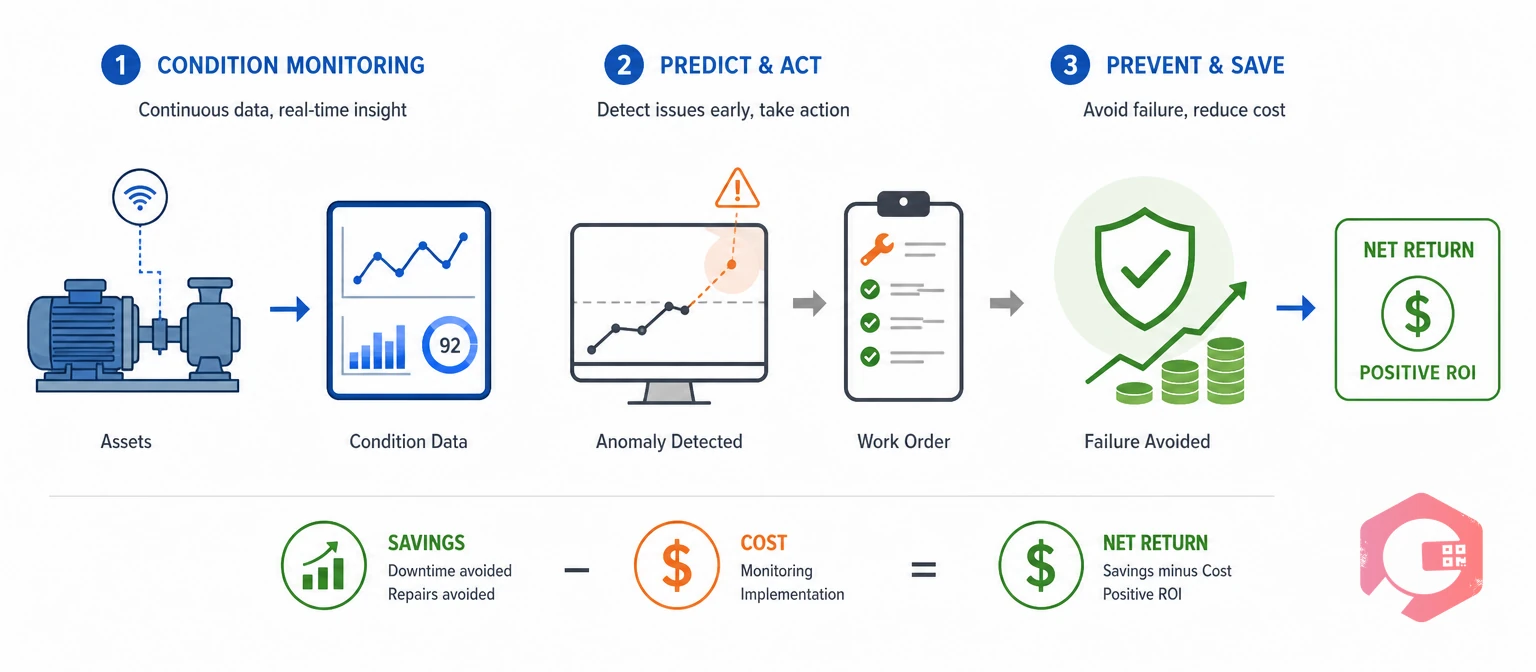
Predictive maintenance ROI is the net return a facility gets from using condition data, such as vibration or runtime hours, to catch failures before they happen. You calculate it as total savings minus total cost, shown as a percent.
The idea builds on predictive maintenance as a strategy. But the ROI number is what gets a project funded. It needs two things most teams skip. First, an honest baseline of today's reactive costs. Second, a fair model of what changes once condition data starts the work order.
Reactive maintenance is work triggered only after a failure happens, and it often costs 3 to 9 times more than the same repair done on a plan. That extra cost comes from four places.
Pull 12 months of work order, labor, and parts data first. That baseline is the number every savings claim below gets checked against.
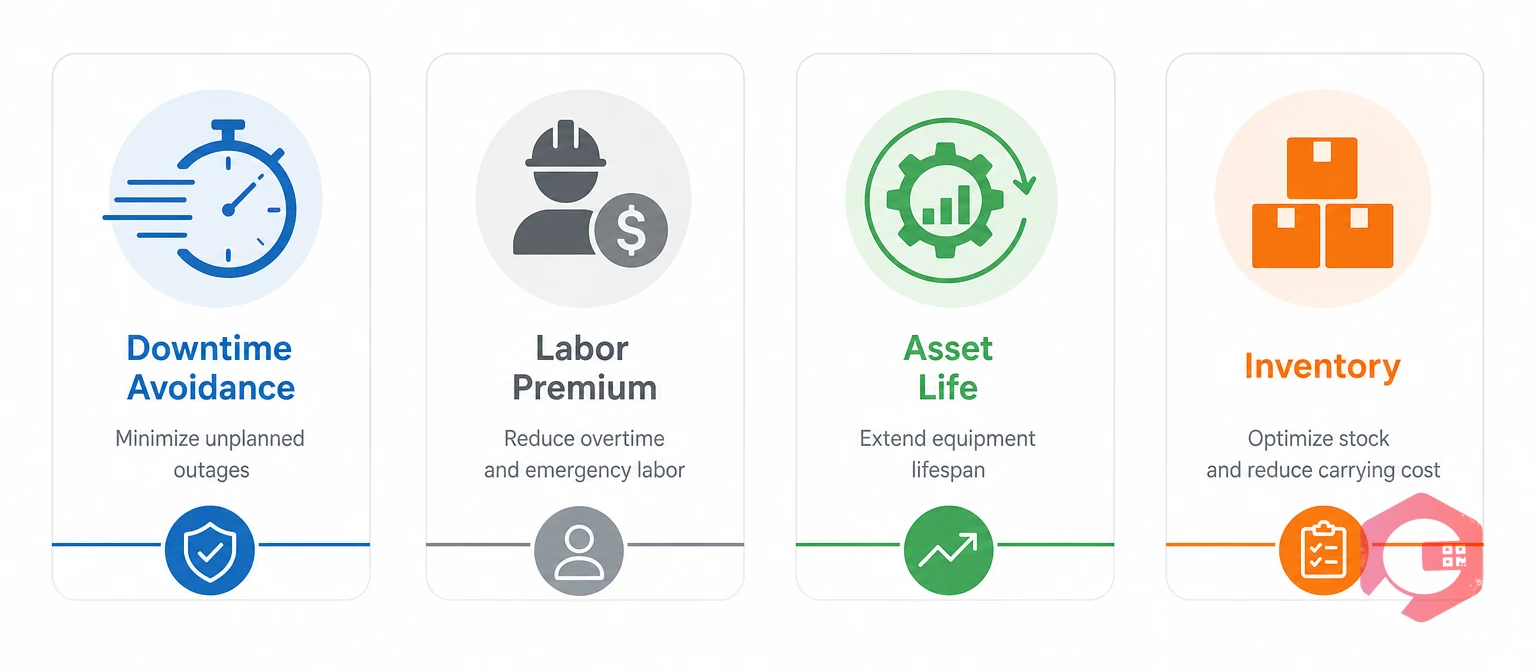
Every dollar of predictive maintenance savings comes from one of four levers. Naming them makes the business case easier to build and easier to defend.
The Four-Lever ROI Model:
Most vendor pitches only count the first lever. A strong internal case prices all four, even at a conservative estimate. Leadership will ask what happens beyond downtime.
The core formula: ROI (%) = [(Annual Savings) − (Annual Program Cost)] / (Annual Program Cost) × 100.
A worked example: a mid-size plant piloting predictive maintenance on its most critical assets.
| Line Item | Reactive Baseline | With Predictive Maintenance | Annual Savings |
|---|---|---|---|
| Unplanned downtime | 120 hrs, $2,160,000 | 42 hrs, $756,000 | $1,404,000 |
| Emergency labor premium | $310,000 | $95,000 | $215,000 |
| Rush parts and freight | $140,000 | $50,000 | $90,000 |
| Total annual savings | $1,709,000 | ||
| Program cost (sensors, software, training) | $340,000/year | ||
| Net annual benefit | $1,369,000 | ||
| ROI | ~403% |
Check your own numbers. That 65% downtime cut is on the high side of published ranges. Test it against your own condition-monitoring coverage first.
Payback period is the time it takes for savings to equal the program's cost, and most predictive maintenance programs hit it within 8 to 14 months. A few more figures worth citing, each with its source:
Always name the source and date in a live pitch. Use industry ranges to check your own number, not to replace it.
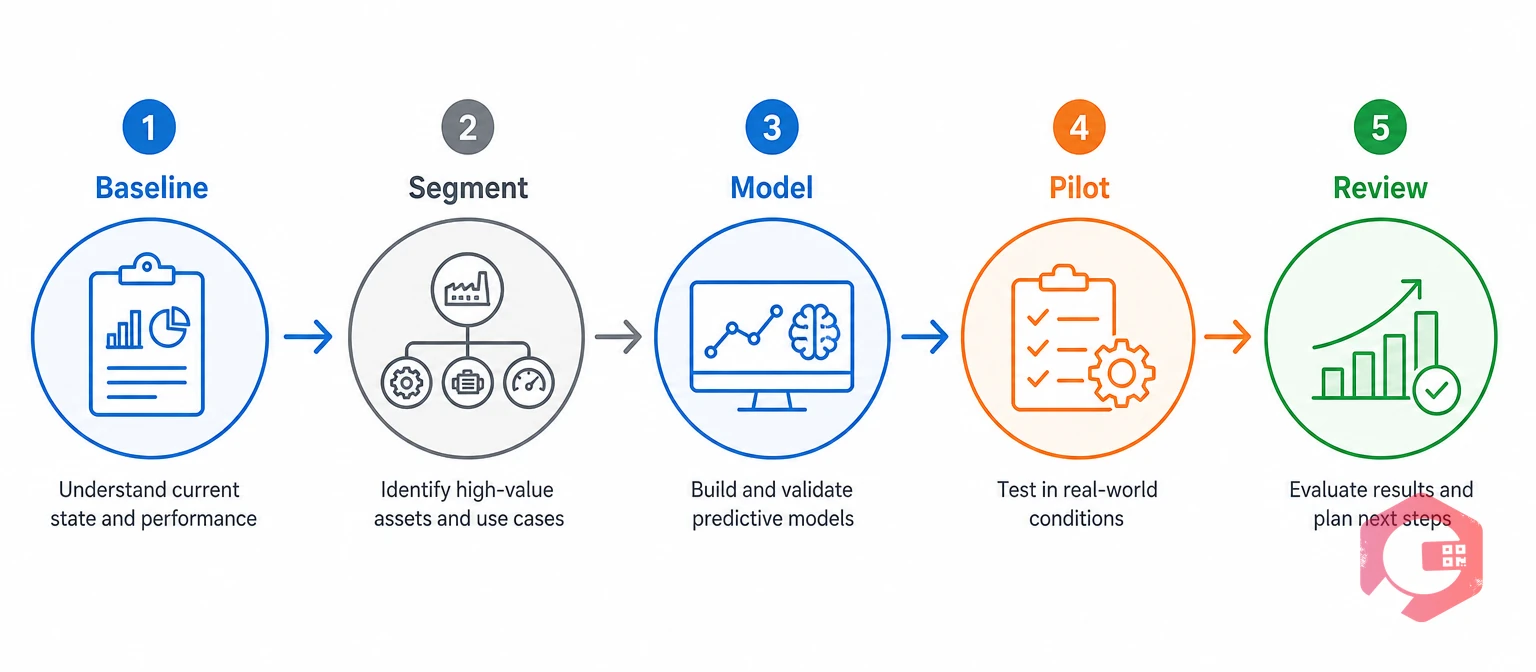
Teams that skip the pilot step tend to promise savings for the whole plant on day one. That is the fastest way to lose credibility before the program proves itself.
Each lever above maps to one part of the Computerized Maintenance Management System. That is what turns the business case into a real rollout plan.
The condition monitoring data, the work order it opens, and the cost rollup all live in one system. Most facilities avoid the integration delay that stalls bolt-on sensor pilots this way.
Most facilities reach payback in 8 to 14 months. Sectors with high downtime costs, like automotive assembly, can see payback in under three months. The timeline depends on how well you priced the baseline and how fast alerts reach a work order.
A first-year model in the 150% to 250% range holds up better than a big number pulled from a vendor's best-case slide. Build it from your own downtime and labor data, not industry averages alone.
Start with the 10% to 20% of assets that carry the highest failure impact, failure frequency, and repair cost. That mix gives a pilot its fastest, most defensible payback.
No. The baseline math only needs work order, labor, and parts data you likely already have in your CMMS, well before any new sensor goes in.
Schedule a free demo to see how Cryotos turns this business case into a working predictive maintenance pilot on your own critical assets.


Cryotos AI predicts failures, automates work orders, and simplifies maintenance—before problems slow you down.



