

Root cause analysis tools are structured methods that maintenance teams use to find why an asset failed, not just what broke. The core tools are the 5 Whys, the Fishbone diagram, Fault Tree Analysis (FTA) and Failure Mode and Effects Analysis (FMEA). Pareto charts, change analysis and scatter diagrams support them.
Each tool fits a different kind of failure. Below, we compare seven root cause analysis tools side by side and share a simple way to pick the right one.
Key Takeaways
The seven root cause analysis tools below differ in approach, effort and the data they need. Use this table before you open an investigation.
| Tool | Approach | Best For | Effort | Data Needed |
|---|---|---|---|---|
| 5 Whys | Reactive, one causal chain | Simple, repeat failures | Low (15–30 min) | Team knowledge |
| Fishbone (Ishikawa) | Reactive, cause categories | Problems with several possible causes | Low to medium (1–2 hrs) | Team knowledge and observations |
| Fault Tree Analysis | Top-down logic with AND/OR gates | Complex or safety-critical systems | High (days) | Failure rates and system design |
| FMEA | Proactive, bottom-up | Critical assets and PM planning | High (days to weeks) | Component list and failure history |
| Pareto analysis | Data ranking (80/20 rule) | Choosing which problems to investigate | Low | Coded work order history |
| Change and barrier analysis | Comparison with a known good state | Failures after a change, safety events | Medium (hours) | Baseline records and procedures |
| Scatter and timeline analysis | Data validation and sequencing | Confirming a suspected cause | Medium (hours) | Sensor, meter or time-stamped logs |
Times are typical ranges and grow with asset complexity. Light tools answer most breakdowns. Heavy tools belong on critical assets.
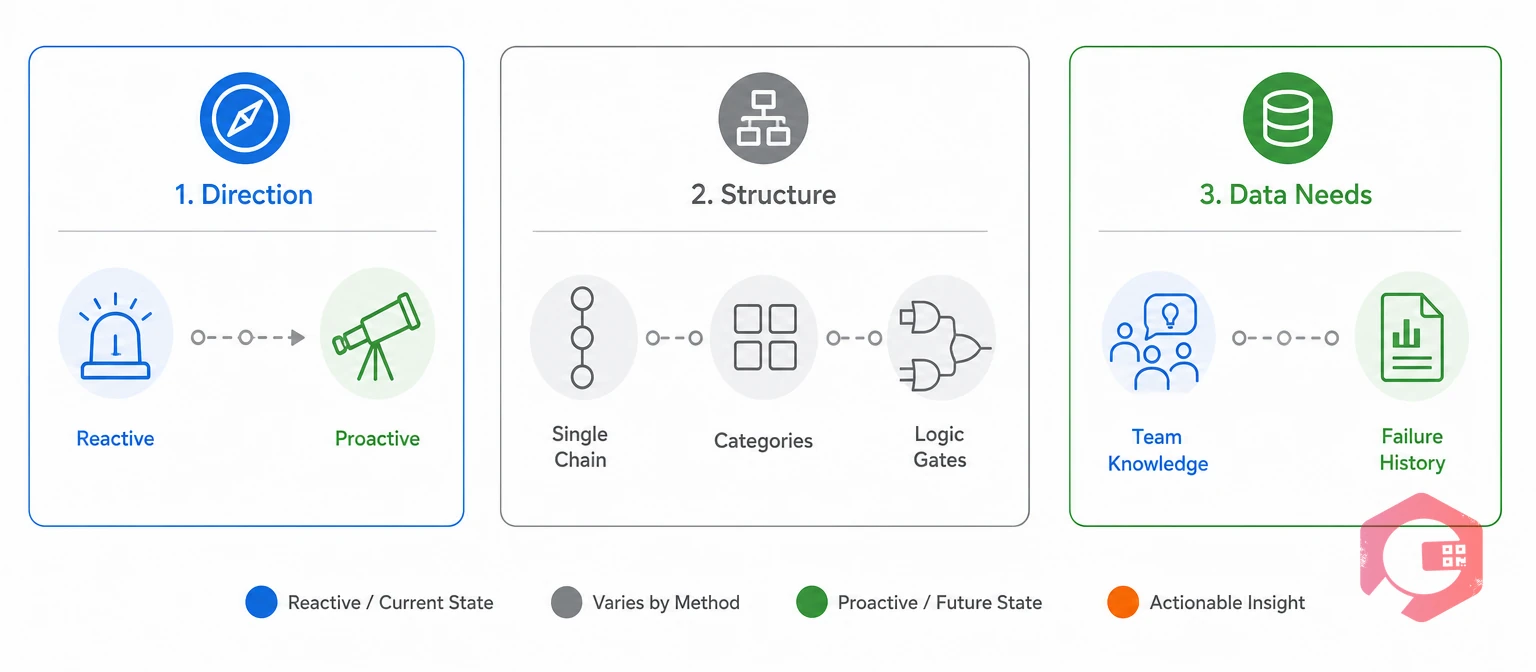
Root cause analysis (RCA) is a structured method for finding the underlying reason a failure happened so it does not recur. In maintenance, you look past the burnt motor to the bad coupling that overheated it.
Reliability-centered maintenance (RCM) and the ISO 55000 asset management standard both treat RCA as a core feedback loop. Root cause analysis tools differ in three ways.
Match these three traits to the failure, and the right tool becomes clear.
Before your next investigation, grab this free root cause analysis investigation checklist to log evidence, causes and actions in one place.
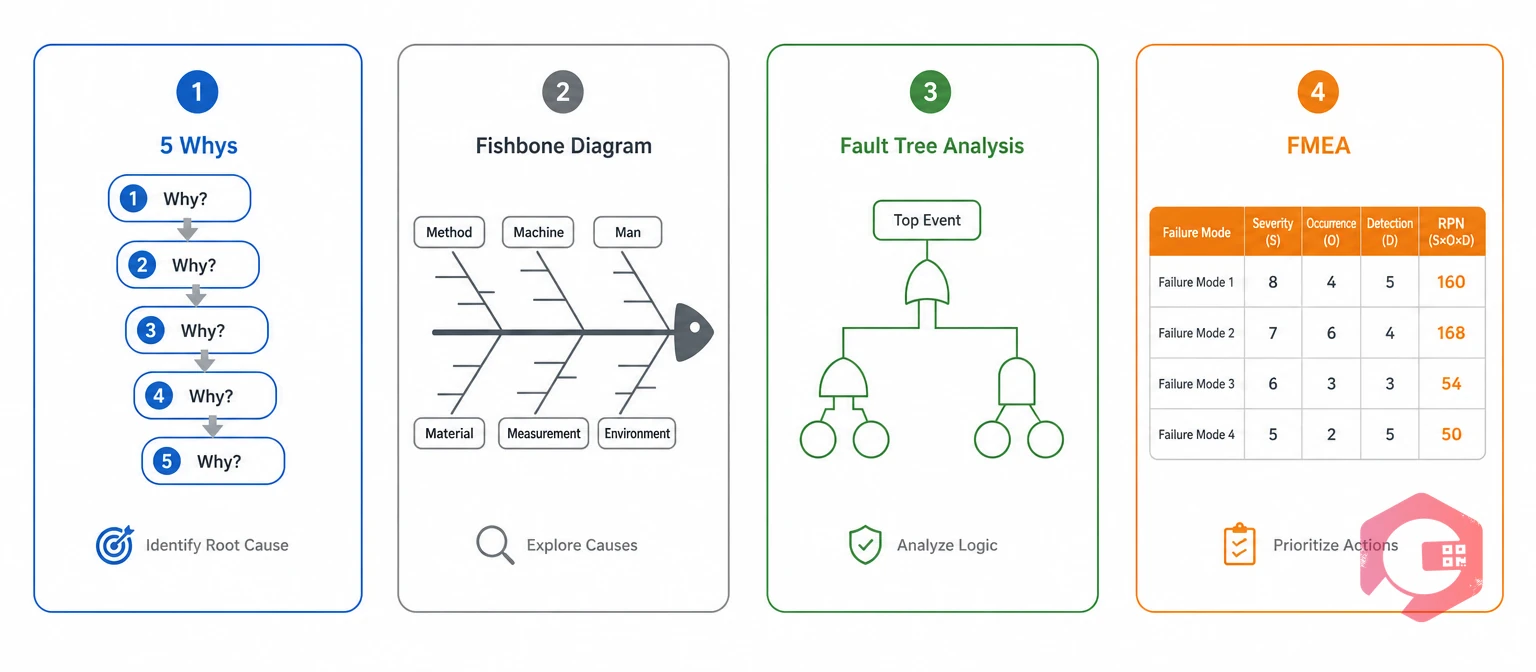
The 5 Whys trades breadth for speed, while the Fishbone diagram trades speed for breadth. Most maintenance teams get the best results by using both.
The 5 Whys is a questioning technique that asks "why?" repeatedly until it reaches a cause you can act on. It came out of the Toyota Production System and takes 15 to 30 minutes on the shop floor.
Here is a typical chain. The pump stopped because the motor tripped. The motor tripped because it overheated, and it overheated because the bearing seized. The bearing seized because the PM schedule had no greasing task. Ask each why about the process, not the person. Learn how to run a 5 Whys analysis step by step.
A Fishbone diagram is a cause-and-effect chart that sorts possible causes into categories branching off the problem. Teams often use the 6M groups: Man, Machine, Method, Material, Measurement and Mother Nature. The ASQ Fishbone guide shows the classic layout.
| Factor | 5 Whys | Fishbone Diagram |
|---|---|---|
| Best for | One likely cause chain | Several possible causes |
| Time needed | 15–30 minutes | 1–2 hours |
| Output | One root cause | Map of possible causes |
| Main risk | Stops at the first plausible answer | Lists causes without proving them |
Map the candidates with a Fishbone. Then run the 5 Whys on the two or three most likely branches. You get breadth first and depth second.
Fault Tree Analysis works top-down from one failure. FMEA works bottom-up from every way a part can fail. Both take more effort, so most plants save them for critical assets.
Fault Tree Analysis is a top-down method that links a failure to its causes through logic gates. It shows how small failures combine to cause an outage. The U.S. Nuclear Regulatory Commission's Fault Tree Handbook is still a standard reference.
FMEA is a proactive method that lists how each part can fail and ranks each failure by risk. Each mode gets a Risk Priority Number. RPN = Severity × Occurrence × Detection, each scored 1 to 10. Read more about Failure Mode and Effects Analysis and the ASQ FMEA overview.
| Factor | Fault Tree Analysis | FMEA |
|---|---|---|
| Direction | Top-down, from one failure | Bottom-up, from each component |
| Timing | After a failure, or during design | Before failures, during PM planning |
| Output | Logic tree and event probability | Failure modes ranked by RPN |
| Best use | Safety-critical or redundant systems | Critical assets and RCM programs |
Use FTA to explain a serious failure and FMEA to prevent the next one. Feed each FTA finding into the FMEA, so your PM plan keeps getting better.
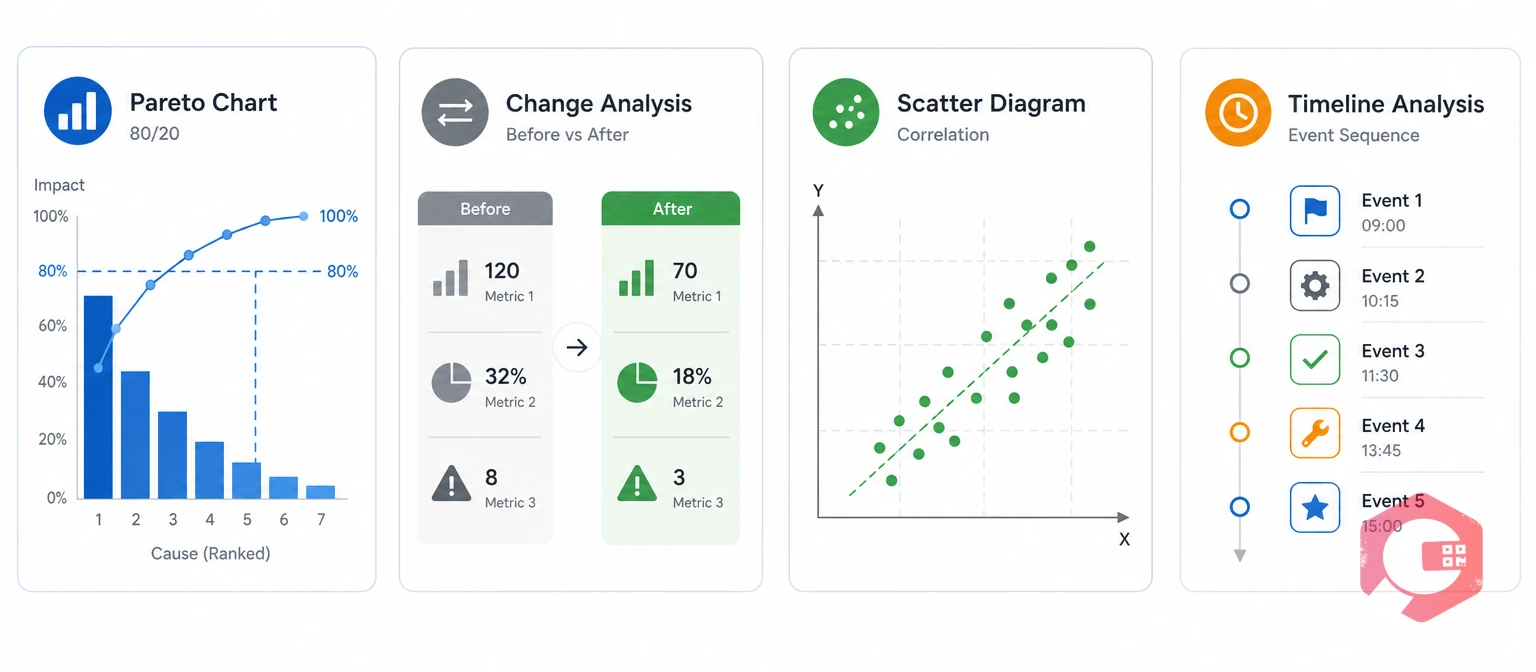
Supporting root cause analysis tools show you where to look and help prove a cause with data. They rarely find the root cause alone. They do make the core tools more accurate.
Correlation is not proof. Confirm a scatter finding with the 5 Whys or physical evidence before you close the case.
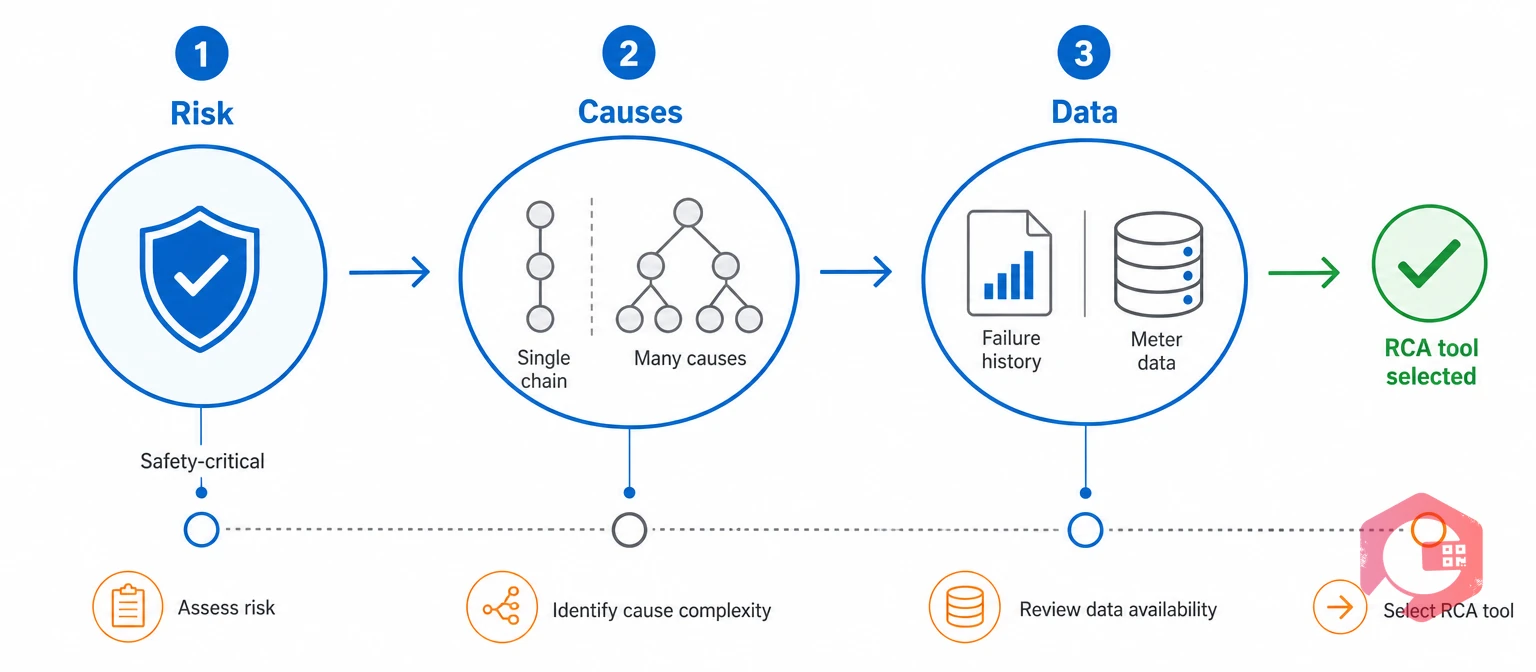
Choose the tool by risk, likely causes and the data your team has. Start each review cycle with a Pareto chart, so effort goes to the costliest failures.
The Risk-Causes-Data (RCD) Selection Framework:
Many maintenance teams also set simple triggers. They run a 5 Whys on every breakdown above a downtime limit. They run a full RCA on any safety event or any repeat failure within 90 days. Each finding then feeds the FMEA and the PM plan, so the fix sticks.
Most failures with root cause analysis tools come from process gaps, not the wrong diagram. Teams that get lasting results avoid these five mistakes.
Fix these five gaps, and even a simple 5 Whys will beat a complex analysis that never closes.
Cryotos links every RCA to the work order, the asset and the follow-up task. Investigations close instead of stalling. As a Computerized Maintenance Management System, it keeps evidence, causes and fixes in one record.
Maintenance teams using Cryotos have reported up to 30% reduction in unplanned downtime and 25% faster repair turnaround.
Start with the 5 Whys and the Fishbone diagram. Both need no software or failure history, and technicians can learn them in one session. Add Pareto analysis once your work orders carry failure codes.
Yes, and it often works better than either tool alone. Use the Fishbone to list possible causes across the 6M groups. Then run the 5 Whys down the most likely branches to reach the root cause.
Use Fault Tree Analysis when a failure is safety-critical, very costly or involves backup systems. For a routine breakdown on one machine, the 5 Whys or Fishbone gives a faster answer.
A 5 Whys takes 15 to 30 minutes, and a Fishbone session takes about 1 to 2 hours. Fault Tree Analysis and FMEA can take days or weeks on complex assets. Most of that time goes into gathering evidence, so good work order records cut RCA time sharply.
Check whether the same failure comes back on that asset. Track repeat failures and MTBF for 60 to 90 days after the fix. If the failure returns, reopen the RCA.
Root cause analysis tools only pay off when every finding turns into a tracked fix. Schedule a free demo to see how Cryotos links RCA, work orders and preventive maintenance, so failures stop repeating.



Cryotos AI predicts failures, automates work orders, and simplifies maintenance—before problems slow you down.



