
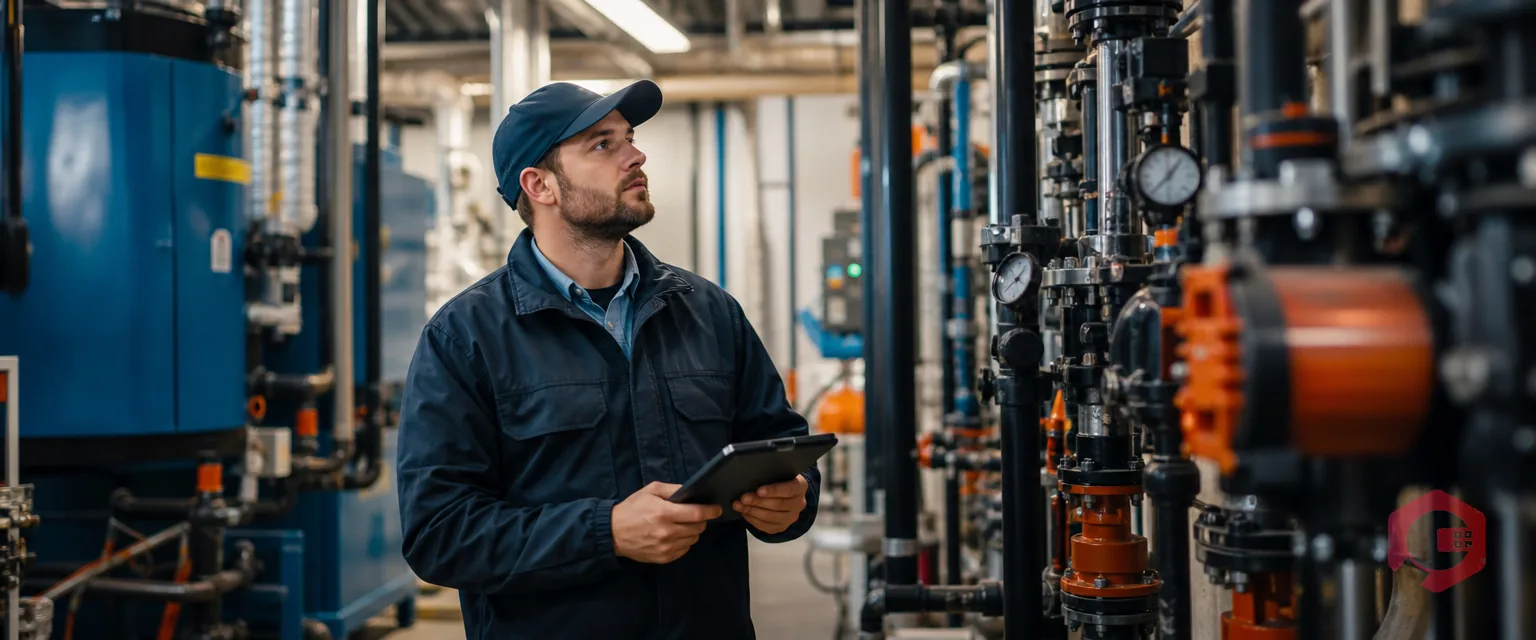
Property management maintenance is the daily work of inspecting, repairing, and servicing a portfolio. That means units, common areas, building systems, and grounds. Most property teams still handle this work one property at a time, on spreadsheets that never talk to each other. A computerized maintenance management system, or Computerized Maintenance Management System, replaces those spreadsheets with one shared system. A 40-unit building and a 400-unit campus can then report on the exact same numbers.
Key Takeaways
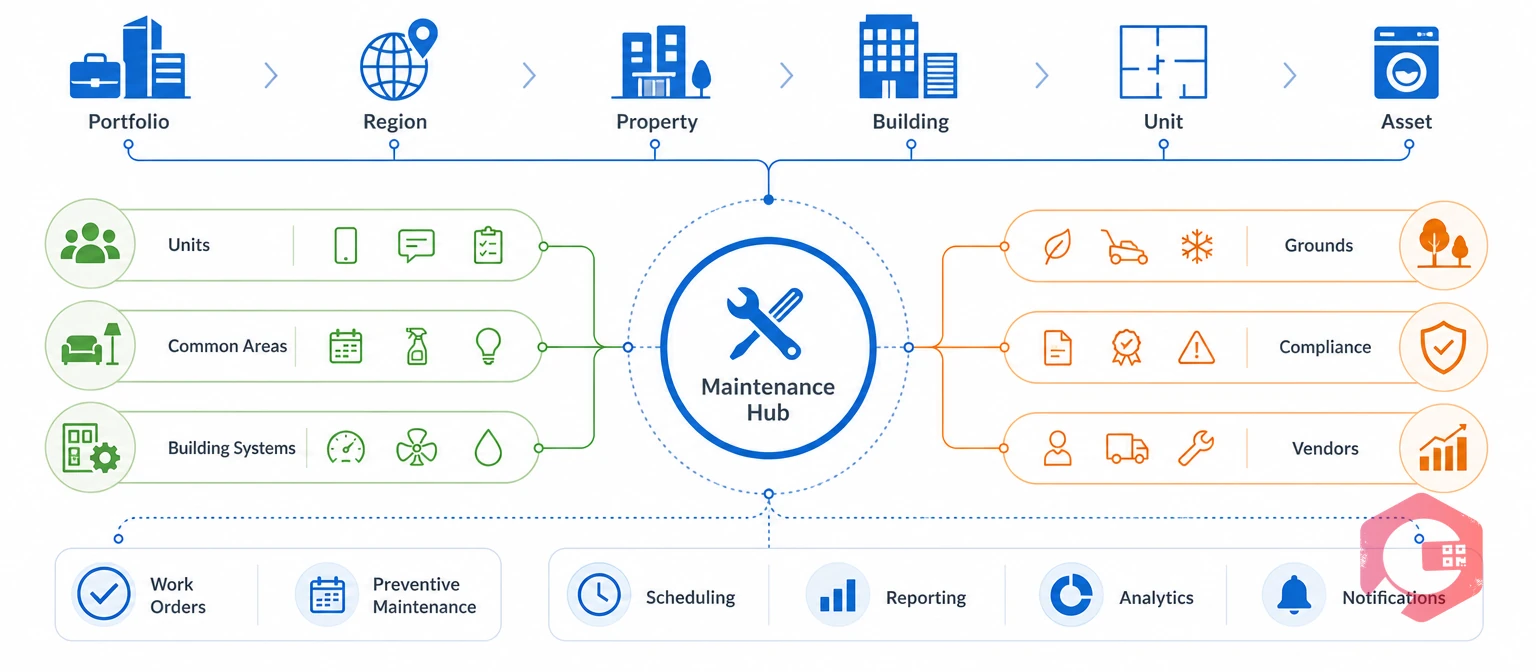
Property management maintenance is the inspection, repair, and compliance work that keeps a rental portfolio safe and functional. That covers units, common areas, building systems, grounds, and safety gear. In a multi-unit portfolio, the unit of work is never just one building.
It runs from portfolio, to region, to property, to building, to unit, room, system, and asset. Good property management maintenance ties resident service to asset decisions. It also ties that service to how well a vendor follows through. It proves the required work actually happened.
A leaking valve in one unit is a simple work order. The same valve failing four times in six months across a property is a signal for the capital plan. Only a connected system catches that pattern.
Property management maintenance looks slightly different depending on the type of portfolio, but the core job stays the same everywhere. Each portfolio type still needs the same three things: a clear request channel, a fast response path, and a record that survives staff turnover.
Each of these portfolios still needs the same thing: one record of what broke, who fixed it, and what it cost.
Scale creates fragmentation fast. Requests arrive by phone, email, text, resident portal, sensor alert, and staff walk-through. Each channel tends to use its own priority labels and its own way of closing a ticket.
Most maintenance teams know this pattern well. Technicians travel without the right part. Preventive jobs lose out to same-day emergencies. Property-level spreadsheets hide the portfolio trend sitting underneath them.
The result is duplicate requests and uneven response times. Compliance records stay thin. Capital plans get built on asset age or guesswork instead of real condition and cost history.
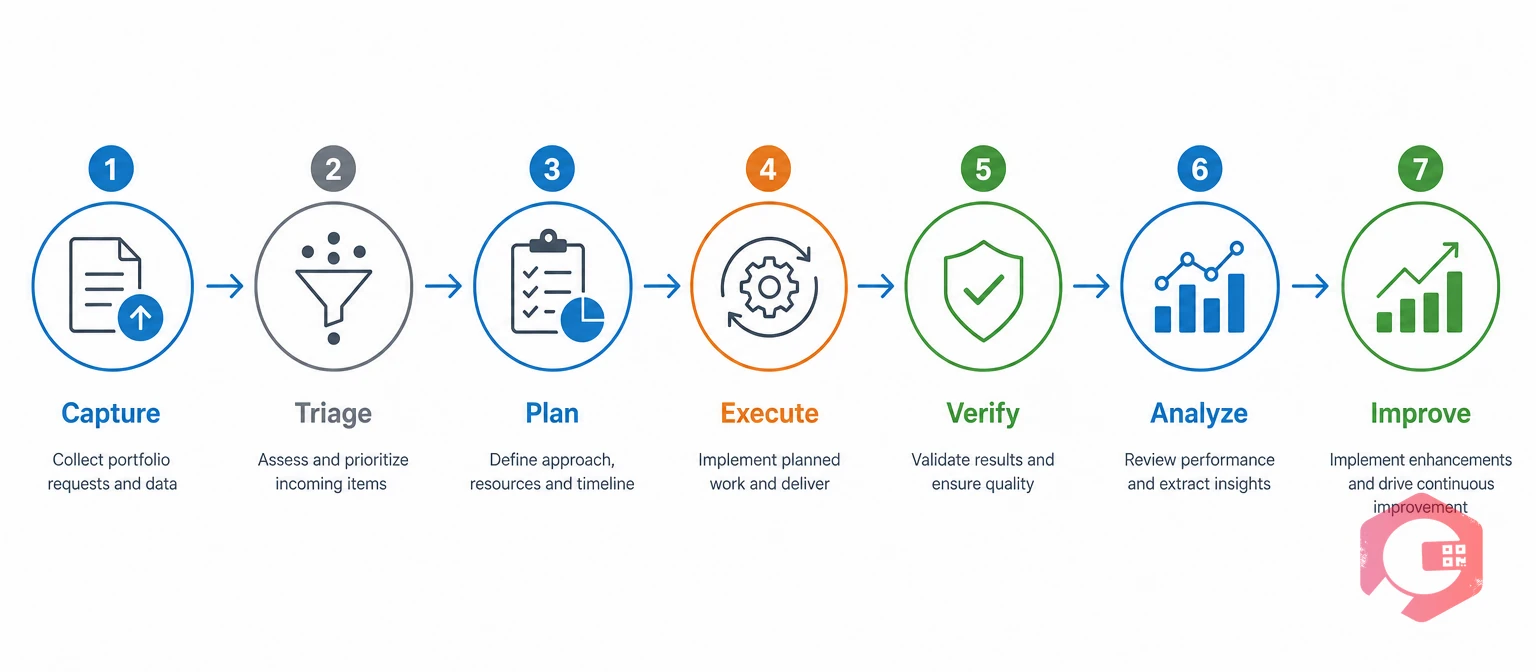
A facility management software platform built for property portfolios pushes every request through the same seven stages. It does not matter if the request started as a resident complaint or a sensor alert.
The 7-Stage Portfolio Maintenance Workflow:
A single leak moves through all seven stages cleanly. A resident reports water under a sink. The system flags it as an active leak with a four-hour target. A plumber arrives with the right valve kit. Once that same valve fails a fourth time on the property, the closed tickets trigger a root-cause review instead of another quick patch.
Want to test this workflow against your own numbers? Try the maintenance cost calculator before you compare vendors.
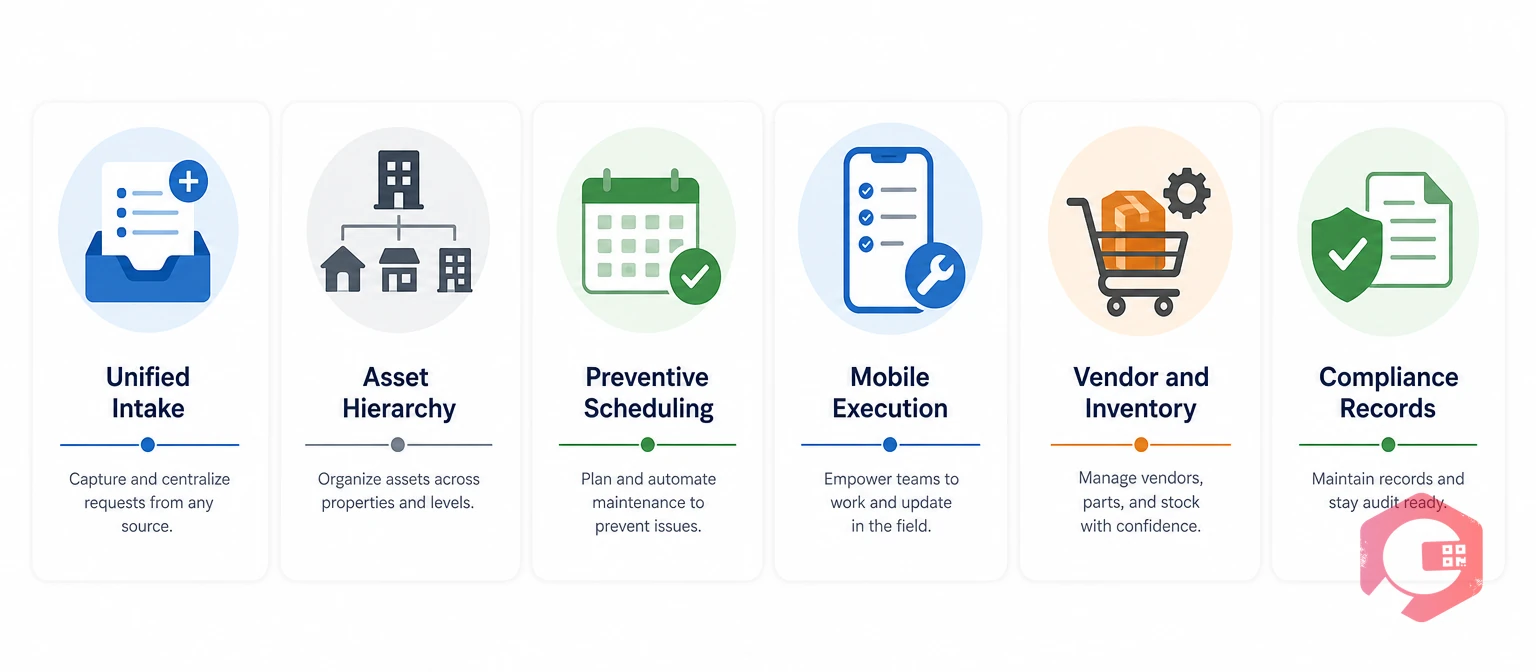
Most property portfolios need the same handful of capabilities. It does not matter if the assets are apartments, student housing, senior living, or retail space.
Most maintenance teams that put these six capabilities in one system stop chasing the same failure across three spreadsheets. Property management maintenance data ends up living in one place instead of five. New hires can find what they need on day one, instead of asking three people where a specific property keeps its records.
A portfolio maintenance scorecard turns raw work-order data into numbers you can compare across every property. It uses a small set of standard formulas. That beats property-by-property guesswork. The table below covers five formulas that show up most in portfolio reviews.
| Metric | Formula | What It Tells You |
|---|---|---|
| Cost per occupied unit | Total maintenance cost / average occupied units | Lets you compare properties of different sizes fairly |
| Preventive maintenance compliance | PM completed on time / PM due × 100 | Shows whether scheduled work is really happening |
| First-time fix rate | Work orders closed without repeat work / eligible work orders × 100 | Flags a vendor or tech leaving jobs unfinished |
| Repeat repair rate | Qualifying repeat work orders / completed corrective work orders × 100 | Points to an asset that needs root-cause work |
| Planned maintenance ratio | Planned maintenance hours / total maintenance hours × 100 | Measures time spent on planned work versus firefighting |
Keep operating savings, avoided cost, and capital deferral in separate columns instead of one blended number. Net benefit equals verified annual benefit minus the recurring CMMS cost. Payback period equals the initial investment divided by monthly net benefit.
This same logic sits behind the ISO 55000 asset management standard. It treats verified condition and cost data as the basis for decisions, not calendar age alone. Maintenance teams using Cryotos have reported up to 30% reduction in unplanned downtime and 25% faster repair turnaround. Those gains show up directly in the cost-per-unit and first-time-fix numbers above.
Property management maintenance now faces more outside checks than it did a few years ago. HUD's revised NSPIRE inspection standard is one example. It changes how public and assisted housing properties document unit and building conditions. HUD's compliance guidance spells out the new rules and deadlines.
Energy and water use carry their own paper trail too. ENERGY STAR's multifamily housing guidance shows owners how to track energy and water use across a portfolio. The Department of Energy's operations and maintenance guide ties routine upkeep directly to energy savings.
A CMMS that already logs inspection dates, meter readings, and corrective actions makes each reporting cycle far less painful. The data is already there. Nobody has to rebuild it from memory the week before an audit, and nobody has to guess which property missed a deadline last quarter.
A CMMS cannot fix a maintenance program that was never standardized. These are the failure patterns portfolio teams run into most often.
Properties also differ by age, unit count, occupancy, and climate. Normalize for those differences first. Only then should portfolio comparisons feed incentives or investment decisions.
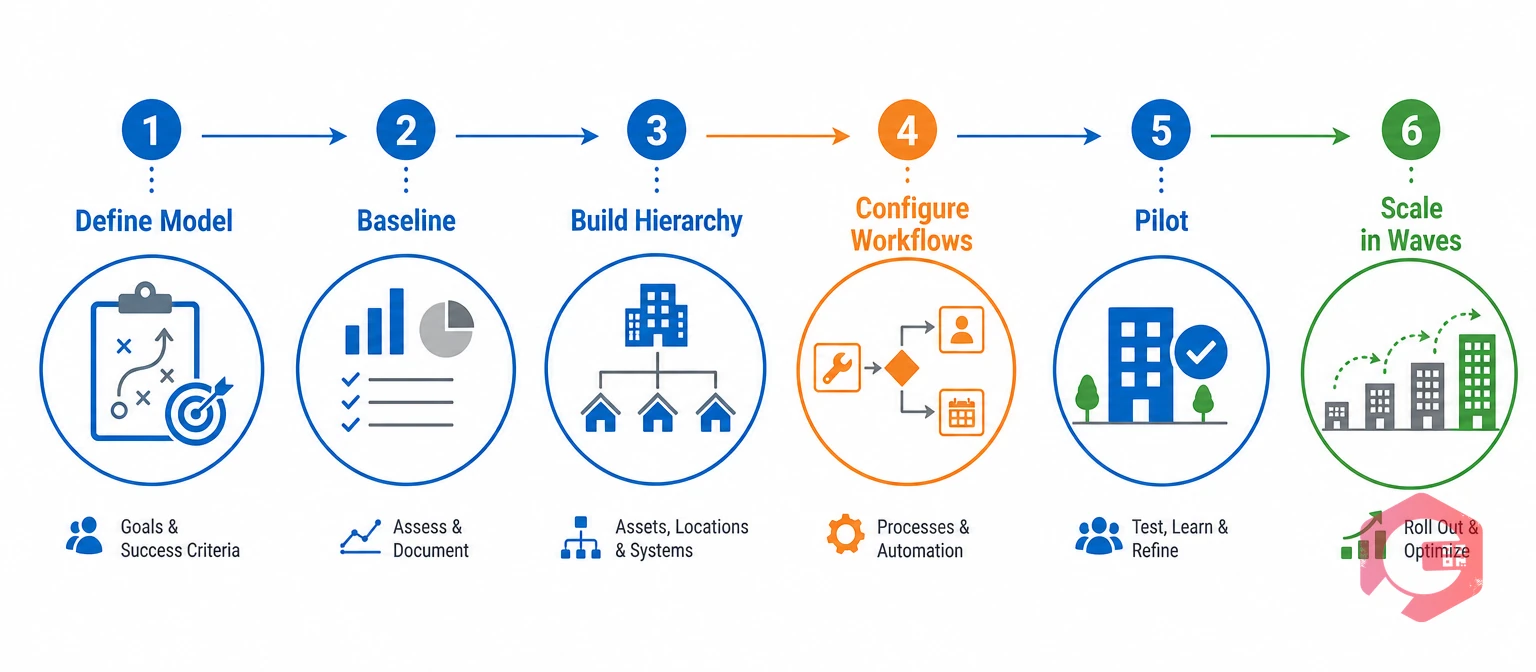
A focused pilot beats a portfolio-wide switch-on. The sequence below reflects how most successful property CMMS rollouts actually play out.
Facilities that follow this sequence tend to reach stable, comparable reporting fast. Most get there within two or three maintenance cycles. Facilities that skip the pilot step usually spend a full year fighting bad data instead, and that year shows up as wasted labor hours, not a line item anyone budgeted for.
It covers the inspection, repair, and compliance work needed to keep units, common areas, building systems, and safety assets working across a portfolio. That means more than just one building.
A portfolio CMMS tracks a hierarchy running from portfolio, to region, to property, to building, to unit. It also produces metrics that stay comparable across properties of very different sizes and ages.
Most failures trace back to a weak asset hierarchy or a messy process that gets digitized instead of fixed. The software just copies the same problems the paper process had.
Most portfolios run a pilot across a few properties for one full maintenance cycle. Then they compare results against a documented baseline before deciding how fast to scale.
Property management maintenance earns its budget when it turns resident requests, inspections, and vendor work into one solid record instead of a pile of scattered spreadsheets. Schedule a free demo to see how Cryotos runs the full property maintenance workflow, from the first request to portfolio-level reporting.

Cryotos AI predicts failures, automates work orders, and simplifies maintenance—before problems slow you down.



