To rate condition monitoring findings as red, amber or green, compare each reading with its alert and alarm limits, then adjust the color for trend and asset criticality. Green means routine monitoring, amber means a planned repair, and red means urgent action.
A clear rule keeps every analyst’s report consistent. This guide gives a five-step rating method, a severity matrix, starting limits for four techniques and a report layout, then shows how maintenance software turns each color into tracked work.
Key Takeaways
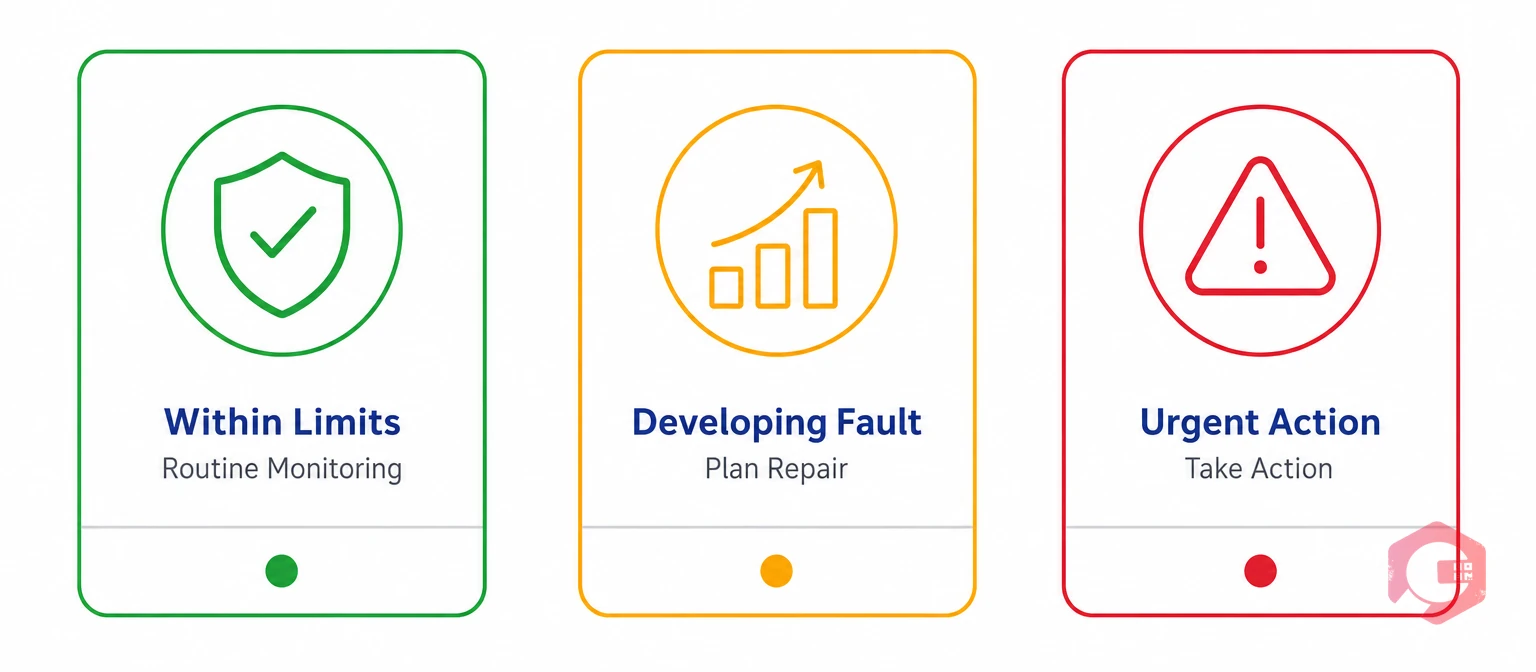
A RAG rating is a three-color status that shows how urgently a finding needs action. It turns condition monitoring findings from vibration, thermography, oil and ultrasound data into one signal a manager can read in seconds.
Standards give the structure but no single universal scale. ISO 17359 sets out the general steps of a condition monitoring program. ISO 20816-1 evaluates vibration by magnitude and by change over time. Most sites turn these into three colors and write the rule into a procedure.
As this overview of condition monitoring explains, the aim is to spot a significant change that points to a developing fault. A color is only useful when everyone reads it the same way.
Consistent ratings let a planner decide in minutes which asset needs a crew first. Without them, every analyst’s report has to be read line by line.
Consistency is what makes the colors worth trusting.
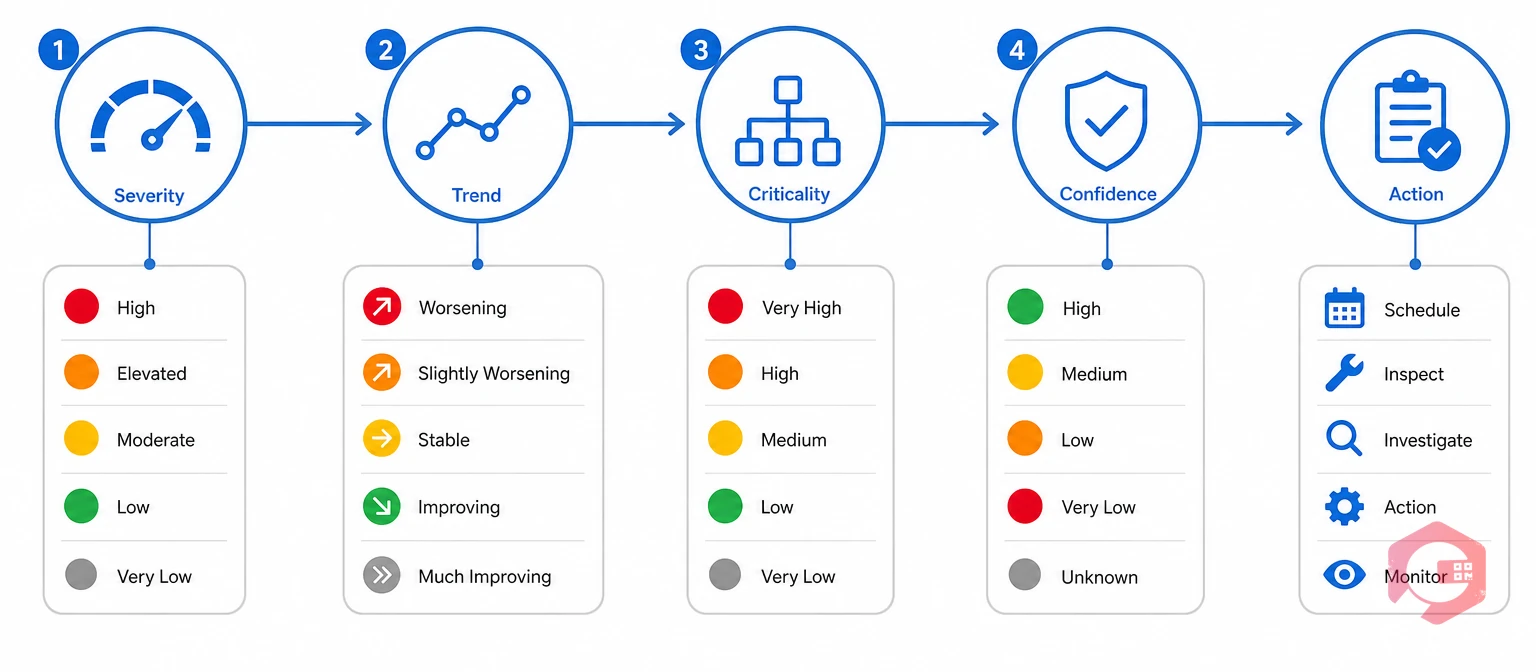
A reading alone rarely justifies a color. Analysts who rate condition monitoring findings well check four things: severity, trend, criticality and confidence. An alarm limit is the reading above which a machine needs urgent action. An alert limit sits lower and signals a developing fault.
The Four-Input RAG Rating Method:
Define “rising fast” in your procedure, for example a rise of more than 25% between readings. Any finding that creates an immediate safety hazard is red, whatever the other inputs say. Five steps give every analyst the same answer from the same data.
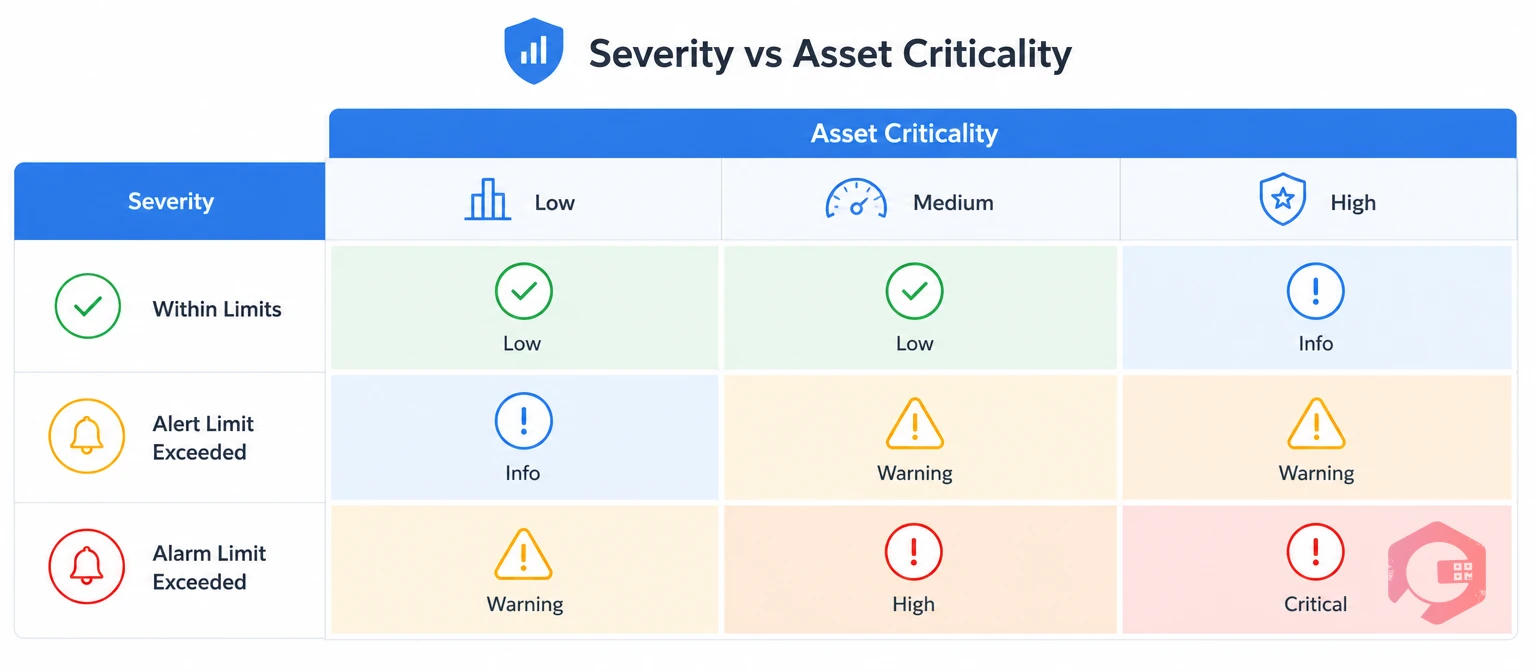
Asset criticality is a ranking of how badly a failure would hurt safety, output and cost. Rank every monitored asset once, in line with ISO 55000 risk-based asset management. A rating matrix is a grid that combines how far a reading exceeds its limit with how critical the asset is.
| Severity | Low criticality | Medium criticality | High criticality |
|---|---|---|---|
| Within limits | Green | Green | Green |
| Alert limit exceeded | Amber | Amber | Red |
| Alarm limit exceeded | Red | Red | Red |
A fast-rising trend then lifts green to amber and amber to red. Maintenance teams that share one matrix across sites stop arguing about colors and start closing work.
Build the rating step into your inspections with Cryotos maintenance checklists that hold a reading, a limit and a color field.
Start from published limits, then tune them to your own baselines. The bands below are commonly used starting points. OEM limits, standards and insurer rules come first.
| Technique | Green | Amber | Red | Notes |
|---|---|---|---|---|
| Vibration | Below the alert limit for the machine class | Above the alert limit | Above the alarm limit | Use the limits in the ISO 20816 part for your machine class, and track change over time. |
| Thermography (ΔT against a similar component under load) | Under 1°C | 1 to 15°C | Over 15°C | Scan under load and check emissivity. |
| Oil analysis | Viscosity within ±10% of new oil | Viscosity ±10% to ±20%, or rising wear metals | Viscosity beyond ±20%, or water above the limit | OEM and laboratory limits come first. |
| Ultrasound (dB over baseline) | Under about 8 dB | About 8 to 16 dB | Over about 16 dB | Record a baseline for each bearing. |
Baselines matter more than any table, because a reading that is normal for one pump can be an alarm for another. Cryotos IoT meter reading can hold these limits per asset, so a crossing creates a work order.
Three examples show how the five steps give a color and an action.
Each example ends with an action, not only a color.
A good RAG report lets a reader check each rating without calling the analyst. Every row of condition monitoring findings should show the same eight items.
At the top, count assets by color, list every red with its action, and show how long each amber has been open. Show unmeasured assets as gray and print the color name beside the color, for readers with color-vision deficiency. Linking each red and amber row to a work order in work order management keeps the report and the work in step.
Most maintenance teams that struggle with RAG reports have a process gap, not a sensor problem.
A common mistake is never checking the scheme against outcomes. Each quarter, count how many reds were confirmed on inspection and how many ambers are older than your planned window. Those two numbers show whether the limits are right.

A site can roll out RAG rating in a few weeks by starting small and fixing the rules before the volume grows.
Start with the assets whose failure would hurt most, and add the rest once the first group runs smoothly.
A Computerized Maintenance Management System (CMMS) keeps readings, limits and work in one record. Teams set up RAG rating in Cryotos with features they already use.
Maintenance teams using Cryotos have reported up to 30% reduction in unplanned downtime and 25% faster repair turnaround across their wider maintenance programs. Software applies the rule, but a qualified analyst still makes the final call.
Green means the reading is within limits, so routine monitoring continues. Amber means a developing fault, so you confirm it, monitor more often and plan the repair. Red means a serious fault or an exceeded alarm limit, so you act now.
Compare the reading with the alert and alarm limits first. Then raise amber to red if the trend is rising fast or the asset is high criticality. An immediate safety hazard is always red.
Yes. A fast rise shortens the time to failure, so it should lift green to amber and amber to red. Define the rise that counts, such as 25% between readings, in your procedure.
Set a planned window in your procedure, such as the next planned stop or a few weeks. Track the age of every amber, and escalate any that pass the window.
A CMMS can apply alert and alarm limits to readings and raise prioritized work orders. Teams then map amber and red to priority and due dates. A qualified analyst should still confirm each red.
A color on a report only helps when it leads to work that gets done. Schedule a free demo to see how Cryotos links condition monitoring readings, limits and work orders in one record.



Cryotos AI predicts failures, automates work orders, and simplifies maintenance—before problems slow you down.