

Failure type classification is the practice of grouping equipment breakdowns into standard categories — mechanical, electrical, instrumentation, lubrication, process, and environmental — so maintenance teams can map each issue back to its root failure type and analyze patterns across assets. Without this structure, every work order reads as a one-off event. With it, three "random" pump failures this quarter reveal themselves as the same lubrication failure type, and that pattern points straight at a broken PM interval rather than bad luck.
Key Takeaways
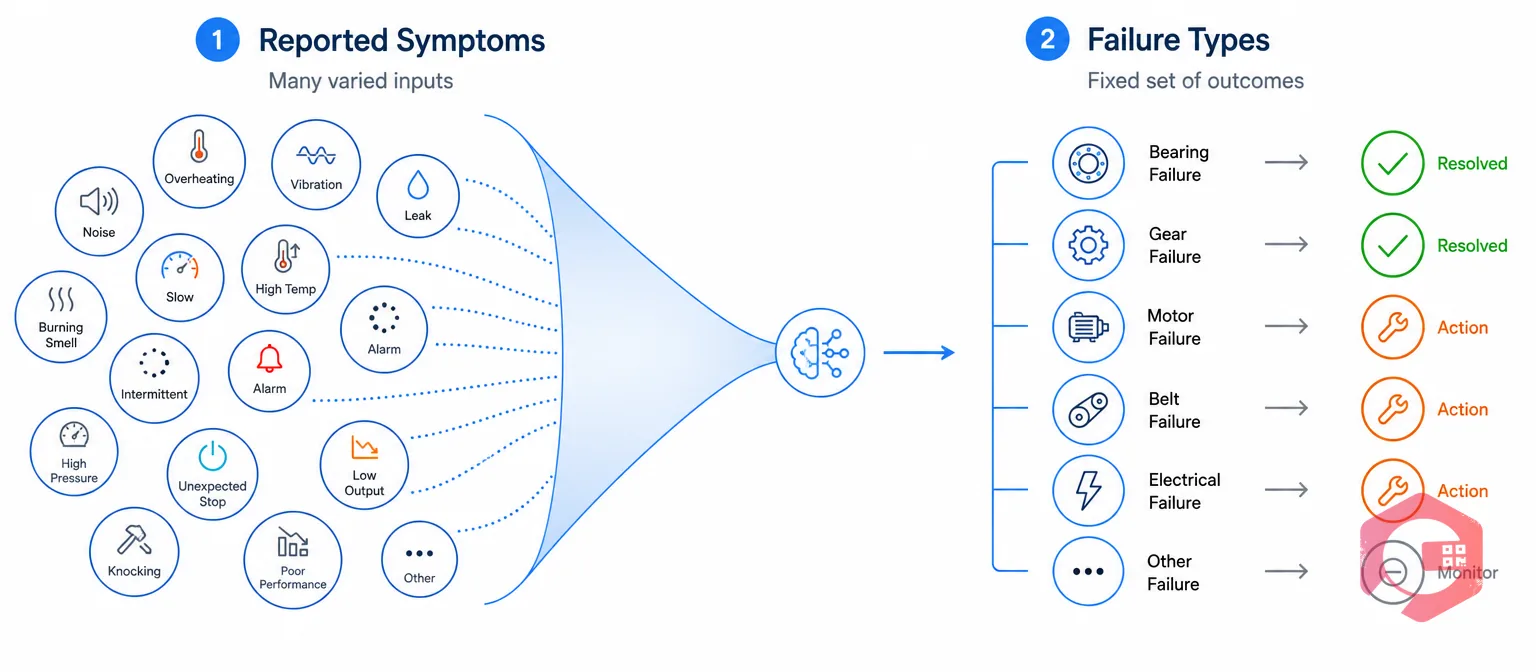
Failure type classification assigns every equipment breakdown to a defined category based on what actually failed and why — not just what symptom the operator reported. A conveyor stopping is a symptom. A worn drive belt is the failure type. That distinction matters because symptoms are almost infinite (thousands of unique complaint descriptions across a plant), while failure types are finite — usually somewhere between six and twelve categories cover 90% of breakdowns in a typical facility.
Most maintenance teams already capture some version of this in a "problem code" or "cause code" field on the work order. The gap is consistency. One technician logs "bearing failure," another logs "noise," and a third logs "vibration" for what is functionally the same mechanical failure type. Structured classification closes that gap by giving technicians a fixed list to choose from, tied to a clear definition, rather than a free-text box.
An issue type describes what the reporter observed — leak, overheating, unusual noise, won't start. A failure type describes the underlying category the issue belongs to — mechanical, electrical, lubrication, and so on. The same issue type can map to different failure types depending on the asset: "won't start" on a pump might be electrical (tripped overload) or mechanical (seized shaft). Mapping issue types to failure types is what lets you aggregate data meaningfully — you can't run a Pareto chart on free-text descriptions, but you can run one on a fixed set of failure categories.
Reliability engineering runs on pattern detection, and patterns only surface when data is categorized consistently. A plant logging 500 work orders a month with no failure type field has 500 individual stories and no way to answer the question that actually drives budget and staffing decisions: which failure type is costing us the most downtime?
Cryotos customers using structured failure classification alongside downtime tracking have reported up to 30% reductions in unplanned downtime, largely because recurring failure types surface within weeks instead of after a year of buried work order text.
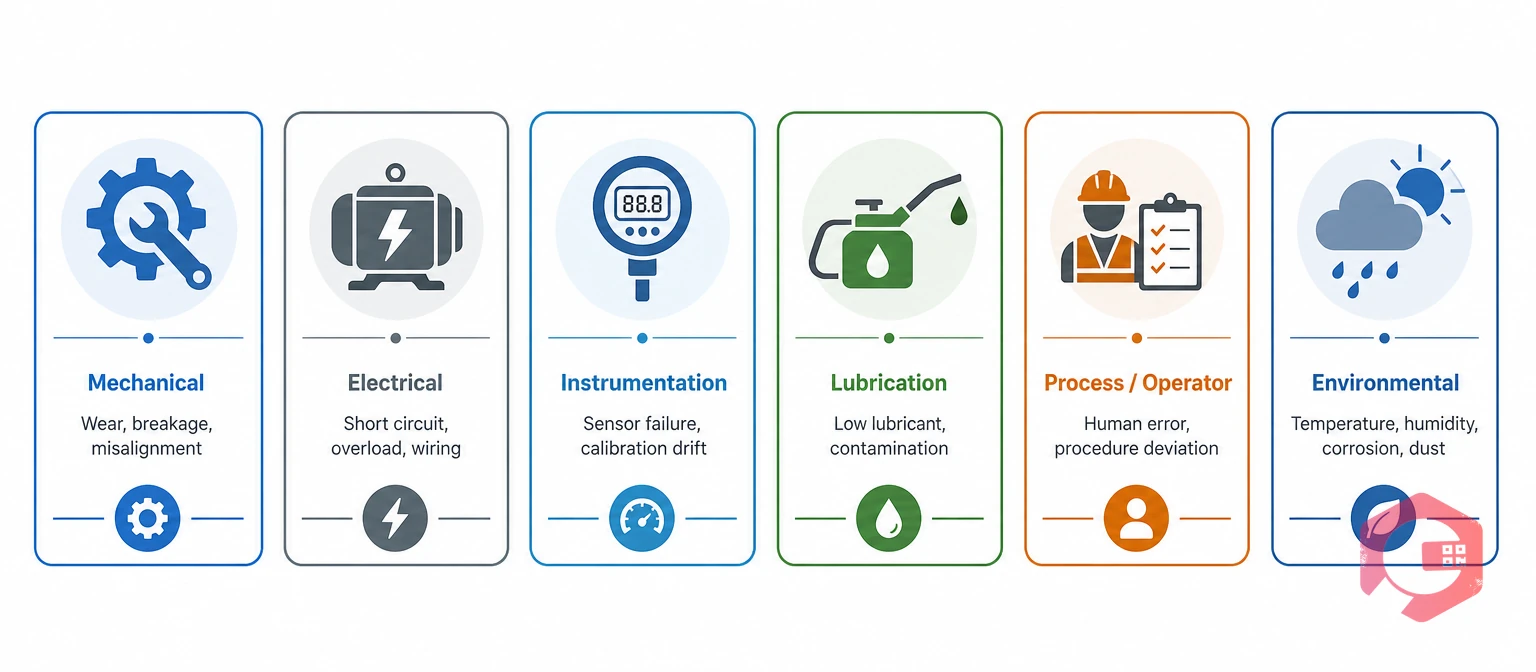
Most industrial equipment failures fall into one of six categories. Keep your list this short — more than eight or nine failure types makes technicians hesitate at close-out, and hesitation is where classification consistency breaks down.
Covers wear, fatigue, misalignment, and physical component breakage — worn bearings, broken shafts, stripped gears, cracked housings. Mechanical failure is typically the largest category by volume in rotating equipment-heavy facilities and usually correlates with PM interval, lubrication quality, or installation error.
Covers motor winding faults, tripped breakers, blown fuses, loose connections, and control voltage issues. Electrical failure often presents as a sudden stop with no warning, which makes it harder to catch with time-based PM and a stronger candidate for condition monitoring.
Covers sensor drift, PLC faults, calibration errors, and signal loss. This category is easy to miss because the equipment itself is fine — the control loop feeding it bad data is the actual failure. Instrumentation failures frequently masquerade as process or mechanical failures until someone checks the sensor.
Covers insufficient lubrication, wrong lubricant, contamination, and over-greasing. Lubrication failure deserves its own category rather than folding into "mechanical" because the root cause and the fix — a PM checklist change, not a repair — are completely different.
Covers overloading, incorrect operating procedure, running outside design parameters, and operator error. This category is uncomfortable to log honestly, but skipping it hides a real cost driver: assets that fail repeatedly because of how they're run, not what's wrong with them mechanically.
Covers corrosion, temperature extremes, moisture ingress, and dust or particulate damage. Common in outdoor, coastal, or high-humidity facilities, and often invisible until an asset that "should" have lasted years fails early with no obvious mechanical cause.
A failure type mapping matrix is a reference table that connects the symptom a technician reports to its likely failure category, probable root cause, the best detection method, and the maintenance strategy that addresses it. This is the tool that turns classification from a data-entry chore into an active diagnostic aid — a technician facing an unfamiliar symptom can scan the matrix and narrow down what they're likely dealing with before they open the equipment.
Use this matrix as a starting template. Every facility's asset base is different, so expect to adjust the issue type examples to match what actually shows up on your work orders, while keeping the six failure type categories fixed for consistent analysis.
| Failure Type | Common Issue Types (Reported Symptoms) | Likely Root Cause | Detection Method | Recommended Strategy |
|---|---|---|---|---|
| Mechanical | Vibration, noise, seizure, broken component | Wear, fatigue, misalignment, poor installation | Vibration analysis, visual inspection | Preventive PM, alignment checks |
| Electrical | Won't start, tripped breaker, intermittent power | Winding fault, loose connection, overload | Thermal imaging, motor current signature analysis | Condition-based inspection |
| Instrumentation/Control | Inaccurate reading, erratic output, no signal | Sensor drift, calibration loss, wiring fault | Calibration check, signal trace | Scheduled calibration PM |
| Lubrication | Overheating, grinding noise, premature wear | Insufficient lubricant, contamination, wrong grade | Oil analysis, temperature check | Lubrication PM checklist |
| Process/Operator | Overload trip, out-of-spec output, repeated stoppage | Running outside design limits, procedure error | Process data review, operator interview | Operator training, SOP update |
| Environmental | Corrosion, early degradation, moisture damage | Humidity, temperature extremes, particulate ingress | Visual inspection, environmental monitoring | Protective enclosure, coating PM |
Notice that each row gives a technician three things at once: what to check first (detection method), what probably went wrong (root cause), and what prevents the repeat (strategy). That's the difference between a classification field that just sits in a database and one that actively speeds up diagnosis in the field.
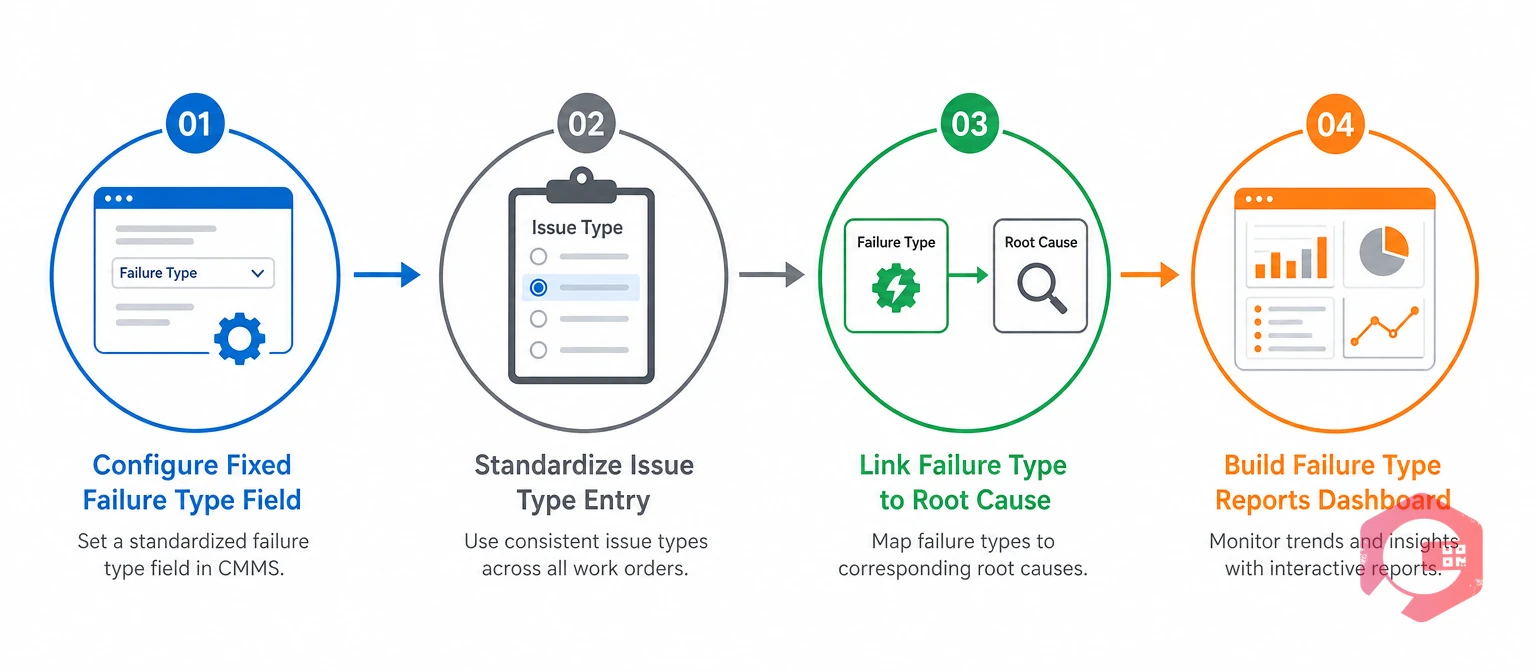
A mapping matrix on a spreadsheet helps train technicians, but it doesn't enforce consistency by itself. Implementation inside your CMMS is what makes classification durable across shift changes and staff turnover.
Add a dropdown field for failure type on every work order, using your six core categories as the option list. Make it required at close-out — a work order shouldn't be closeable without a failure type selected, the same way it shouldn't be closeable without a completion note.
Give technicians a short, consistent list of issue types per asset class rather than an open text field. Fewer typing errors means cleaner data downstream, and a technician who scans a dropdown list often recognizes the correct issue type faster than they can type a description.
Connect the failure type selection to a follow-up root cause field so the two data points travel together on every closed work order. This is where a structured root cause analysis process pays off — the failure type narrows the investigation, and the root cause field captures the specific answer.
Set up a recurring report or dashboard view that breaks down downtime, cost, and frequency by failure type. A BI dashboard that surfaces this automatically means the analysis happens every week rather than during an annual review when the patterns are a year stale.
Once failure type data accumulates across a few months of work orders, three analyses become possible that weren't before.
A failure rate calculator applied per failure type, rather than per asset overall, gives a sharper picture of where reliability is actually degrading. This kind of segmented analysis is the practical foundation that reliability-centered maintenance programs build on — you can't prioritize maintenance strategy by failure consequence if every failure is logged as an undifferentiated "breakdown."
For teams running more formal reliability programs, failure type classification also feeds directly into FMEA worksheets — the failure modes documented in an FMEA map cleanly onto the same categories used in day-to-day work order classification, so the two data sources reinforce each other instead of living in separate systems.
Failure type is a broad category — mechanical, electrical, lubrication — used for reporting and trend analysis across many assets. Failure mode is a more specific description used in FMEA, such as "bearing seizure due to lubricant breakdown." Failure modes roll up into failure types; a facility might track dozens of failure modes but only six or seven failure types for high-level analysis.
Most facilities get the best results with six to nine categories. Mechanical, electrical, instrumentation/control, lubrication, process/operator, and environmental cover the large majority of industrial failures. Add a category only when a recurring failure pattern genuinely doesn't fit an existing one — don't add categories for one-off events.
Yes, though it takes manual review. Pull a sample of past work order close-out notes and map them retroactively to your chosen failure type categories. Even six months of reclassified history gives you a usable baseline for MTBF and Pareto analysis going forward.
No — it precedes and speeds it up. Failure type tells you which category of problem you're facing; root cause analysis, often using the 5 Whys method, tells you the specific reason within that category. The root cause analysis investigation checklist ensures technicians follow a consistent process once the failure type has narrowed the investigation.
Failure type classification turns a work order log from a list of one-off complaints into a data set you can actually analyze. Once every technician selects from the same fixed categories and the CMMS enforces that selection at close-out, patterns that used to hide in free-text notes become visible within weeks — which asset class is driving downtime, which failure type keeps recurring, and where a PM interval or a training gap needs attention. Cryotos builds structured failure type fields, root cause tracking, and downtime-by-category reporting directly into the work order workflow, so this analysis runs continuously rather than during an annual scramble. Schedule a free demo to see how failure type mapping works inside a live CMMS.



Cryotos AI predicts failures, automates work orders, and simplifies maintenance—before problems slow you down.



