
Vehicle turnaround time in a dealership service center is the total elapsed time from when a customer drops off their vehicle to when it is ready for collection — and reducing it is one of the highest-impact improvements a service manager can make. Industry data from J.D. Power’s Customer Service Index consistently shows that service wait time is the leading driver of customer dissatisfaction at franchised dealerships, with the average repair order taking 3.2 hours from write-up to completion across the industry. Yet studies of actual technician activity show that 40–60% of that time is non-productive wait — parts delays, approval lags, idle time between jobs — not active work on the vehicle.
CMMS data changes that equation. Instead of managing turnaround time by feel or end-of-day DMS summaries, service managers can pull real-time metrics that identify exactly where time is being lost, in which bay, on which job type, and on which shift. This guide shows you how to use that data to find the bottlenecks and close them.
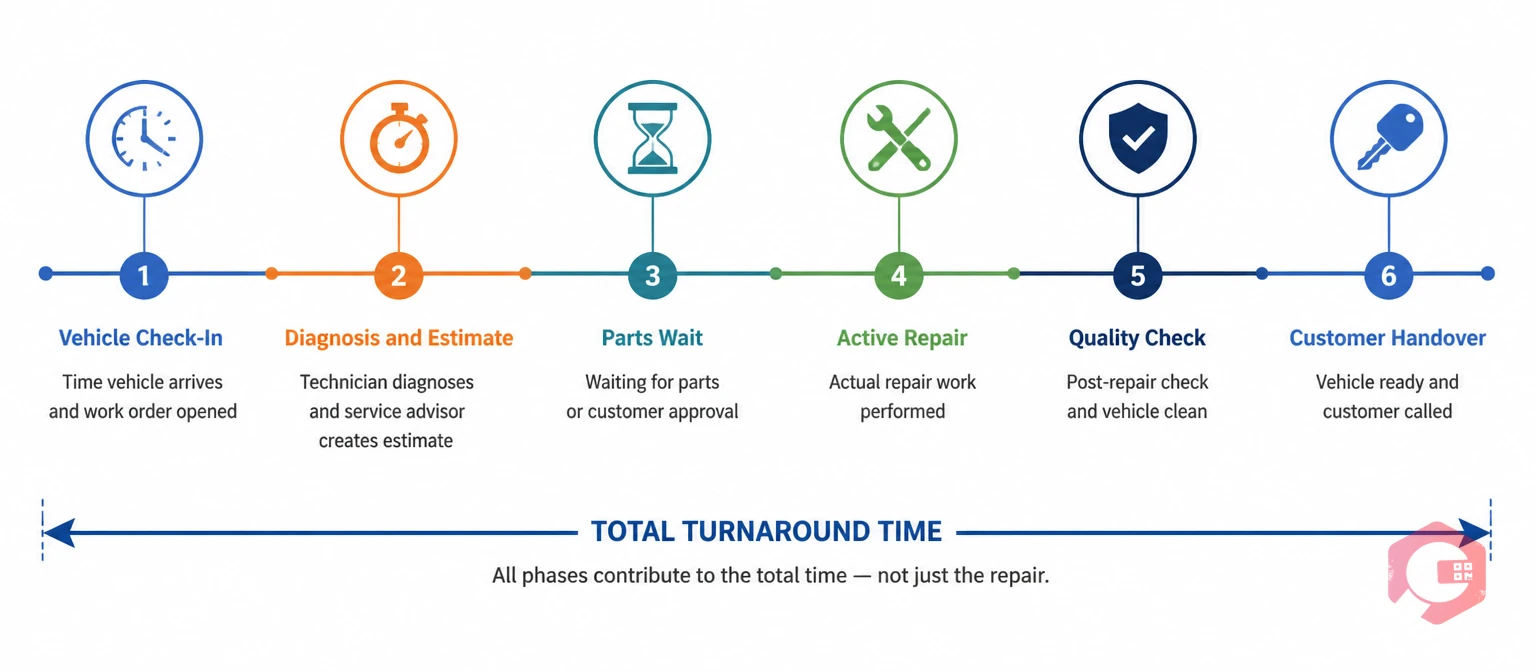
Most dealerships measure turnaround time as the gap between repair order open time and close time. That’s a reasonable starting point — but it captures total elapsed time, not active work time. The distinction matters enormously when you’re trying to improve performance.
A vehicle that spent 5 hours at the dealership but only 90 minutes under active work has a turnaround time of 5 hours and an active work time of 1.5 hours. The 3.5-hour gap is entirely composed of wait — parts retrieval, technician availability, customer approval, quality inspection. If you only track the 5-hour total, you’ll never know where the 3.5 hours went, and you’ll never know which interventions will actually help.
Work order management software timestamps every stage of a job — assignment, start, pause (with reason), resume, completion — creating a granular activity record that separates active time from wait time. That granularity is what turns turnaround time from a lagging indicator into a diagnostic tool.

Before you can reduce turnaround time, you need to know which category of delay is dominant in your operation. Five categories account for the vast majority of non-productive wait in dealership service centers.
A technician who cannot start or continue a job because a required part hasn’t arrived from the parts department is the single most common source of turnaround delay in franchised dealerships. Parts waits are particularly damaging because they’re invisible in standard DMS reporting — the repair order shows the vehicle as “in process” while it sits idle for 45 minutes waiting for a filter that was supposed to be pre-staged.
CMMS job pause logs capture this explicitly: when a technician pauses a job and selects “waiting for parts” as the reason, that timestamp and duration are recorded against the job. Over 30 days, the pattern becomes undeniable — and actionable.
Idle time between job completion and the next assignment is the second major category. In dealerships without real-time job assignment visibility, technicians often complete a job and then walk to the service desk to find their next ticket — a process that can consume 10–20 minutes per job transition. Multiply that by 6–8 job transitions per technician per day and you lose 60–160 minutes of productive capacity per technician, per day.
Diagnostics — particularly on modern vehicles with complex electronic systems — often take longer than planned, and that overrun cascades into every subsequent job in the bay. Diagnostic delays are harder to eliminate than parts waits because they’re partly inherent to the job, but CMMS data identifies which job types consistently overrun their flat-rate time, flagging where additional technician training or specialist allocation would reduce the delay.
Many repair jobs require customer approval for additional work discovered during the service. The time between the technician completing diagnosis and the customer authorizing additional work is a pure wait — the vehicle sits, the bay is occupied, and nothing productive happens. In the worst cases, this lag runs 30–60 minutes per occurrence. CMMS work order logs capture the time between “awaiting approval” status and “approved” status, making this category visible and measurable for the first time for many service managers.
A vehicle returned to the bay for re-work after an initial quality failure doubles the turnaround time for that repair order and blocks the bay for a second cycle. First-fix failure rate is often tracked informally, but CMMS data allows precise measurement — any repair order that generates a second work order within a defined window is flagged automatically as a re-work event. Reducing re-work by even 2–3 percentage points produces significant throughput gains across the week.
Each bottleneck category has a corresponding CMMS metric that quantifies its impact. Here’s the direct mapping, along with benchmarks to use as targets:
| Bottleneck | CMMS Metric to Pull | Target Benchmark |
|---|---|---|
| Parts Wait Time | Average job pause duration with reason “parts wait” per bay, per job type | Under 15 minutes per occurrence; fill rate above 88% |
| Technician Idle Time | Time between job close and next job assignment per technician | Under 10 minutes average between jobs |
| Diagnostic Overrun | Actual diagnostic time vs. flat-rate time by job type and technician | Within 20% of flat-rate time on 85%+ of jobs |
| Approval Lag | Time in “awaiting authorization” status per repair order | Under 20 minutes average; flag any over 45 minutes |
| Re-work Rate | Percentage of jobs generating a return work order within 7 days | Under 3% first-fix failure rate |
Running these five reports weekly, per bay and per job type, gives you a ranked list of where turnaround time is being lost. The highest-impact bottleneck in your operation this week is almost always obvious once the data is in front of you.
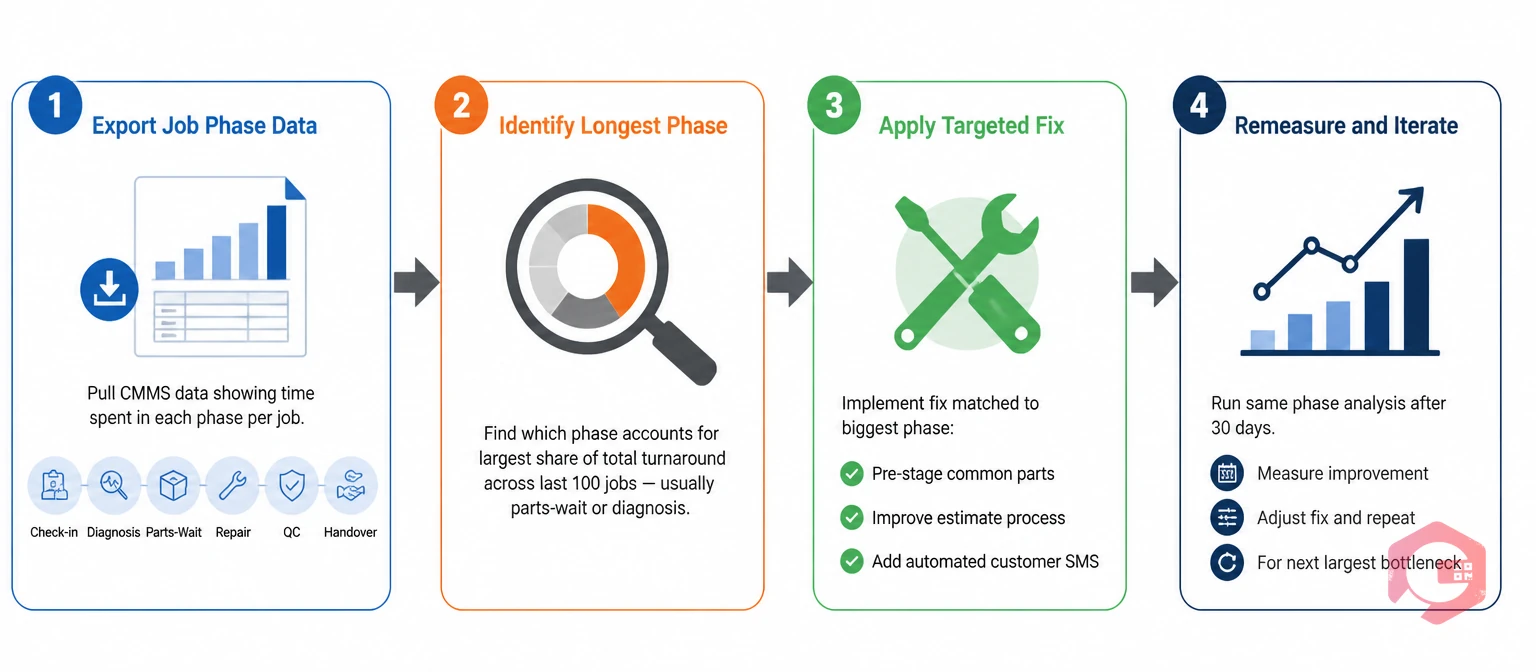
Having the metrics is step one. Converting them into reduced turnaround time requires a three-step diagnostic and action loop.
Start by pulling a 30-day baseline of average turnaround time segmented by bay, job type, and shift. This baseline will almost certainly reveal that turnaround time varies significantly across bays and shifts — a finding that’s invisible in a dealership-wide average. Bay 2 on Tuesday mornings may run at 4.8 hours average while Bay 5 on the same shift runs at 2.6 hours. That gap is where the investigation starts.
The BI Dashboard makes this segmentation straightforward — service managers can filter by bay, job type, technician, and time range to build the baseline view in minutes rather than pulling and cross-referencing multiple DMS reports manually.
Once the underperforming bay-shift combinations are identified, drill into the five bottleneck metrics for those specific combinations. If Bay 2 on Tuesday mornings shows an average parts wait time of 38 minutes per job — versus 11 minutes for Bay 5 — you’ve found the dominant bottleneck. The fix is now a parts staging and sequencing problem, not a technician performance problem.
This specificity matters because the wrong diagnosis produces the wrong intervention. Many dealerships respond to high turnaround time by pressuring technicians to work faster — which doesn’t help when the actual problem is a 38-minute parts wait that no amount of technician effort can reduce. CMMS data removes the guesswork and points directly at the structural cause.
With the bottleneck identified and the fix implemented — say, a pre-staging process that puts parts at the bay before the vehicle arrives — re-run the same metrics after two weeks to measure the delta. Did average parts wait time drop from 38 to 14 minutes? Did overall turnaround time for Bay 2 Tuesday mornings improve from 4.8 to 3.1 hours? The CMMS data answers both questions definitively, confirming whether the intervention worked or whether a second bottleneck has become dominant.
According to McKinsey’s automotive service operations research, dealerships that use structured data-driven bottleneck analysis reduce average repair cycle time by 18–24% within the first two quarters — without adding technician headcount or physical bay capacity.
Most discussions of turnaround time focus on active repair jobs. But the condition of the service bays and equipment themselves also affects throughput — a lift that fails mid-job, a diagnostic tool that needs recalibration, or a compressed air system with a pressure problem all create unplanned delays that push every subsequent job in the queue.
A preventive maintenance schedule for service bay equipment — lifts, diagnostic stations, wash equipment, compressors — reduces these unplanned interruptions directly. When bay equipment is maintained on a scheduled cycle rather than repaired after failure, mid-job equipment failures drop significantly. In a service center running 8–10 vehicles per bay per day, even one prevented equipment failure per week recovers 2–4 hours of bay capacity that would otherwise be lost to reactive repair and reshuffling.
The PM scheduling module also forecasts upcoming maintenance windows, allowing service managers to schedule bay downtime during low-demand periods rather than having equipment fail at peak hours on a busy Friday morning.
The difference between a service center managing turnaround time by instinct versus one using CMMS data systematically shows up across every operational metric, not just the turnaround number itself:
| Metric | Without CMMS Data | With CMMS Data |
|---|---|---|
| Bottleneck identification | Guesswork — usually blamed on technicians | Data-specific — parts wait, approval lag, or idle time pinpointed within minutes |
| Intervention timing | End-of-day review — problems already happened | Real-time alerts when jobs exceed time thresholds mid-day |
| Parts staging | Reactive — retrieved when technician requests | Proactive — pre-staged from PM schedule and booked appointments |
| Technician utilization | Typically 55–65% productive time | 70–80% productive time with idle-time tracking and rapid re-assignment |
| Re-work rate | Tracked informally, if at all | Measured precisely; root cause logged per occurrence |
| Average turnaround time | 3.2–4.5 hours (industry average range) | 2.2–3.0 hours with systematic bottleneck elimination |
The shift isn’t just about the turnaround number. Faster turnaround means more vehicles completed per bay per day, higher same-day completion rates, better CSI scores, and — for service departments that price on flat-rate time — more jobs completed per shift without adding capacity.
Cryotos CMMS gives dealership service teams the operational data infrastructure to manage turnaround time proactively rather than reactively. Every work order is timestamped at assignment, start, each pause (with mandatory reason code), resume, and completion — creating the activity record that separates active work time from wait time and makes bottleneck identification precise.
The BI Dashboard displays live bay-level turnaround metrics — current average time-in-bay per job type, jobs approaching threshold, and real-time pause-reason distribution — so service managers can intervene mid-day rather than discovering problems in the end-of-day DMS summary. When a job crosses the expected completion time, an automated alert fires to the assigned service advisor and the manager, creating an immediate response loop rather than a post-mortem.
The inventory management module connects parts availability directly to the work order queue. When a PM job or scheduled service is booked, the parts required for that job are flagged against current stock levels in advance — enabling pre-staging before the vehicle arrives rather than retrieval after the technician discovers the part is missing. This single integration eliminates a significant share of parts-wait delays in one configuration step.
The Report Builder generates weekly bottleneck summaries automatically — parts wait time per bay, technician idle time by shift, approval lag by service advisor, and re-work rate by job type — so the service manager walks into Monday morning’s team meeting with the week’s data already formatted and ready, not a blank screen and a manual pull. Teams using Cryotos report a 30% reduction in unplanned downtime and measurable improvement in repair throughput within the first quarter.
For multi-rooftop dealer groups, Cryotos gives the fixed operations director a consolidated view across all locations — showing which sites are achieving turnaround targets and which need intervention — from a single dashboard without site visits or manual data consolidation.
For express and quick-service jobs (oil change, tyre rotation, basic service), a turnaround target of 60–90 minutes is achievable and expected by customers who wait on-site. For mechanical repairs and standard services, 2.5–3.5 hours is a strong target. Multi-day jobs are a separate category where daily communication SLAs matter more than total turnaround time. The right target for your operation is the one that reflects your current technician capacity — set it based on your best-performing bay, not your average, and build toward making every bay match that performance.
Parts wait time typically has the highest single-metric impact, because it affects every job category and every bay simultaneously. Reducing average parts wait from 35 minutes to 12 minutes per job — by pre-staging parts against the booked appointment schedule — can cut overall average turnaround time by 20–30 minutes across the operation without changing any other variable. After parts wait, technician idle time between jobs is usually the second-highest opportunity, particularly on high-volume days with 8–10 vehicles per bay.
Yes — and same-day completion rate is directly linked to turnaround time management. A service center with an average turnaround of 4.5 hours can complete significantly fewer same-day jobs than one averaging 2.8 hours, simply because each bay processes fewer vehicles per shift. CMMS data identifies which job types are most likely to push into the next day — typically diagnostic-heavy jobs and jobs awaiting customer approval — allowing service managers to triage same-day bookings and allocate capacity accordingly.
Most dealerships see measurable improvements within 30–60 days of CMMS implementation, once work orders are being timestamped consistently and the first 30-day bottleneck report is available. The first improvement is typically in parts wait time — because it’s the most visible bottleneck in the data and the fix (pre-staging against the appointment schedule) can be implemented within a week. Approval lag improvements take longer because they require process changes with service advisors. Re-work rate improvements typically require 60–90 days as technician training and quality checks take effect.
Reducing vehicle turnaround time isn’t about pressuring technicians to work faster — it’s about eliminating the 40–60% of elapsed time that isn’t active work at all. Parts waits, technician idle time, approval lags, diagnostic overruns, and re-work are all measurable, all addressable, and all invisible without the right data infrastructure behind them.
CMMS data turns turnaround time from a lagging metric you discover at the end of the day into a live operational signal you can act on before the problem compounds. If your service department is ready to move from instinct-driven scheduling to data-driven throughput management, Cryotos CMMS gives you the work order timestamping, bottleneck reporting, and real-time alerts to make that shift. Book a free demo today and see where your turnaround time is actually going.


Cryotos AI predicts failures, automates work orders, and simplifies maintenance—before problems slow you down.


