Risk-based inspection (RBI) is a method that ranks assets by the likelihood and consequence of failure, then sets inspection and maintenance priorities to match. It puts your limited time and budget on the equipment that can hurt safety, output, or cost the most.
In asset-intensive industries like manufacturing, energy, and utilities, a surprise failure means downtime, lost production, and sometimes safety or environmental harm. With hundreds or thousands of assets, it is hard to know where to start. This guide shows how to turn a risk ranking into a prioritized maintenance plan in five steps, and how a computerized maintenance management system (CMMS) keeps the plan running.
Key Takeaways
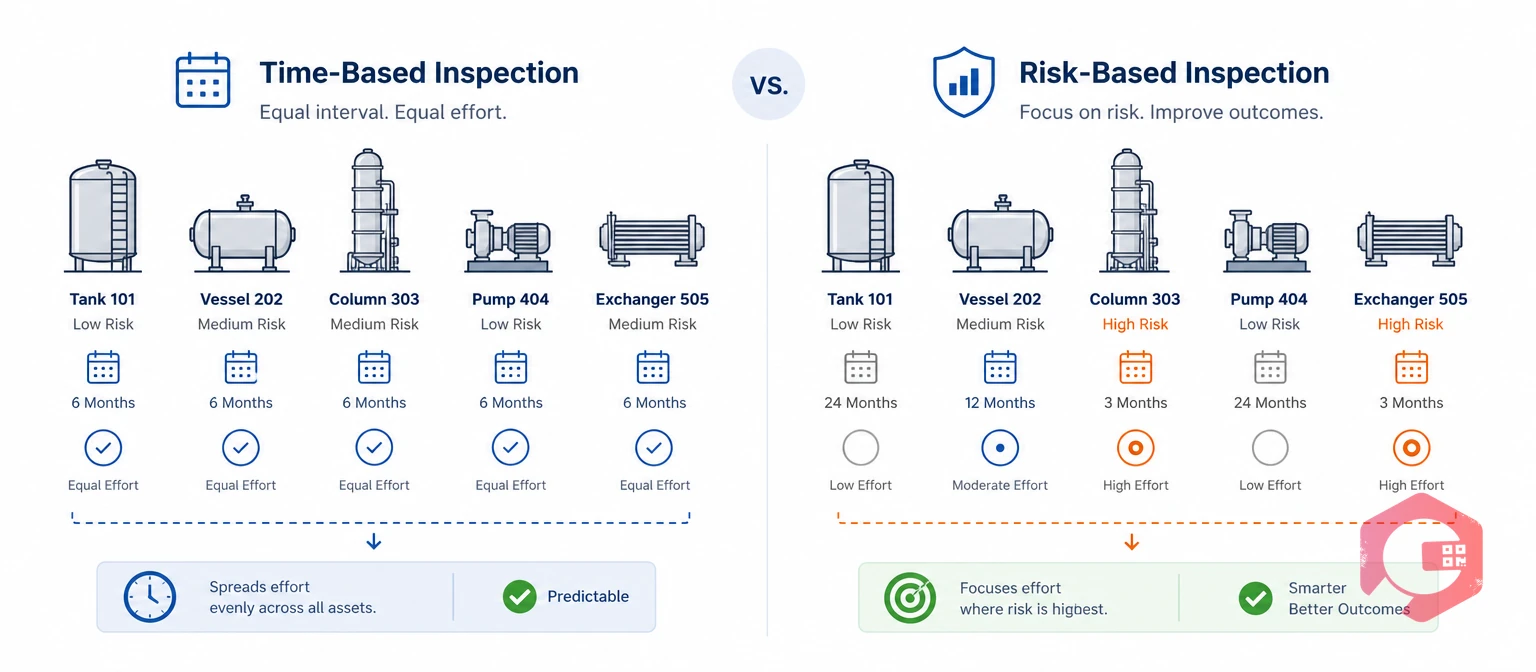
Time-based programs inspect every asset on the same calendar. Risk-based programs vary effort by risk. The table shows the main differences.
| Attribute | Time-Based Inspection | Risk-Based Inspection |
|---|---|---|
| Basis for frequency | Calendar or equipment age | Likelihood and consequence of failure |
| Where effort goes | Spread evenly across assets | Focused on the highest-risk assets |
| Data needed | A basic asset list | Failure history, condition data, and consequence information |
| Typical weakness | Over-inspects low-risk assets and under-inspects high-risk ones | Needs good data and regular review |
| Result | A predictable but wasteful schedule | A targeted plan that changes as risk changes |
The goal is not to inspect less. It is to inspect smarter, with more attention where failure would cost the most.
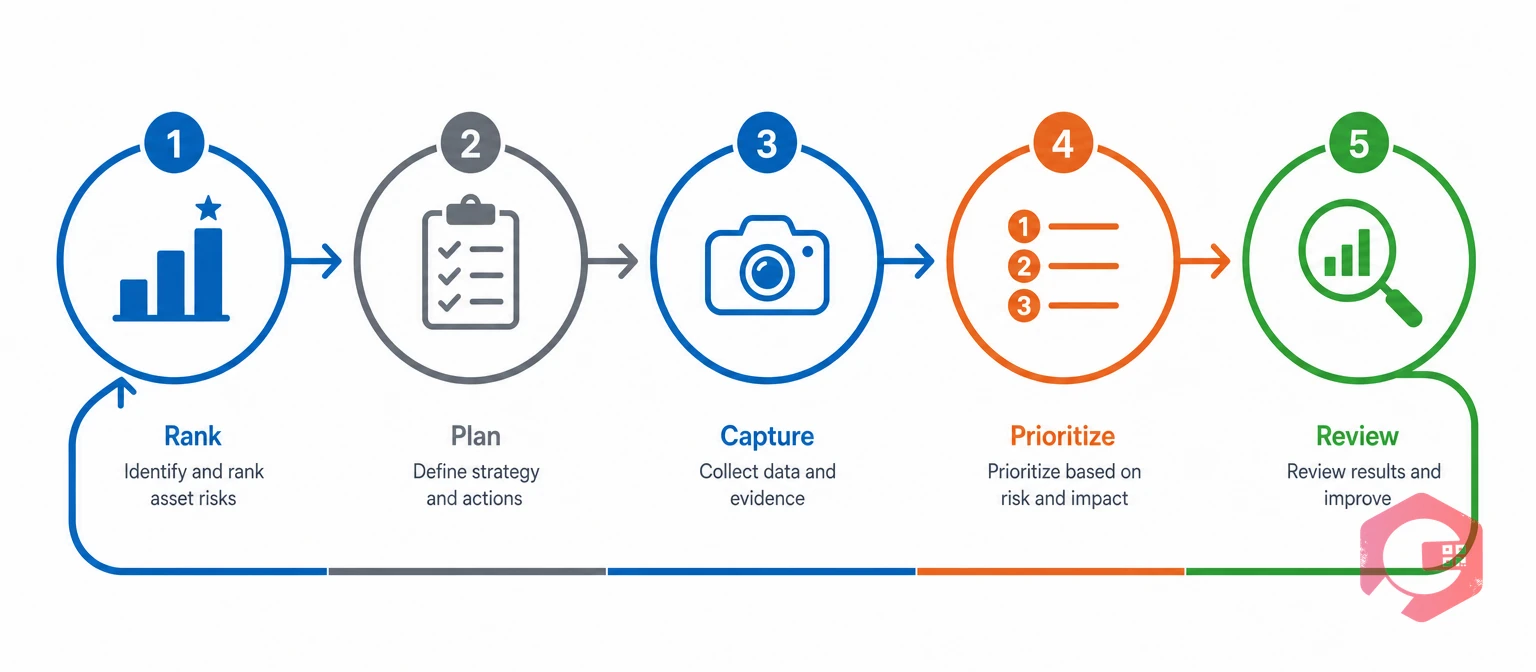
The Risk-to-Work Method is a five-step cycle that turns a risk ranking into scheduled, prioritized maintenance. The steps are:
Formal RBI for pressure equipment follows API RP 580 and API RP 581. The method here applies the same logic in a simpler form to the wider asset base, such as pumps, drives, conveyors, and building systems.
Start by scoring every asset on two questions. How likely is it to fail? How bad is the result if it does? Use a simple 1 to 5 scale for each, then multiply.
This illustrative risk register shows the idea. Scores here are examples, not data from a real plant.
| Asset | Likelihood (1-5) | Consequence (1-5) | Risk Score | Tier |
|---|---|---|---|---|
| Boiler feed pump | 4 | 5 | 20 | A |
| Overhead conveyor drive | 3 | 4 | 12 | B |
| Cooling water pump with standby | 4 | 2 | 8 | B |
| Air receiver | 2 | 3 | 6 | C |
| Office HVAC unit | 2 | 1 | 2 | C |
In this example, Tier A is a score of 15 to 25, Tier B is 8 to 14, and Tier C is 1 to 7. Set your own tier cutoffs to match your risk appetite.
Cryotos asset tracking holds the asset hierarchy, history, and criticality level, so the ranking sits next to the maintenance record.

Each tier gets a different level of attention. A simple starting point looks like this:
Write the reason for each frequency into the plan. That reasoning helps when an auditor or a new engineer asks why an asset gets the schedule it does. Use preventive maintenance software to turn each tier's plan into recurring tasks.
Inspection results update your view of each asset's likelihood of failure. They only help if they are recorded the same way every time. Inspections may include visual checks, non-destructive testing, performance readings, and lubrication analysis.
Build standard maintenance checklists so every inspector records findings the same way:
Vibration, leaks, corrosion, and falling performance are early warning signs. Capturing them digitally builds an audit trail for failure analysis and compliance.
A finding on a Tier A asset is not the same as a finding on a Tier C asset. Set work order priority from two inputs: the asset's risk tier and the severity of the finding.
This illustrative priority matrix shows one way to do it. Set your own timeframes to match your operation.
| Risk Tier | Minor Finding | Moderate Finding | Severe Finding |
|---|---|---|---|
| Tier A | Schedule within the week | Fix within 48 hours | Act now: make safe and repair |
| Tier B | Next planned window | Schedule within the week | Fix within 48 hours |
| Tier C | Add to routine PM | Next planned window | Schedule within the week |
Illustrative scenario: an inspector finds moderate wear on a boiler feed pump (Tier A) and on an office HVAC unit (Tier C). The matrix sends the pump to a fix within 48 hours and puts the HVAC unit in the next planned window. The same finding gets a different response because the consequence differs.
A CMMS makes the matrix routine. With work order management, a failed inspection check can open a corrective work order with the asset, finding, and photos already attached.
RBI is not a one-time project. Conditions change, so rankings must change too. Track a small set of measures to see if the program is working:
Re-rank after a major failure, a process change, a serious inspection finding, or a change in redundancy. A maintenance KPI dashboard shows these measures in one view and highlights overdue high-risk work.
Most RBI programs fail in data and follow-through, not in the scoring. Maintenance teams that succeed avoid these habits:
These are cheap to fix and prevent the surprise failures RBI is meant to stop.
Cryotos does not calculate formal risk scores. Your reliability team or RBI software does that. Cryotos makes sure the plan is carried out and recorded:
Maintenance teams using Cryotos have reported up to 30% reduction in unplanned downtime and 25% faster repair turnaround. These are general results across maintenance programs, not RBI-specific figures. For RBI, the practical gain is that high-risk inspections get done on time and every result is on record.
Risk-based inspection plans inspections by risk instead of by calendar. Assets that are more likely to fail, or would cause more harm if they did, are inspected more often and more closely.
Time-based inspection treats every asset the same on a fixed schedule. Risk-based inspection changes the frequency and depth by likelihood and consequence of failure.
Score each asset for likelihood and consequence, often on a 1 to 5 scale, and multiply the two. Group the results into tiers, such as A, B, and C, and plan work by tier.
Review them on a regular cycle and after any major failure, process change, or key inspection finding. Rankings that never change soon stop matching reality.
Not for a simple tiered approach. A spreadsheet can hold the scores. Formal quantitative RBI on pressure equipment usually uses dedicated software and follows API RP 580 and 581.
No. RBI software or engineers calculate risk. A CMMS schedules the inspections, captures the results, and tracks the follow-up work.
A risk ranking only protects your plant when the work gets done. Schedule a free demo to see how Cryotos schedules risk-based inspections, captures findings in the field, and turns them into prioritized work orders.



Cryotos AI predicts failures, automates work orders, and simplifies maintenance—before problems slow you down.