

Spare parts inventory management for car dealerships is the process of tracking, ordering, and controlling the parts stock held in a dealership's parts department to ensure the right parts are available when needed — without tying up capital in stock that never moves. Done well, it directly cuts two of the most damaging costs a parts manager faces: dead stock (parts that sit unsold for months) and emergency orders (unplanned, rush purchases that carry a 20–40% price premium). According to the National Automobile Dealers Association (NADA), the average franchised dealership holds between 15% and 25% of its parts inventory as slow-moving or obsolete stock — a quiet but significant drain on working capital.
This guide breaks down the root causes of dead stock and emergency orders, shows you the KPIs that matter, and gives you a practical framework for controlling parts inventory — whether you're managing a single rooftop or a multi-franchise operation.

Dead stock refers to parts that have been purchased, stored, and not sold or used within a defined period — typically 12 months. Unlike slow-moving parts, which still generate occasional demand, dead stock has effectively zero turn rate and represents a permanent carrying cost with no offsetting revenue.
These two terms often get used interchangeably, but the distinction matters for how you handle each category:
The practical rule: if a part hasn't moved in a year, treat it as dead stock and act on it. Waiting rarely helps.
Dead stock doesn't appear randomly. It almost always traces back to one of these root causes:
Most dealerships track gross profit per repair order but rarely quantify the cost of inventory mismanagement directly. When you add it up, the numbers are significant.
The carrying cost of parts inventory covers more than the price you paid for the part. Industry benchmarks from the McKinsey Automotive practice put total carrying costs at 20–30% of inventory value annually. That means a dealership carrying $200,000 in dead parts is losing $40,000–$60,000 per year in carrying costs alone — before accounting for the capital tied up that could fund more profitable inventory.
Carrying costs typically include: cost of capital (the opportunity cost of money tied up in stock), storage and warehouse space, inventory insurance, parts obsolescence write-offs, and labor for cycle counting and auditing dead stock.
Emergency orders — rush purchases placed outside the normal replenishment cycle — carry a significant cost premium. Dealers typically pay 20–40% above standard part pricing for expedited shipments, plus additional freight charges. For a parts department processing 10–15 emergency orders per month, that premium adds up to $15,000–$25,000 in unnecessary spend annually on a mid-sized operation.
Beyond the direct cost, emergency orders disrupt workflow: they require someone to chase the order, coordinate delivery, and communicate timing to the technician and the customer. Every emergency order is evidence of a forecasting failure upstream. Fixing the forecast eliminates the emergency.
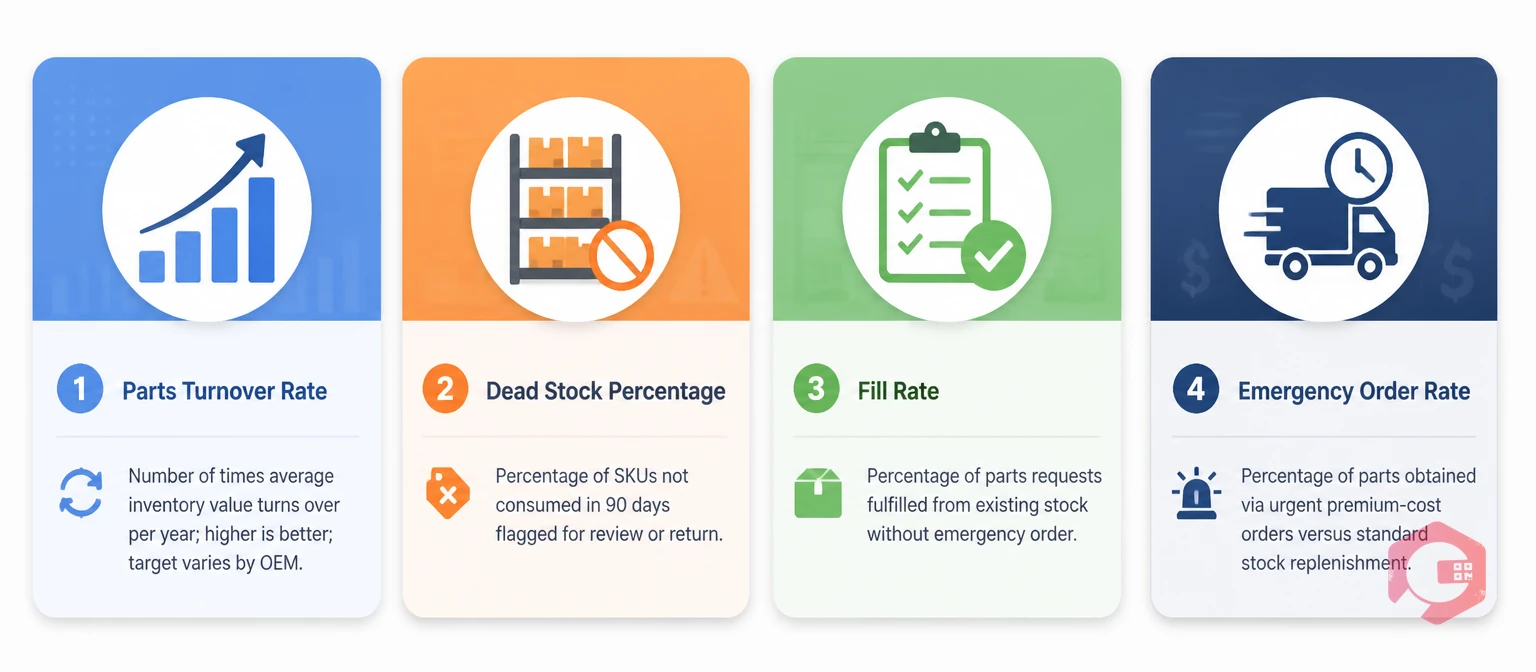
You can't manage what you don't measure. These are the five KPIs with the clearest link to dead stock and emergency order control:
| KPI | Definition | Target Benchmark |
|---|---|---|
| Parts Fill Rate | Percentage of parts requests fulfilled from current stock without a special order | 85–92% |
| Inventory Turn Rate | How many times your parts inventory cycles through in a year (COGS ÷ Average Inventory Value) | 4–8 turns/year for franchised dealers |
| Dead Stock Percentage | Value of parts with zero movement in 12+ months as a % of total inventory value | Below 10% |
| Emergency Order Rate | Percentage of total orders that are rush/unplanned purchases | Below 5% |
| Return-to-Vendor Rate | Percentage of dead or slow stock returned to the OEM or supplier under return programs | Track monthly; aim to use 100% of available return allowance |
If your dead stock percentage is above 15% or your emergency order rate exceeds 10%, those are the two numbers to attack first. Everything else follows.
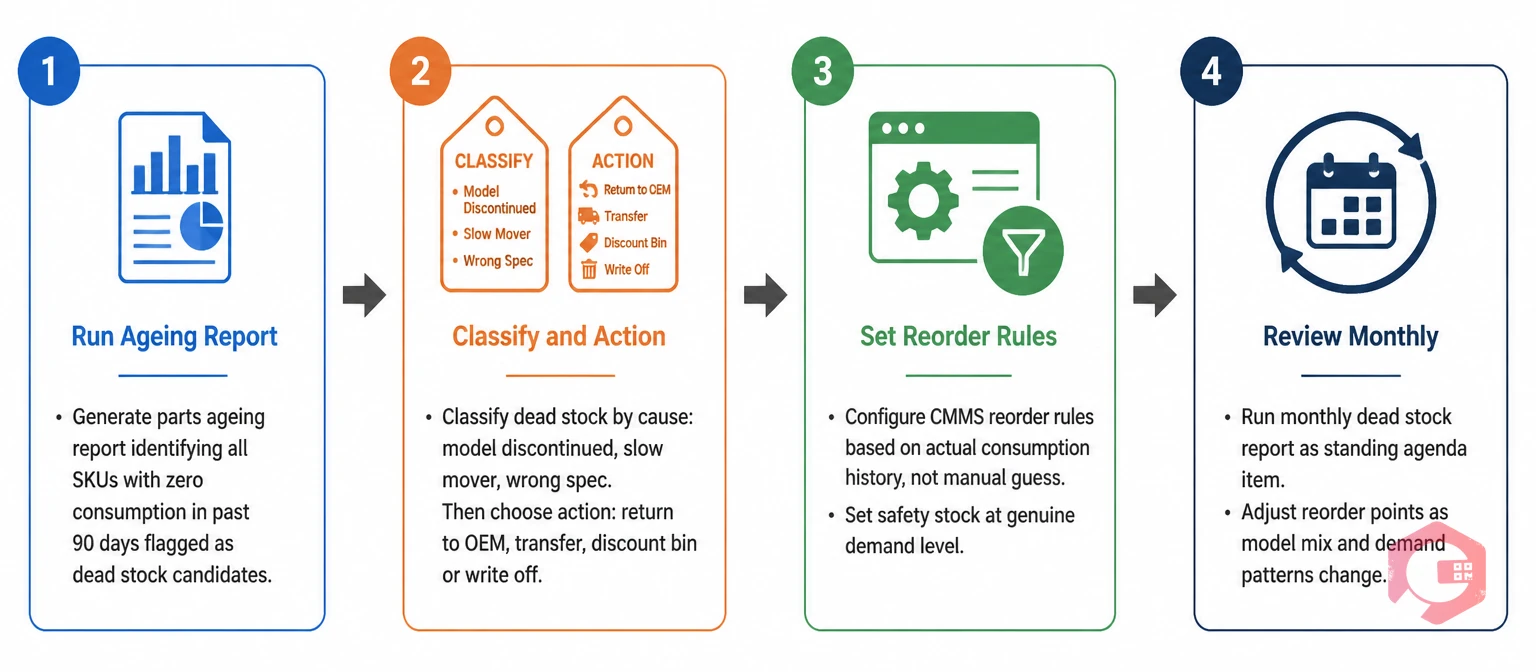
Reducing dead stock is a three-step process: find it, stop creating more of it, and exit the stock you have. Here's how to work through each step.
A velocity analysis ranks every part in your inventory by movement frequency over the past 12 months. Parts get sorted into groups: fast movers (A-class), moderate movers (B-class), slow movers (C-class), and no-movers (dead stock). Most dealership management systems (DMS) can generate this report — the challenge is acting on it.
Once you have the list of no-movers, categorize them: Is there still an OEM return program available? Can the part be transferred to another rooftop in the dealer group? Can it be liquidated through an aftermarket channel? Parts that can't be returned, transferred, or sold should be written down. Holding them longer doesn't make them more valuable.
Min/max parameters define the floor and ceiling for how many units of each part you hold. The minimum triggers a reorder; the maximum prevents overstock. Setting these numbers correctly requires actual demand history — not a technician's instinct or an OEM rep's suggestion.
For most high-velocity parts, a minimum of 1–2 units and a maximum of 4–6 units (based on 30-day demand) is a reasonable starting point. For low-velocity parts, the maximum should be set at 1 unit or moved to a special-order-only status. The key is to revisit these parameters quarterly, especially after model-year transitions when demand patterns shift significantly.
Most OEM franchise agreements include a parts return allowance — typically 5–15% of annual parts purchases — that allows dealers to return slow-moving or obsolete stock for credit. Most dealers underuse this allowance, leaving money on the table. Make it a monthly or quarterly discipline: review slow movers against the return eligibility window and submit returns before the deadline.
For parts outside OEM return programs, explore third-party aftermarket distributors or inter-dealer trading networks. Even recovering 40–50 cents on the dollar is better than holding parts to zero value and eventually writing them off entirely.
The instinct when cutting emergency orders is to worry about service levels dropping — customers waiting longer, technicians idle, workshop throughput falling. That fear is valid but addressable. The goal isn't to eliminate emergency orders entirely; it's to replace reactive ordering with a system that anticipates demand before it becomes urgent.
A reorder point (ROP) is the inventory level at which a replenishment order is automatically triggered. It's calculated as: ROP = (Average Daily Usage × Lead Time in Days) + Safety Stock. When stock hits the reorder point, a purchase order is generated — before you run out, not after. This single change eliminates most emergency orders for parts with predictable demand patterns.
For a part used 2 units per day with a 3-day supplier lead time and 1-unit safety stock, the reorder point is 7 units. When stock hits 7, the order goes out. You never drop to zero, and you never pay emergency freight. The math is straightforward; the discipline is in keeping the demand data current.
One of the most underused demand signals in a dealership parts department is the preventive maintenance schedule. When service appointments are booked in advance — oil changes, scheduled services, tire rotations — the parts required for those jobs are known days or weeks ahead. That's enough lead time to stock the parts on a standard order, not an emergency one.
Linking your parts ordering process to your service scheduling system creates a pull-based demand signal rather than a push-based "order what we ran out of" reaction. Dealerships that connect these two systems consistently report emergency order rates below 5% — well below the industry average. This is exactly the kind of integration that inventory management software with work order linkage makes possible.
OEM service campaigns — recall work, technical service bulletins, and scheduled maintenance campaigns — are predictable demand events. You know the campaign is coming, you know which parts it requires, and you know roughly how many vehicles in your customer base are affected. That's a forecast, not a guess.
Build a campaign review into your monthly ordering cycle. When a new campaign launches, pull the affected VIN range, estimate the participation rate, and pre-stock accordingly. This single habit can reduce campaign-related emergency orders to near zero and significantly improve first-visit fix rates, which directly impacts customer satisfaction scores.
Many dealerships still rely on a combination of DMS reports, spreadsheets, and tribal knowledge to manage parts inventory. Here's how that compares to a structured, CMMS-driven approach:
| Feature | Manual / DMS-Only Process | CMMS-Driven Process |
|---|---|---|
| Dead Stock Identification | Monthly DMS report — reviewed when someone has time | Automated alerts when parts cross the no-movement threshold |
| Reorder Triggers | Manual check — often discovered after stockout | Automatic reorder point alerts; purchase order generation |
| Parts Demand Forecasting | Based on recent memory or spreadsheet history | Historical usage data + PM schedule linkage for forward demand |
| Emergency Order Visibility | Tracked informally, if at all | Every emergency order logged, with root cause visible |
| Min/Max Parameter Updates | Updated quarterly at best — often set and forgotten | Recalculated automatically based on rolling usage data |
| Parts-to-Work Order Linkage | Manual cross-reference between systems | Direct link — parts consumed against work orders in real time |
The gap isn't just about convenience. It's about data latency. Manual processes surface problems after they've already cost you money. A CMMS surfaces them before the cost is incurred.
Cryotos CMMS gives dealership parts teams the visibility and automation they need to keep dead stock in check and emergency orders under control. The spare parts inventory software module tracks every part in real time — by location, quantity, cost, and movement frequency — using QR code scanning and barcode integration. When stock drops to the minimum threshold, the system fires an alert before you hit zero.
The PM scheduling engine links directly to parts consumption, so when a technician logs a PM job, the parts used are automatically deducted from inventory and future scheduled jobs flag the parts they'll need. This creates a demand-pull signal that feeds directly into your ordering cycle — replacing the reactive "we ran out" trigger with a forward-looking forecast. The result: teams using Cryotos report a 30% reduction in downtime and significantly fewer unplanned emergency purchases.
The warehouse management feature maps your storage locations — aisles, racks, shelves, bins — so parts are always findable, cycle counts are faster, and receiving errors are caught at the point of entry. For dealerships with multiple service bays or a multi-rooftop operation, Cryotos gives you one consolidated view across all locations — no more calling around to find out if another store has the part you need.
The Report Builder lets you generate on-demand velocity analysis reports, dead stock summaries, and emergency order logs — giving your parts manager the data to make smart purchasing decisions every week, not just at month-end. You can also schedule automated reports to land in your inbox every Monday morning, so inventory health is always visible without anyone having to remember to pull it.
A healthy dead stock rate is below 10% of total parts inventory value. Most well-managed franchised dealerships target 5–8%. If your dead stock rate exceeds 15%, that's a signal to run a full velocity analysis and activate your OEM return program immediately. Rates above 20% typically indicate systemic ordering process problems, not just one-off purchasing errors.
Carrying cost is calculated as: Carrying Cost = Dead Stock Value × Annual Carrying Rate. The annual carrying rate for dealership parts typically runs 20–30%, covering cost of capital, storage, insurance, and obsolescence risk. For example, $150,000 in dead parts at a 25% carrying rate costs $37,500 per year to hold — not counting any write-down when those parts are eventually disposed of.
An emergency order is a rush purchase placed because a part wasn't stocked and is needed immediately for a customer repair. You pay a premium for expedited shipping, and the cost of that premium is a direct result of a forecasting or stocking failure. A backorder, by contrast, is a part that was on your standard order but is currently unavailable from the supplier — typically due to OEM supply constraints. Backorders are a supplier problem; emergency orders are an internal process problem. Only one of the two is within your control to fix.
Best practice is a rolling cycle count rather than a single annual physical inventory. Divide your parts into groups and count a different group each week, so the entire inventory is physically verified every quarter. High-value and high-velocity parts should be counted more frequently — monthly or even weekly for the top 20% of SKUs by value. According to NADA guidance, dealerships that use cycle counting rather than annual counts report significantly fewer inventory discrepancies and faster detection of shrinkage.
Dead stock and emergency orders are two sides of the same coin: both are symptoms of a parts inventory process that's reacting to demand rather than anticipating it. The fix is structural — better data, tighter parameters, and a system that connects your parts stock to your service workload before vehicles arrive in the bay.
For dealerships ready to move from spreadsheet-and-memory parts management to a system that actually keeps pace with daily service volume, Cryotos CMMS gives you the inventory visibility, PM linkage, and automated alerts to cut dead stock and take emergency orders from a daily frustration to a rare exception. Book a free demo today and see how your parts department looks with real-time inventory intelligence behind it.




Cryotos AI predicts failures, automates work orders, and simplifies maintenance—before problems slow you down.



