
Weibull analysis and normal MTBF are both reliability tools — but they answer fundamentally different questions. Normal MTBF tells you the average time between failures. Weibull analysis tells you the probability of failure at any specific point in an asset's life. For maintenance teams choosing between these methods, the decision comes down to what you need to know: a single number you can report, or a full failure curve you can act on.
Both tools have a legitimate role. The mistake most maintenance teams make is treating MTBF as a predictive tool when it was designed as a descriptive one — and overlooking Weibull when it would give them the early warning they actually need.
Key Takeaways
MTBF (Mean Time Between Failures) is the foundational reliability metric calculated by dividing total operating time by the number of failures in that period. If a pump runs for 5,000 hours and fails four times, the MTBF is 1,250 hours. Use our MTBF calculator to cross-check your observed intervals against expected baselines.
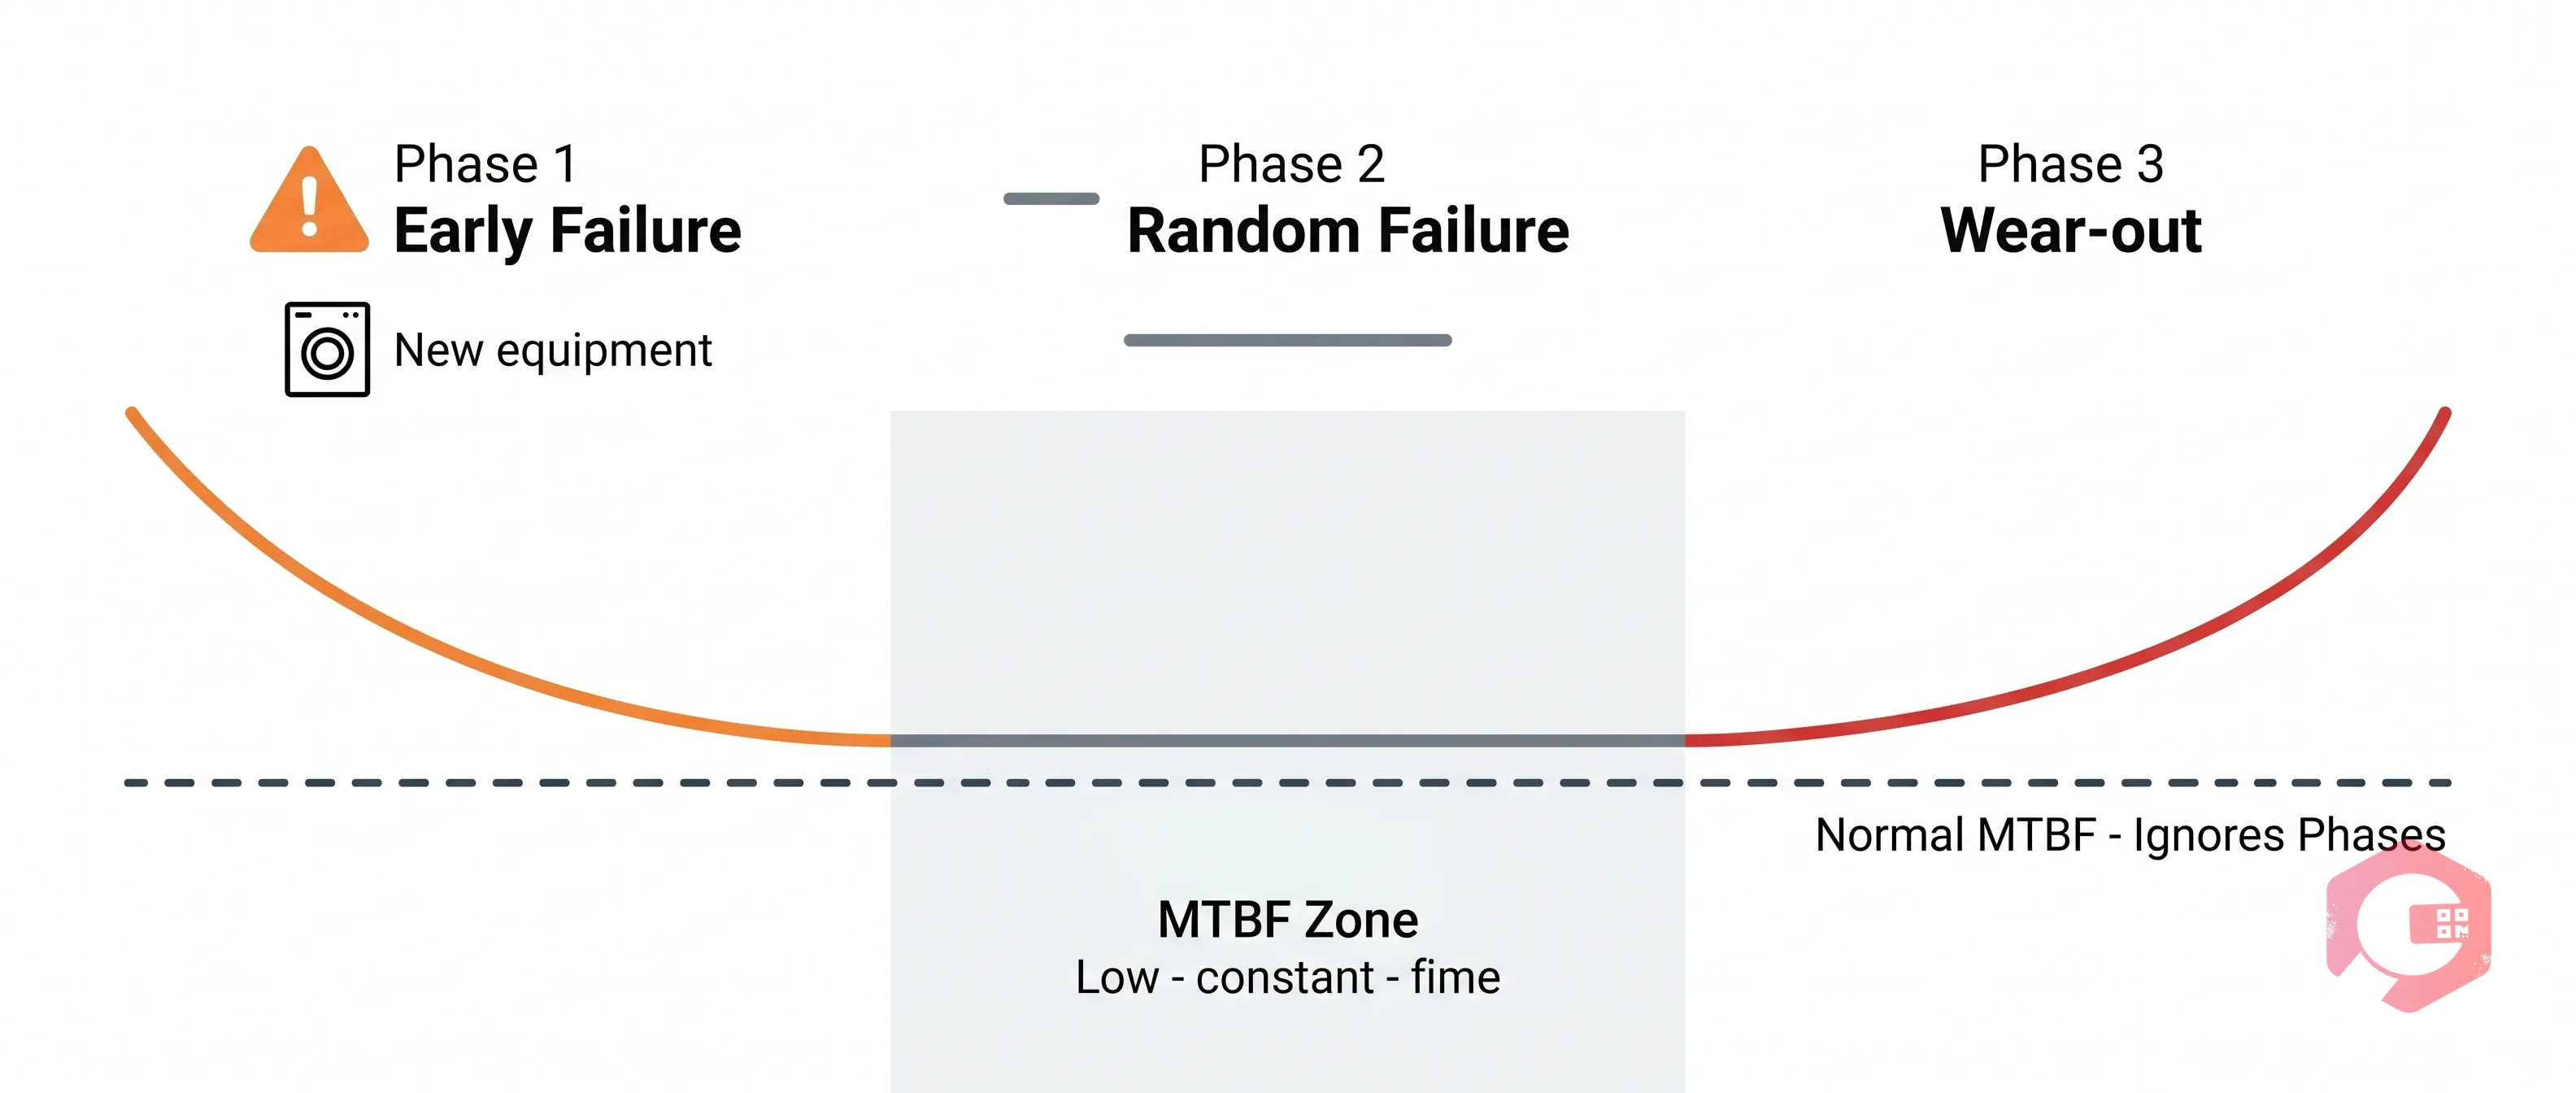
Normal MTBF rests on one critical assumption: the failure rate stays constant across the equipment's entire operating life. That assumption holds during the random failure phase — the middle portion of the classic bathtub curve — but breaks down at either end.
Real equipment follows a bathtub-shaped reliability curve with three distinct phases that normal MTBF treats as one flat line:
For assets still in the random failure phase, normal MTBF is a reliable and efficient tool. For rotating machinery, bearings, seals, and gearboxes that show clear wear-out patterns, it leaves your team operating with an outdated number that gets less accurate with every passing month.
According to ISO 55000, asset decisions should be grounded in both risk and reliability data — yet most maintenance teams are still using flat MTBF averages as their primary reliability input. A Computerized Maintenance Management Software gives you the data infrastructure to move beyond that baseline, but the analytical method matters just as much as the data.
Weibull analysis is a statistical reliability method that uses historical failure data to map the complete failure probability distribution of an asset — not just the average. Instead of producing a single MTBF figure, it generates a curve showing the probability of failure at every point in the asset's operating life.
The analysis uses two primary parameters — extracted by fitting a line through your failure data on a log-log plot:
Together, beta and eta produce a failure probability curve that tells maintenance teams not just when the average asset fails, but what percentage chance of failure they're carrying at 500, 1,000, or 2,000 hours of operation. That precision is what makes Weibull the tool of choice for condition-based maintenance programs and reliability-centered maintenance frameworks alike.
The practical requirement is real failure data — a minimum of 5 to 10 confirmed failure events per asset class. Your CMMS work order history is the primary source, supplemented by IoT sensor logs for assets with continuous monitoring.
| Comparison Factor | Normal MTBF | Weibull Analysis |
|---|---|---|
| Output | Single average — mean time between failures | Full probability curve — failure risk at any operating age |
| Failure Rate Assumption | Constant across all lifecycle phases | Adapts to early, random, and wear-out phases via beta |
| Prediction Accuracy | High during random phase; degrades in wear-out | High across all phases when beta is correctly identified |
| Data Requirement | Total operating hours + failure count | Minimum 5–10 actual failure events with timestamps |
| Best Use Case | KPI dashboards, trend monitoring, executive reporting | PM interval optimization, replacement planning, RCM programs |
| Maintenance Strategy | Schedules based on average past intervals | Schedules based on failure probability at specific operating age |
| Complexity | Simple arithmetic — any technician can calculate it | Requires statistical fitting — Excel or reliability software |
| Reactive vs Proactive | Reactive — describes what already happened | Proactive — predicts failure windows before they arrive |
The table shows the core trade-off clearly: MTBF is easier and faster to calculate, but Weibull gives you more actionable information per data point once you have enough failures to fit the curve.
Track your baseline MTBF alongside Weibull parameters using Cryotos's downtime tracking module — it logs exact failure timestamps and operating hours automatically, giving you the clean data both methods require.

The Weibull vs MTBF Decision Framework comes down to four questions about your operation:
Choose MTBF when you need to establish baseline KPIs quickly, when your equipment shows predominantly random failure patterns, when you're building executive dashboards that show uptime and reliability trends, or when your failure data volume is too low to fit a reliable Weibull curve. MTBF is also the right metric for communicating reliability performance to non-technical stakeholders — it's a single number that anyone can understand.
Choose Weibull when you're running an RCM or predictive maintenance program, when your equipment shows clear age-related failure patterns (rotating machinery, hydraulic systems, bearing assemblies), when you need to set replacement intervals at specific failure probability thresholds rather than averages, or when unplanned downtime carries significant costs. According to ReliabilityWeb, Weibull analysis is the standard method for reliability engineers working with age-to-failure data precisely because it adapts to the failure mode rather than averaging across it.
Most operations do best using both tools in parallel: MTBF for organizational trending and reporting, Weibull for precision PM interval setting on high-criticality, wear-out-prone assets. Use our failure rate calculator to cross-check your MTBF-derived failure rates against your Weibull-predicted curves before finalizing any PM schedule changes.
Maintenance teams that treat Weibull and MTBF as competing methods miss the point. They answer different questions — which means they work best together. The integration runs in three layers.
Aggregate MTBF across your asset population for monthly KPI dashboards, benchmark against OEM specifications, and track improvement trends over time. MTBF at this level gives leadership a single, comparable number that maps directly to uptime percentage and maintenance cost per operating hour.
For high-criticality assets — rotating machinery, drive systems, hydraulic components — run Weibull analysis on your CMMS failure history annually or after every 5 new failure events. Use beta to confirm the failure mode. Use eta and your acceptable failure probability threshold (typically 10–20%) to set the PM replacement interval. Update the PM schedule in your CMMS accordingly.
After implementing Weibull-based PM intervals for a full cycle, compare actual failure events against predicted failure probability. If the Weibull model is accurate, most failures should occur after your replacement interval — confirming the curve is a good fit. If failures consistently arrive earlier, recalculate with updated failure data and tighten the interval.
Maintenance teams using Cryotos have reported up to 30% reduction in unplanned downtime and 25% faster repair turnaround — gains that come directly from replacing generic fixed intervals with data-driven PM scheduling grounded in actual failure history.

Weibull analysis is only as reliable as the failure data behind it — and MTBF is only as useful as the downtime tracking that feeds it. Both methods depend on the same foundation: structured, complete, and accurate failure records captured at the point of repair.
Cryotos builds that foundation through five connected capabilities that support both methods simultaneously:
According to SMRP Best Practices, organizations that apply structured reliability analysis — including Weibull-derived PM intervals — see failure rates decline by 35–45% on high-criticality assets over 24 months. The prerequisite in every case is the same: clean, structured failure data from a CMMS that captures events as they happen.
Absolutely — and most mature maintenance programs do. MTBF provides organization-wide benchmarking and executive dashboards. Weibull drives tactical PM interval setting on specific high-criticality assets. The two methods complement each other: MTBF tells you how your reliability program is performing overall, Weibull tells you exactly when to act on individual asset classes.
A minimum of 5 to 10 confirmed failure events per asset class gives you a workable Weibull result. Twenty or more events produce significantly more accurate parameter estimates. If a single asset doesn't have enough individual failures, combine records from identical assets running under the same operating conditions — same duty cycle, same environment — to build a statistically valid dataset before fitting the curve.
A beta above 1 confirms wear-out failure mode — your asset's failure rate increases with age. This is the most common profile for rotating mechanical components like bearings, seals, and gearboxes. It means time-based preventive replacement at a defined interval is fully justified. Weibull's eta value, combined with your acceptable failure probability threshold (typically 10–20%), tells you exactly what that interval should be.
Facilities that transition from flat MTBF-based intervals to Weibull-optimized schedules typically report 15 to 30% reductions in unplanned downtime and 20 to 35% savings on preventive maintenance labor. The gains are largest on high-criticality rotating machinery where age-related wear is the dominant failure mode and the cost of an unplanned failure is significant.
MTBF is the better tool for executive reporting — it produces a single, easily understood number that maps directly to uptime percentage and maintenance cost. Weibull parameters (beta and eta) are most valuable internally for reliability engineers setting PM intervals. The practical approach is to report MTBF trends to leadership while using Weibull internally to set the schedules that improve those MTBF numbers over time.
Choosing between Weibull and MTBF doesn't have to be an either/or decision — the most effective reliability programs use both. Schedule a free demo to see how Cryotos structures failure capture, downtime tracking, and PM scheduling so your reliability team has the clean data that both MTBF reporting and Weibull analysis demand.


Cryotos AI predicts failures, automates work orders, and simplifies maintenance—before problems slow you down.


