
A work order priority matrix combines two scores into one decision: how urgent the problem is and how critical the asset is. The result is a priority level, usually P1 to P4, that tells technicians and planners which job to start first. To build one, you score asset criticality, define urgency levels, map both onto a grid, and attach a response time to each priority.
Most maintenance teams start with a single priority field that requesters fill in by feel. Soon everything is marked urgent, and the loudest caller wins. This guide walks through seven steps that replace that habit with a repeatable system, including a starter grid, response targets, and override rules.
Key Takeaways
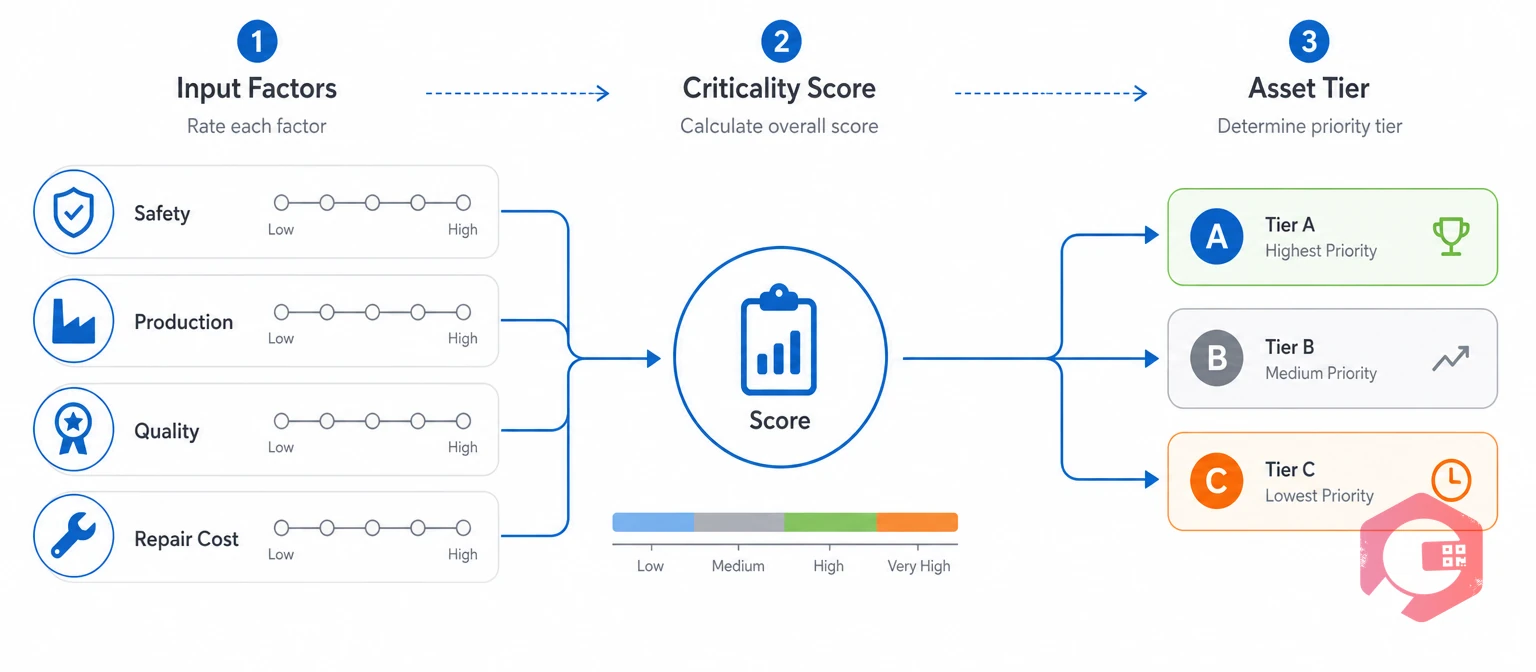
Asset criticality is a rating of how much a failure would hurt safety, production, quality, and cost. Rating it once per asset gives every later priority decision a stable starting point.
The idea is not new. ISO 55000 ties asset decisions to risk and value. Methods such as failure mode and effects analysis (FMEA) and reliability-centered maintenance (RCM) start the same way, by ranking the consequence of failure. A work order priority matrix applies that logic to everyday repair requests.
Score every asset from 1 to 5 on four factors:
Add the four scores and sort assets into three tiers:
A bottling filler that scores 3, 5, 4, and 4 totals 16 and lands in Tier A. An office fan coil that scores 1, 1, 1, and 2 totals 5 and lands in Tier C.
Run the first scoring session with maintenance and operations in the same room, because operations knows what stops production and maintenance knows what is hard to repair. Then store each tier on the asset record, since most Computerized Maintenance Management System platforms let you add a criticality or tier field. A tier stored on the asset means nobody debates criticality while a machine is down.
Honest scores on four factors beat a long debate about one overall rating.
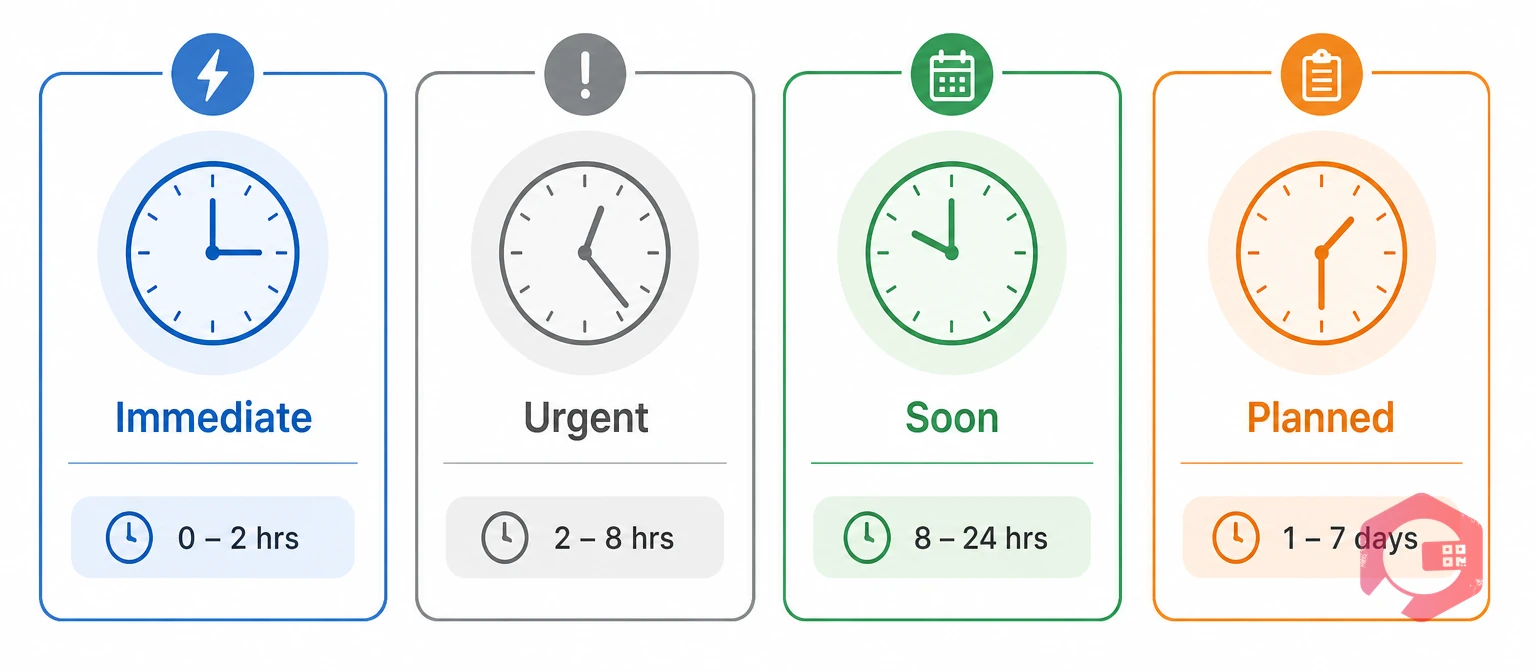
Work order urgency is how soon a problem must be fixed before the consequences get worse. Urgency is separate from importance, so a low-value asset can have an urgent problem and a critical asset can have a routine one.
Four urgency levels cover most maintenance work. Write each level with a time window and a plain example, so a requester can choose in seconds.
| Urgency level | Definition | Typical example | Time window |
|---|---|---|---|
| Immediate | A hazard or full stoppage is happening now | Gas smell, or a line stopped by a failed drive | Act within 0 to 4 hours |
| Urgent | Failure is likely within a day, or output is degraded | Leaking seal on a running pump, or a chiller alarm | Within 24 hours |
| Soon | A defect that will not get worse quickly | Worn belt with no slip yet, or a flickering corridor light | Within 7 days |
| Planned | No time pressure, fits the next schedule | Repainting, label replacement, or an improvement request | Next planned window |
Give requesters one test: what happens if nobody touches this for the whole time window? If the honest answer is that nothing changes, the request is not urgent.
In most plants, tight urgency definitions fix more priority problems than any software setting. A work order priority matrix can only be as consistent as the urgency words that feed it.
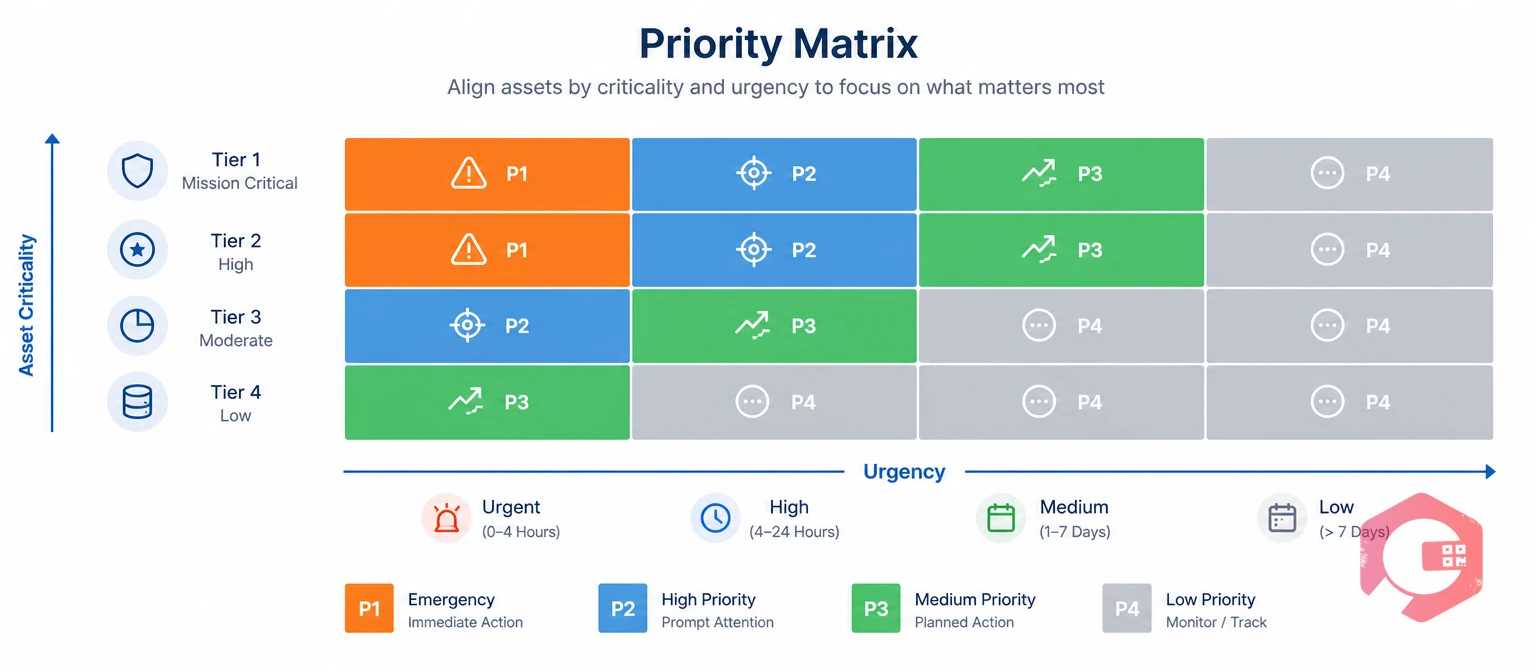
A work order priority matrix is a grid that turns urgency and asset criticality into one priority level. Rows show the asset tier, columns show the urgency level, and each cell holds a priority from P1 (emergency) to P4 (low).
The Three-Gate Priority Method:
Here is a starter grid you can copy and adjust:
| Asset tier | Immediate | Urgent | Soon | Planned |
|---|---|---|---|---|
| Tier A (critical) | P1 | P1 | P2 | P3 |
| Tier B (important) | P1 | P2 | P3 | P4 |
| Tier C (standard) | P2 | P3 | P4 | P4 |
Picture three requests that all arrive by phone on a Monday morning, each described as urgent:
The same leaking seal is P1 on a Tier A filler and P3 on a Tier C transfer pump. The grid works like a standard risk matrix, with asset consequence on one axis and timing on the other. A matrix works when two planners reading the same request reach the same priority.
Before you set response targets, baseline your current repair times with the MTTR calculator so each priority level starts from real numbers.

Response time is how long a job can wait before someone acts on it. Completion time is how long the job can stay open before it counts as late.
Without both targets, a work order priority matrix produces labels with no meaning. Use the starter targets below as a first draft.
| Priority | Label | Response target | Completion target | Who can change it |
|---|---|---|---|---|
| P1 | Emergency | Within 1 hour | Start now, close within 24 hours | Maintenance manager |
| P2 | High | Within 4 hours | Close within 3 days | Supervisor or planner |
| P3 | Medium | Within 24 hours | Close within 14 days | Planner |
| P4 | Low | Next planning cycle | Close within 30 to 60 days | Planner |
Treat these numbers as a starting point. A hospital, a food plant, and a retail chain will each set different targets, so adjust them to your risk and your staffing.
A response target stops jobs from sitting unseen in the queue. A completion target stops jobs from being started and then abandoned.
Teams that track only completion often find that a P2 job waited two days before anyone opened it, then closed on time. Tracking both targets shows where the delay happens.
A priority level only works when it comes with a clock that everyone can see.
An override rule is a fixed exception that raises a job's priority no matter what the grid says. Overrides exist because a grid cannot see every hazard or deadline.
Keep the list short and write each rule in plain words:
Repeat failures deserve a root cause analysis, not another quick fix. Take a Tier C transfer pump that fails for the third time in a month. The grid says P3, but the repeat-failure rule lifts it to P2 and starts an investigation.
Most maintenance teams do well with four or five overrides. Every extra exception weakens the work order priority matrix, so add one only when a real incident shows the gap.
A CMMS can apply the matrix automatically. It reads the asset tier and asks the requester for the urgency level only. That removes guesswork and keeps priority consistent across shifts.
A single work order management system then gives planners one queue sorted by priority and due time. Technicians see the same view, so the first job on the list is the one that matters most.
Maintenance teams using Cryotos have reported up to 30% reduction in unplanned downtime and 25% faster repair turnaround. Routing urgent jobs to the right people first is one of the ways a CMMS supports faster response.
A short pilot shows where the work order priority matrix confuses people while changes are still cheap.
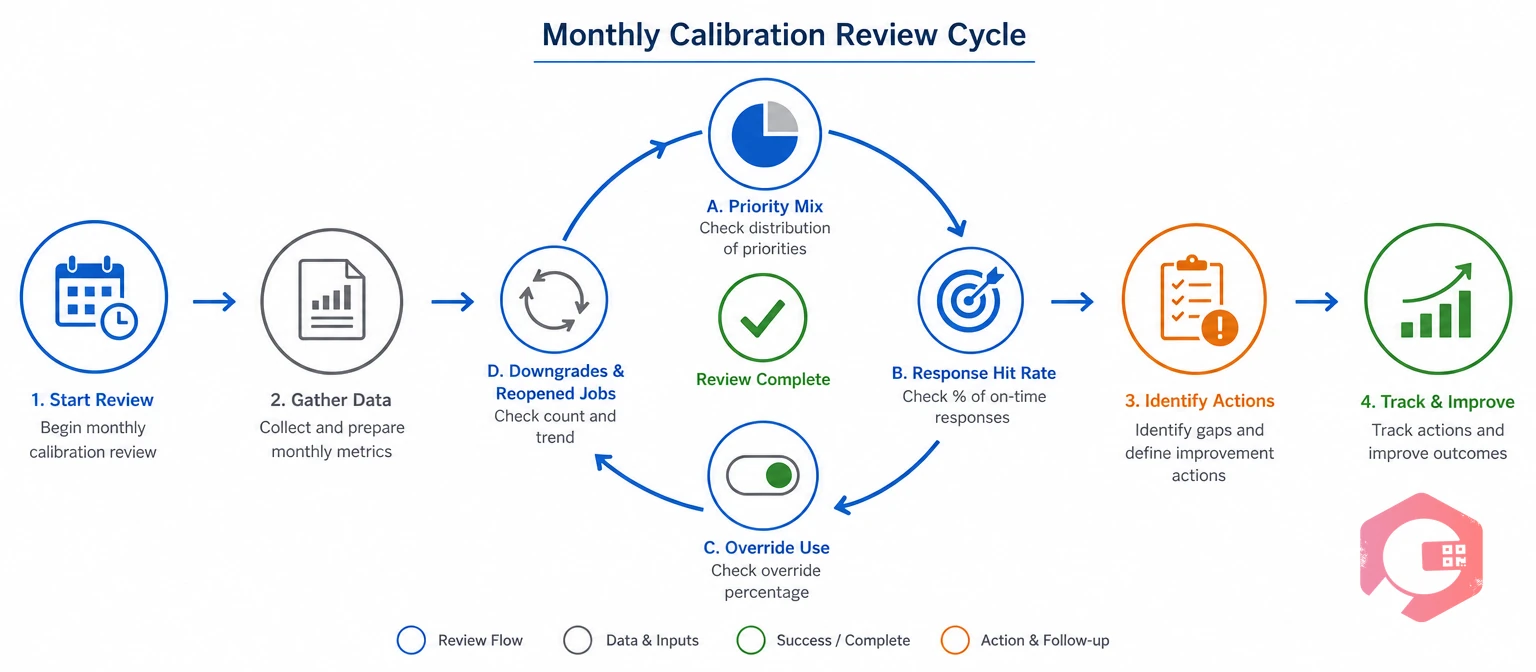
Calibrating the matrix means checking each month whether the priority labels match what happened on the floor. A grid that is never reviewed drifts back toward everything being urgent.
Review four numbers:
A monthly review of 30 minutes keeps a work order priority matrix useful long after the first rollout.
A work order priority matrix is a grid that sets a job's priority from two inputs: the urgency of the problem and the criticality of the asset. A planner reads the asset tier, picks the urgency level, and finds the priority in the matching cell. The result is a consistent P1 to P4 label.
Rate each asset into a criticality tier, define urgency levels with time windows, and place both on a grid. Each cell holds a priority such as P1 or P3. Add override rules for safety and compliance so the grid never ranks a hazard too low.
Four levels work for most teams: emergency, high, medium, and low. Fewer than three gives too little control, and more than five makes the differences hard to explain. Pick the smallest number that still separates jobs by response time.
Limit changes to named roles such as a planner, supervisor, or maintenance manager, and log the reason every time. Requesters can suggest urgency, but they should not edit the final priority. That keeps the work order priority matrix consistent across shifts.
Review criticality at least once a year and after any major process change, equipment upgrade, or repeated failure. Scores drift as production plans and spare parts availability change. A short annual review keeps the tiers believable.
A clear matrix turns a noisy request queue into an ordered list of work. Schedule a free demo to see how Cryotos tracks work orders by priority from request to completion.



Cryotos AI predicts failures, automates work orders, and simplifies maintenance—before problems slow you down.