
Wrench time is the percentage of a maintenance technician's shift spent doing hands-on repair and maintenance work — turning wrenches, replacing parts, and fixing equipment. Industry studies consistently show that the average maintenance technician spends only 25–35% of their shift on actual wrench time. The rest goes to travel, waiting for parts, searching for information, and administrative tasks.
That gap is expensive. If your plant runs 10 technicians and each one is productive for just 30% of an 8-hour shift, you're paying for 56 hours of lost labor every single day. Closing that gap — even partially — directly reduces maintenance costs, improves equipment uptime, and stretches your workforce further without adding headcount.
This guide explains exactly what wrench time is, how to measure it accurately, what's killing it at most facilities, and the specific steps you can take to improve it with the right processes and tools.

Wrench time (also called "tool time" or "hands-on time") measures the proportion of a technician's available work hours spent performing direct maintenance activities. These are tasks where the technician is physically working on equipment — diagnosing a fault, replacing a bearing, performing a calibration, or completing a PM checklist.
Everything else — walking to a job site, waiting for a work order to be printed, hunting for a spare part in a disorganized storeroom, attending a safety briefing, or filling out paperwork — counts as non-wrench time.
The Plant Engineering annual maintenance survey has tracked wrench time for over two decades. Facilities with best-in-class maintenance programs consistently achieve 55–65% wrench time. The average plant sits at 25–35%. World-class is generally accepted to be above 55%, per Reliable Plant benchmarks.
Wrench time measures labor efficiency. OEE measures equipment efficiency. They're related but different. A facility can have decent OEE but terrible wrench time if its equipment happens to be reliable. The real connection is this: low wrench time means your maintenance team is spending more time firefighting and less time completing the preventive maintenance that sustains high OEE over time.
Wrench time is a direct indicator of how effectively you're converting payroll dollars into maintenance output. Here's what improving it means in practice:
There are three main approaches to measuring wrench time. Each has trade-offs in accuracy, cost, and effort. Most facilities use a combination depending on what data they already collect.
Work sampling (also called activity sampling) is the most common measurement method. An observer records what each technician is doing at random intervals throughout the day — typically every 10–15 minutes. After enough observations (usually 300–500 per technician group to reach statistical significance), you get a reliable breakdown of time spent in each activity category.
The categories are usually: direct work, travel, waiting for parts, waiting for permits, administrative tasks, and personal time. Wrench time is the direct work percentage. Work sampling is recommended by ISA (International Society of Automation) as a structured approach to maintenance productivity measurement.
If your work order management system captures start and stop times, you can calculate wrench time directly from the data. Technicians clock in and out of each task on their mobile device. The system then compares actual task time to total available hours.
This method requires discipline from technicians — they need to actually log each task — but it's far less labor-intensive than work sampling once the habit is formed. It also gives you continuous data rather than a periodic snapshot.
For smaller teams or initial benchmarking, a manual approach works. Technicians fill out daily time sheets divided into activity categories. A supervisor tallies the results weekly. This is rough and depends on honest reporting, but it's a good starting point before investing in digital tracking.
Use Cryotos's wrench time calculator to get a quick baseline from your existing data — just enter total available hours and estimated hands-on time to see where you stand against industry benchmarks.
The calculation is straightforward:
For example: if 10 technicians each work an 8-hour shift (80 total hours available) and collectively log 28 hours of direct maintenance work, wrench time = (28 ÷ 80) × 100 = 35%.

Understanding where time goes is the first step to getting it back. These are the most common wrench time killers, ranked by how frequently they appear in maintenance productivity studies:
Parts delays are the single biggest wrench time killer in most facilities. A technician walks to the storeroom, finds the part is out of stock, puts in a requisition, and then waits — sometimes for hours or days. According to Maintenance Technology magazine, parts-related delays account for 15–20% of total maintenance time at poorly organized facilities.
The fix isn't always more inventory — it's smarter inventory. A spare parts management system that tracks real-time stock levels, sets minimum reorder points, and connects parts requests directly to work orders eliminates most of this waiting.
Technicians walking back to the shop for tools, driving across a large plant to find out a job was already completed, or making multiple trips to the storeroom — all of it chips away at productive time. The root cause is usually poor job planning: work orders get assigned without pre-staging tools and materials.
A technician who arrives at a job site and doesn't know exactly what needs to be done has to stop and figure it out — call the supervisor, find a manual, or guess. Poorly written work orders create delays at the start of every task. Standard work order templates with required fields (asset, failure description, procedure reference, parts needed) solve this.
Safety procedures are non-negotiable, but manual permit processes are often far slower than they need to be. Paper-based LOTO and permit to work processes can add 30–60 minutes to a job that takes 20 minutes to actually fix. Digital permit to work software cuts approval time without cutting safety.
Technicians searching for manuals, wiring diagrams, or previous repair history before they can start work lose significant time. A centralized AI-powered knowledge base tied to each asset means technicians can pull up full service history and documentation from their phone before they even leave the shop.
When the maintenance planner doesn't coordinate parts, permits, and technician availability before releasing a work order, the technician becomes their own planner — solving logistics problems in real time instead of doing maintenance work. A dedicated planning and scheduling function is one of the highest-ROI investments a maintenance department can make.
Paper timesheets, manual work order closeout, and end-of-shift reporting all take time away from hands-on work. Mobile CMMS apps that let technicians log time, add notes, and close work orders from the job site — rather than returning to a desk — significantly reduce administrative overhead.
Wrench time varies by industry, and knowing where your sector sits helps you set realistic improvement targets.
If you're below the average for your industry, the opportunity is significant. Moving from 30% to 45% wrench time on a 10-person team means recovering the equivalent of 1.5 full-time technicians without hiring anyone.
Improving wrench time requires addressing the root causes, not just tracking the number more carefully. Here are the strategies with the highest impact, in order of typical implementation complexity:
This is the single highest-impact change most facilities can make. A maintenance planner's job is to remove every obstacle before the technician shows up — confirm parts are in stock, arrange permits, gather technical documents, estimate labor hours, and sequence work to minimize travel. When planning is done well, wrench time routinely jumps 15–20 percentage points. The planning-to-technician ratio at world-class facilities is typically 1 planner for every 10–15 technicians.
Every work order should include the asset ID, location, failure code, procedure reference, parts list, estimated duration, and safety requirements before it's released. Use maintenance checklists embedded in the work order to guide technicians through complex tasks step by step. This eliminates on-the-spot troubleshooting of logistics.
A well-organized storeroom reduces parts retrieval time from 20–30 minutes to under 5. Key steps: label every shelf and bin clearly, use a min/max replenishment system, tie the storeroom to your CMMS so technicians can check stock from the job site before walking over, and reduce the number of items requiring a supervisor signature for checkout. Track critical spare parts with inventory management tools that alert you before stockouts happen.
When technicians manage work orders on paper or return to a desktop to log time, they're spending non-productive time on administration. A mobile CMMS lets technicians receive work orders, access asset history, record parts used, log time, and close out jobs from their phone — all without leaving the job site. This alone typically recovers 30–45 minutes per technician per day.
Reactive maintenance (fixing things after they break) has the lowest wrench time of any maintenance mode. Emergency repairs are chaotic — parts aren't pre-staged, permits aren't arranged, technicians drop planned work to respond. Every reactive breakdown cascades into hours of lost productive time across the crew. A strong preventive maintenance program makes work predictable and plannable, which directly increases wrench time.
For large plants, group work orders by physical zone so technicians complete all jobs in one area before moving to the next. Use GPS-enabled asset tracking to assign the nearest available technician to each job. Pre-stage tools and parts at job sites for large planned shutdowns.
Manual LOTO and permit approvals often take longer than the maintenance task itself. Digital permit systems route approvals electronically, maintain a live status board so technicians know when permits are ready, and automatically attach completed permits to work orders for audit purposes. Facilities that switch from paper to digital permits typically cut permitting time by 40–60%.
You can't improve what you don't measure. Add wrench time to your monthly maintenance KPI review alongside MTTR, MTBF, PM compliance, and backlog hours. Use your CMMS's report builder to generate wrench time reports by technician, crew, and department. When supervisors see the data, they're better equipped to identify which specific delays are eating the most time and address them directly.
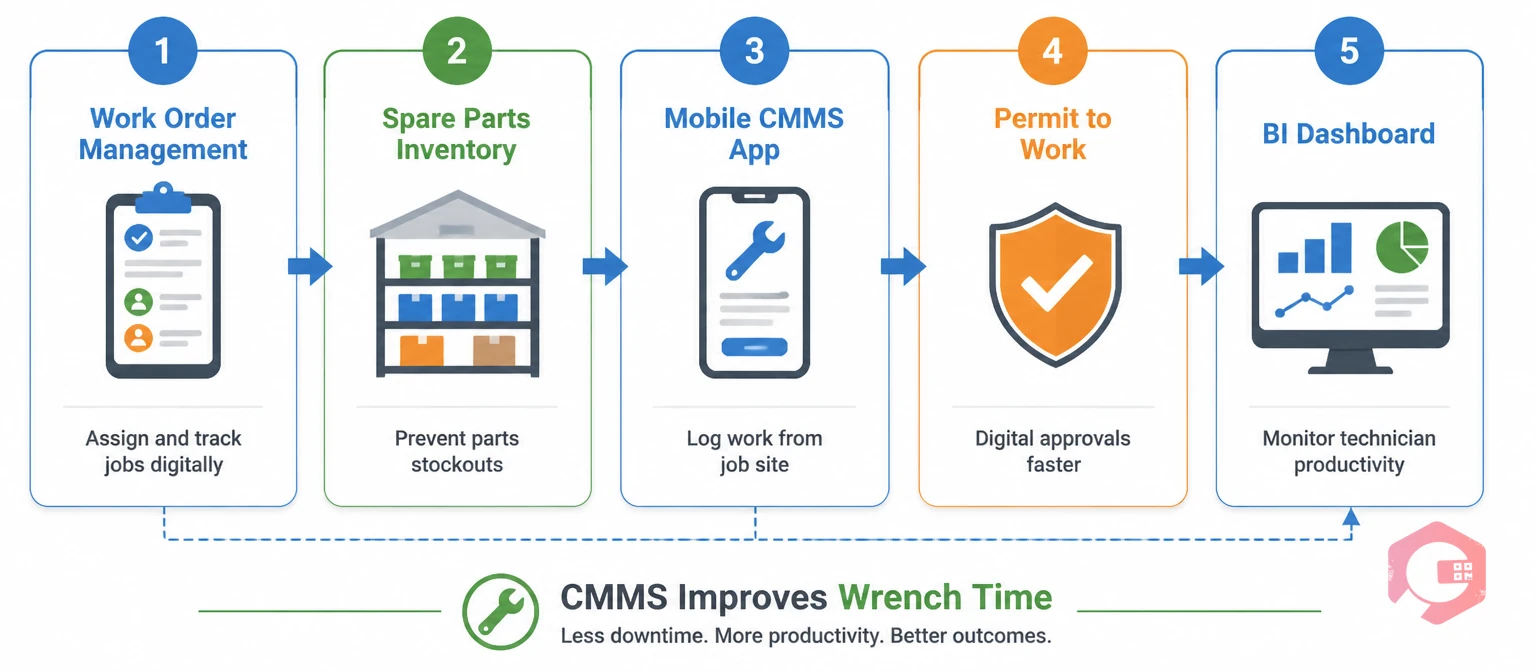
A CMMS (Computerized Maintenance Management System) addresses almost every root cause of low wrench time simultaneously. Here's how the key modules connect to wrench time improvement:
Cryotos CMMS is built around this workflow. Maintenance teams using Cryotos have reported a 30% reduction in equipment downtime and 25% faster repair times — both of which are direct downstream effects of improved wrench time. The platform's BI dashboard gives managers a real-time view of technician productivity, open work orders, and PM compliance — all the data you need to run a high-wrench-time operation.
If you're starting from scratch, here's a phased approach that works for most facilities:
Conduct a work sampling study or pull time-stamped data from your work order system. Establish your baseline wrench time percentage. Break down non-wrench time by category (parts delays, travel, permitting, admin, etc.) to identify your biggest losses.
Assign a dedicated maintenance planner if you don't have one. Standardize your work order template. Conduct a storeroom audit and implement a min/max system for critical parts. Map the top 3 non-wrench-time categories to specific corrective actions.
Roll out the process changes. If you're implementing a CMMS or upgrading to mobile work order management, train your team and run parallel systems for 2–4 weeks before cutting over completely. Track wrench time weekly during this phase — you want to see the trend moving in the right direction before you declare victory.
Add wrench time to your monthly KPI review. Set an improvement target (e.g., +5 percentage points per quarter until you hit your industry benchmark). Celebrate progress publicly — maintenance teams respond well when leadership acknowledges efficiency gains.
A world-class wrench time is 55–65% depending on the industry. The average facility sits at 25–35%. If you're below 30%, you have significant room to improve without adding staff. Anything above 50% puts you ahead of most facilities in your peer group.
For a baseline assessment, a two-week work sampling study with 300+ observations is sufficient. Once you have CMMS data capturing task start/stop times, you can monitor wrench time continuously and report on it monthly. Quarterly formal reviews are enough for most maintenance teams once you've established a baseline and set targets.
In theory, yes — if technicians are cutting corners on safety procedures or documentation to inflate their hands-on time, quality suffers. In practice, this is rarely the problem. Most facilities have far more room to grow wrench time than they do risk of over-optimizing it. The goal is eliminating waste, not rushing maintenance tasks.
Yes, with some modifications. For field service technicians, travel between customer sites is inherently productive (it's part of the job), so it's tracked separately. "Wrench time" for field teams typically refers to time spent on-site doing actual repair work versus waiting for parts delivery, handling customer paperwork, or dealing with access issues.
Low wrench time and high backlog usually go together. When technicians spend less time on actual maintenance, fewer work orders get completed each week, and the backlog grows. Improving wrench time is one of the most effective ways to reduce backlog without hiring more staff — the same team completes significantly more work per shift.
Standard delay codes include: waiting for parts, waiting for permits, equipment not available, waiting for operator, travel, administrative tasks, and training. Use at least 5–7 delay codes on your work orders. More granular data gives you better intelligence on where to focus improvement efforts.
If you're ready to improve technician productivity at your facility, Cryotos CMMS gives you the work order management, mobile tools, inventory tracking, and reporting capabilities to measure and close the wrench time gap. Learn more about Cryotos and see how maintenance teams are recovering hours of productive time every day.


Cryotos AI predicts failures, automates work orders, and simplifies maintenance—before problems slow you down.


