

The 10% rule in preventive maintenance scheduling is a tolerance standard stating that a PM task counts as "on schedule" if it's completed within plus or minus 10% of its defined interval. For a 30-day PM, that's a window of roughly 27 to 33 days. For a 1,000-run-hour PM, it's roughly 900 to 1,100 hours. Anything inside that window is compliant; anything outside it is early or late, and both extremes carry a cost.
Key Takeaways
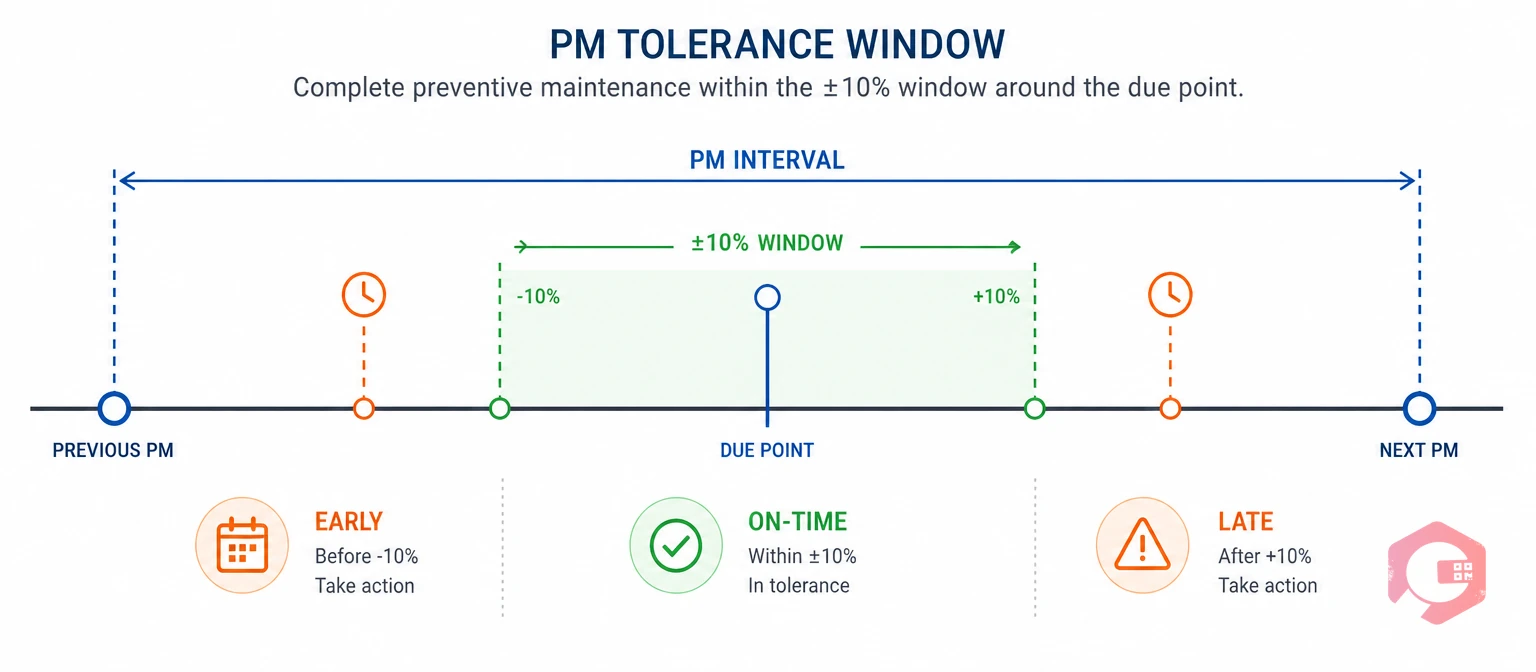
The 10% rule exists because a PM program built around a single fixed due date is fragile. Production schedules shift, technicians get pulled onto breakdowns, and parts arrive late. Maintenance teams using a hard due date face a choice: treat every PM as immovable and fight the schedule constantly, or let due dates slide and watch compliance become a number that no longer means anything.
A tolerance band solves that problem without lowering the bar. PM compliance, measured correctly, is the percentage of tasks completed inside their defined tolerance window — not just the percentage marked "complete" regardless of timing. A PM finished 25 days late is not the same as one finished on day 31 of a 30-day interval, but a due-date-only system records both the same way.
This distinction matters to reliability engineers and to the broader discipline behind it. The Society for Maintenance and Reliability Professionals treats schedule adherence as a core reliability metric precisely because timing — not just completion — determines whether a PM actually protects the asset it was scheduled for.
Most facilities don't invent this percentage from scratch. It shows up consistently across reliability programs because it maps to a practical reality: a 10% swing in most PM intervals is small enough that it rarely changes wear or failure probability in a meaningful way, but large enough to give planners real room to work with. Push much past that — 20% or 25% — and the tolerance starts eating into the protection the interval was designed to provide.
It's tempting to assume finishing a PM early is always fine, but early completion carries a real cost that often gets overlooked. Servicing an asset before it needs it wastes labor hours that could go toward a task that's actually due, and it consumes parts life — a filter, a belt, a lubricant charge — that still had useful service left in it.
Across a large fleet, that waste compounds. A facility running hundreds of PMs a month that consistently completes tasks 20-25% early is effectively running a more frequent PM program than it planned for, without ever deciding to do so on purpose. That's why most facilities treat the tolerance window as two-sided — protecting against waste on the early end just as much as risk on the late end.
The 10% window is calculated the same way regardless of what triggers the PM — a calendar interval or a meter reading. That consistency matters for any fleet running a mix of both.
A time-based PM is triggered by calendar days, weeks, or months. Take the interval, multiply by 0.10, and that's the tolerance in each direction.
A usage-based PM is triggered by run hours, cycles, mileage, or production counts rather than the calendar. The same 10% math applies — it's just measured in meter units instead of days.
Here's how that plays out across a few common interval types:
| PM Type | Interval | 10% Tolerance | Acceptable Window |
|---|---|---|---|
| Time-based | 30 days | ± 3 days | Day 27–33 |
| Time-based | 90 days | ± 9 days | Day 81–99 |
| Usage-based | 250 run-hours | ± 25 hours | 225–275 hours |
| Usage-based | 1,000 run-hours | ± 100 hours | 900–1,100 hours |
A fleet running mixed time- and usage-based PMs needs one consistent standard, or compliance reporting turns into two incompatible numbers that nobody can compare. Most facilities solve this by encoding the tolerance logic once, in the Computerized Maintenance Management System (CMMS) itself, rather than recalculating it by hand for every asset class.
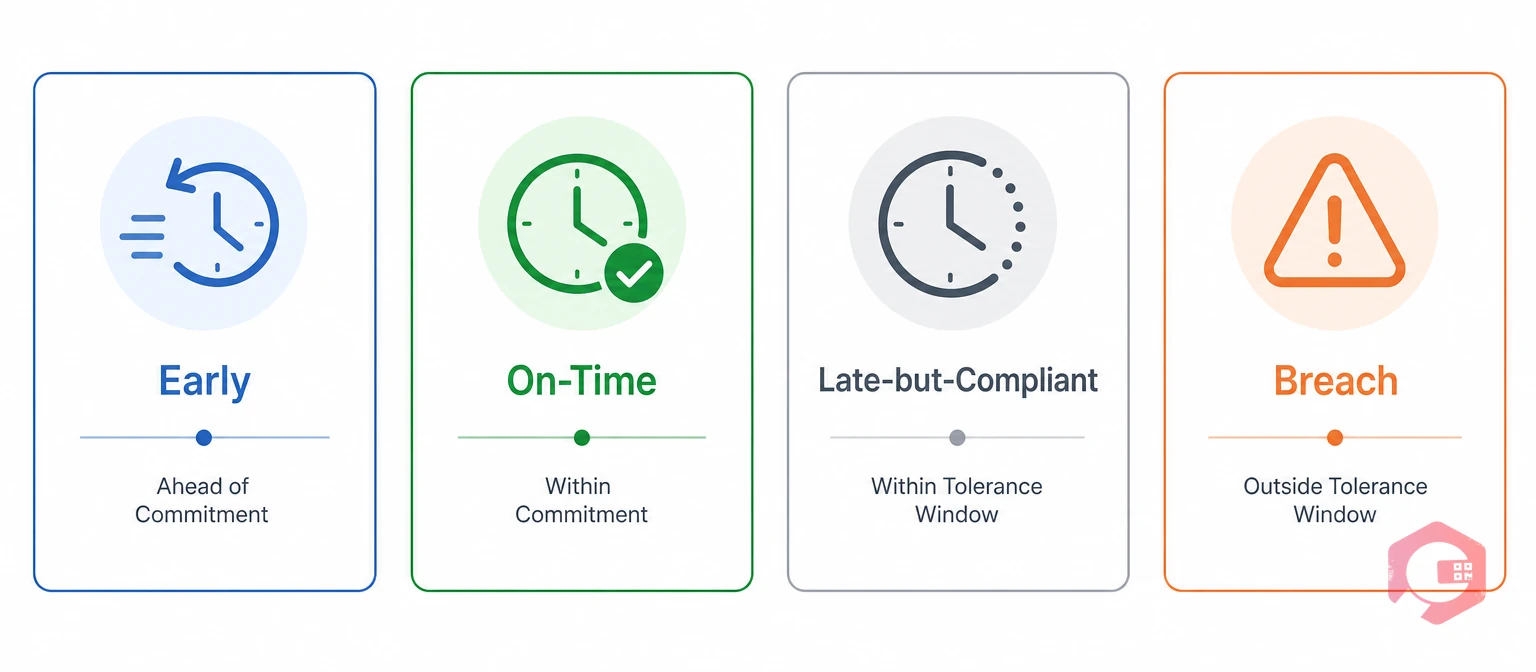
The 4-Zone PM Tolerance Model describes what happens to a PM task as it moves through its interval, and it's the clearest way to understand why a tolerance band beats a single due date:
Without this structure, a rigid due-date model pushes planners toward the Early Zone by default, just to stay safely ahead of a hard deadline. That's a rational response to an all-or-nothing system, but it drives unnecessary parts consumption and labor hours across an entire fleet. Tolerance-aware scheduling gives planners room to use the planned downtime windows that actually exist, instead of manufacturing artificial urgency around every task.
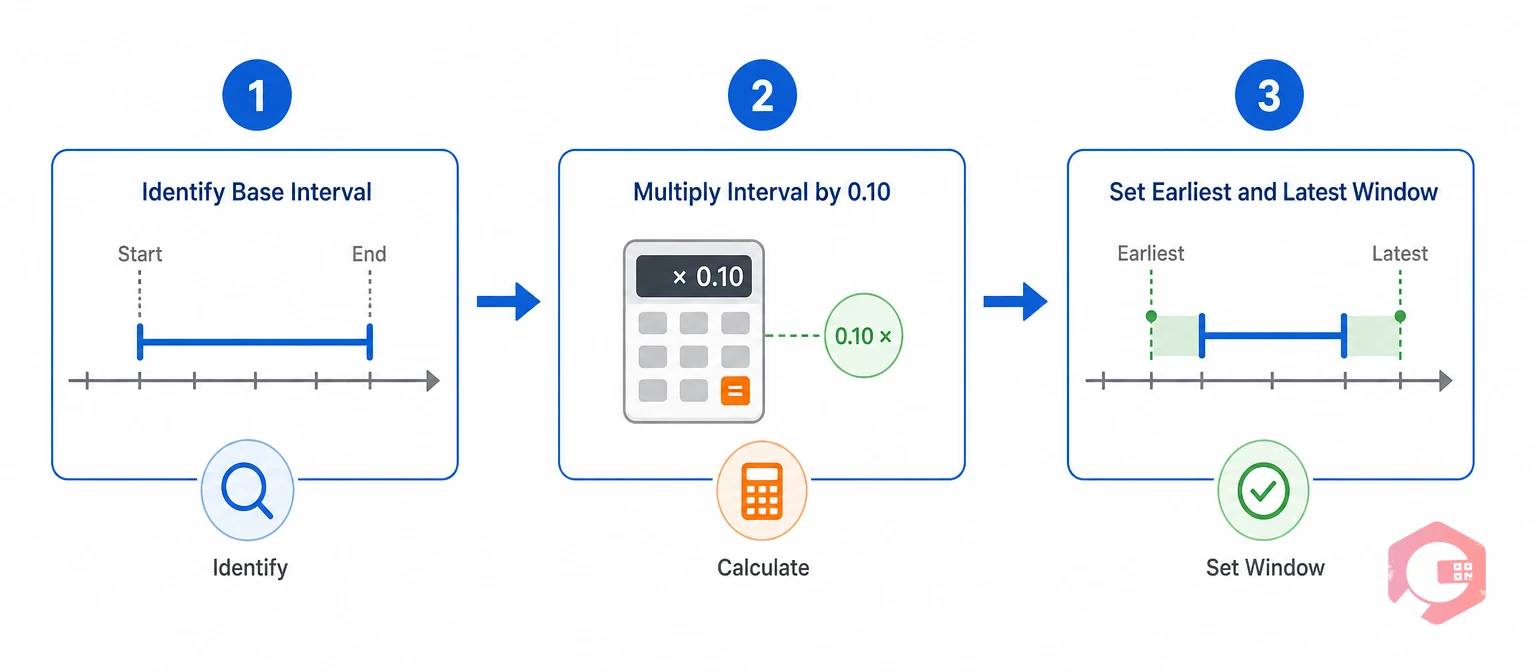
The math behind the 10% rule is simple, but applying it consistently across hundreds of assets by hand is where most PM programs break down.
Confirm whether the PM is time-based (days, weeks, months) or usage-based (run hours, cycles, mileage).
This gives the tolerance in each direction. A 60-day interval produces a 6-day tolerance; a 500-cycle interval produces a 50-cycle tolerance.
Subtract the tolerance from the interval for the earliest acceptable date or meter reading, and add it for the latest.
Explore how Cryotos PM scheduling software calculates and applies these windows automatically across every asset in a fleet, rather than leaving planners to run the math in a spreadsheet.
Maintenance teams that have used both models describe the difference in a single word: flexibility. A fixed due date gives planners one acceptable day; a tolerance window gives them a range they can work with.
| Factor | 10% Rule (Tolerance-Based) | Fixed Due-Date |
|---|---|---|
| Scheduling flexibility | Batch tasks within each window | One acceptable date, no batching room |
| What compliance measures | Real reliability risk | Binary complete/incomplete |
| Labor and parts cost | Reduces unnecessary early servicing | Pushes teams toward early completion |
| Risk of schedule drift | Controlled by the 10% ceiling | Uncontrolled once a date is missed |
| Best fit | Most industrial and production assets | Hard regulatory or contractual deadlines |
Neither model is universally correct. Safety-critical or regulated tasks often need something closer to a fixed date, which is why criticality-based overrides — covered below — matter as much as the base rule itself.
The math behind the 10% rule stays constant, but what it looks like in practice shifts depending on the industry and the consequence of a missed PM.
A production line running a 500-cycle PM on a conveyor motor has a ± 50-cycle window. Planners typically use that window to line the task up with a scheduled changeover, so the motor comes offline only when the line is already stopped for another reason. Across a multi-line plant, dozens of these windows overlap in any given month, which is exactly the kind of pattern a maintenance scheduling tool can surface automatically instead of a planner spotting it by chance.
A pasteurizer running a 14-day calibration PM has roughly a ± 1.4-day window — in practice, rounded to a single day either side. Because calibration drift directly affects food safety, many plants tighten this specific PM well below the standard 10%.
A pressure relief valve on a 180-day inspection interval has an 18-day window. Given the safety consequence of a missed inspection, most operators apply a criticality override here rather than the fleet-wide default.
An HVAC filter change on a 90-day interval has a 9-day window — wide enough that a facilities team can batch dozens of units into a single technician route without any individual unit falling out of compliance.
Even a simple percentage rule gets applied inconsistently once it meets a real fleet of assets. A few mistakes show up repeatedly, and most of them trace back to treating the tolerance window as a formality instead of an active planning tool:
Cryotos gives maintenance teams a way to encode the 10% rule directly into PM scheduling logic, enforcing compliance windows automatically instead of leaving them to a due-date spreadsheet.
Planners set an interval and a tolerance percentage — 10% by default, adjustable per asset, task, or criticality class. Cryotos calculates the earliest and latest acceptable completion points for every scheduled PM automatically.
Cryotos supports calendar intervals and meter-based intervals — including meter-based maintenance triggers like run hours and production counts — and calculates the 10% window the same way for both, so a mixed fleet is held to one consistent standard.
When a technician closes a PM work order, Cryotos checks the completion date or meter reading against the calculated window and tags the task On-Time, Early, or Late automatically at closeout.
Cryotos reminds technicians as a PM approaches its due date, then escalates only if the task risks breaching the outer edge of its tolerance window — keeping alert volume proportional to actual risk.
Facilities that automate this kind of maintenance workflow spend less time reconciling due-date spreadsheets against work order logs, because the tolerance check happens the moment the task closes, with no manual cross-referencing required afterward. Maintenance teams using Cryotos have reported up to 30% reduction in unplanned downtime and 25% faster repair turnaround as PM adherence data starts feeding directly into planning decisions.
Once tolerance is built into scheduling, compliance reports stop rewarding a PM closed a month late just because it was eventually finished. Reporting against the actual window gives reliability engineers a metric they can defend when justifying headcount, budget, or a change in PM strategy.
A true PM adherence rate is the percentage of tasks completed inside their tolerance window, not the percentage marked complete regardless of timing. Dashboards built this way break performance down by asset, site, or technician, so a manager can see how far off-schedule the slipped tasks actually were — not just that they slipped.
This is most often expressed as a single metric, PM Compliance (PMC):
A PMC score close to 100% means nearly every scheduled PM is landing inside its tolerance window; a score that trends downward over successive reporting periods is an early signal that scheduling capacity, staffing, or interval sizing needs a second look before it shows up as a reliability incident.
Cryotos also links completion timing to subsequent failure and incident data, so managers can see whether assets completed late — even within tolerance — show a measurably higher failure rate than those completed early or on time. That evidence supports tightening tolerance where it matters and relaxing it where the fleet has room to spare.
For regulated industries, every PM's scheduled window, actual completion date, and compliance status needs to be time-stamped and retained — not reconstructed after the fact. Auditors need to see that a task was performed within its defined tolerance, not just that it was performed eventually.
This kind of documented control lines up with the intent behind the ISO 55000 asset management standard, which expects organizations to demonstrate a controlled, evidence-based maintenance program rather than an informal one. It also matters for facilities that fall under OSHA recordkeeping requirements, where a documented PM history can be the difference between a clean audit and an open finding.
An auditor reviewing a PM program doesn't just want to see that a task shows as "complete." A defensible audit trail needs three things for every PM cycle: the scheduled window at the time the task was due, the actual date or meter reading it closed against, and a clear compliance status derived from comparing the two. Reconstructing that after the fact from paper logs or disconnected spreadsheets is where most audit findings originate — not from missed PMs themselves, but from missing evidence that a PM was ever properly scheduled in the first place.
Introducing a tolerance standard to a maintenance program that's been running on fixed due dates takes more than flipping a setting. A phased rollout avoids the confusion of technicians and planners working from two different standards at once.
Pick one asset class — pumps, HVAC units, or conveyor motors, for example — and apply the 10% window there first. This gives the team a manageable dataset to validate the calculation and the reporting before rolling it out fleet-wide.
Decide which assets warrant a tighter override before the standard 10% becomes the default everywhere. Retrofitting a tighter tolerance onto a safety-critical asset after a near-miss is a much harder conversation than setting it up front.
Technicians and planners used to a single due date need to understand that "early" and "late-but-compliant" are both acceptable outcomes — and that neither should be treated as a failure the way missing the date entirely once was.
Once every asset in the pilot group has run through at least one full interval under the new rule, review how many PMs landed in each zone of the tolerance model. That first dataset is usually the clearest signal for whether 10% is the right starting percentage for that asset class.
Reliability practitioners at Reliabilityweb consistently point to the same lesson: a tolerance rule only works if it's applied consistently and revisited over time, not set once and forgotten.
Safety-critical, regulated, or single-point-of-failure equipment often warrants a tighter band — 5%, or a fixed number of days — while the rest of the fleet keeps the standard 10%. Tolerance becomes a risk-based setting instead of one rule applied uniformly across equipment of very different consequence.
Tracking how often PMs land early, on time, or late within their window gives reliability teams the evidence to revisit intervals themselves — tightening a window that's consistently breached, or widening one that's consistently completed with room to spare. Facilities layering in condition-based maintenance data alongside tolerance tracking get an even clearer picture of which intervals actually reflect equipment condition.
Group PMs whose tolerance windows overlap an upcoming shutdown into a single planned outage. This cuts unplanned trips and travel time without pushing any individual task out of compliance.
Whether a PM is time-based or usage-based, the 10% math should be applied the same way across the fleet — otherwise compliance reporting turns into two incompatible numbers nobody can compare directly.
Treat 10% as a starting point, not a permanent setting. Once a year, most facilities review actual completion data against failure records for each asset class and decide whether the current tolerance still matches the real-world risk. An asset class that never breaches its window and never sees a related failure is often a candidate for a wider tolerance; one that regularly triggers late-zone completions followed by unplanned downtime is a candidate for a tighter one.
Multiply the PM's interval — in days or in usage units like run hours — by 0.10 to get the tolerance in each direction, then apply that tolerance both before and after the scheduled point. A 40-day interval produces a 4-day window on either side of day 40.
The task is flagged as non-compliant, either early or late, and most reporting dashboards count it separately from on-time completions. A pattern of late-outside-tolerance completions on a specific asset class is usually a signal to review staffing, parts availability, or the interval itself.
Yes. Many maintenance teams apply a tighter tolerance — 5%, or a fixed number of days — to safety-critical or regulated equipment, while keeping the standard 10% for lower-consequence assets. The percentage isn't fixed by law; it's a program decision based on risk.
Yes. The same percentage calculation applies whether the PM is triggered by a calendar interval or by a meter reading like run hours, cycles, or mileage. A fleet running both types needs one consistent tolerance standard to keep compliance reporting meaningful.
Smaller operations sometimes rely on informal judgment instead of a documented percentage, but that approach breaks down once a fleet grows past a handful of assets or falls under regulatory audit requirements. A documented tolerance rule gives every planner and technician the same standard to work against.
Most modern PM scheduling software lets an administrator set the tolerance percentage once per asset, task type, or criticality class, then calculates the window automatically for every future cycle. This removes the need for planners to recalculate the window manually each time a PM is scheduled or rescheduled.
It can be, depending on the failure mode. A 10% window on a 100-day interval is 10 days either side — reasonable for most rotating equipment, but potentially too wide for a component where even a few days of delayed inspection carries real safety or regulatory risk. That's exactly why criticality-based overrides exist: the base 10% is a sensible default for the majority of a fleet, not a ceiling that has to apply everywhere.
A PM program that enforces its tolerance window automatically turns "PM compliance" from a number that can be gamed into a metric that reflects real reliability risk. Every PM scheduled and closed against a defined window becomes structured data — linked to an asset, a technician, and a timeline — that feeds interval optimization and gives leadership the evidence to decide where a maintenance strategy needs to tighten and where it already has room to spare. Schedule a free demo to see how Cryotos calculates, flags, and reports against the 10% rule across your entire asset fleet.




Cryotos AI predicts failures, automates work orders, and simplifies maintenance—before problems slow you down.



