
A bow tie analysis is a structured risk assessment method that maps every threat that can cause a critical event and every consequence it can produce — with barriers on both sides to prevent or mitigate harm. Named after the shape of its diagram, this technique is used in process safety, oil and gas, manufacturing, and facility management to make risk visible and defensible on one page. The CMMS and safety management communities increasingly treat bow tie analysis as a foundational layer for barrier-based maintenance strategies.
Creating a comprehensive bow tie analysis takes seven structured steps: define the hazard and top event, identify threats, map consequences, assign prevention barriers, assign mitigation barriers, assess barrier effectiveness, and review the diagram regularly. Each step builds on the previous one — skipping any step produces a bow tie that looks complete but leaves real risk gaps hidden.
Key Takeaways
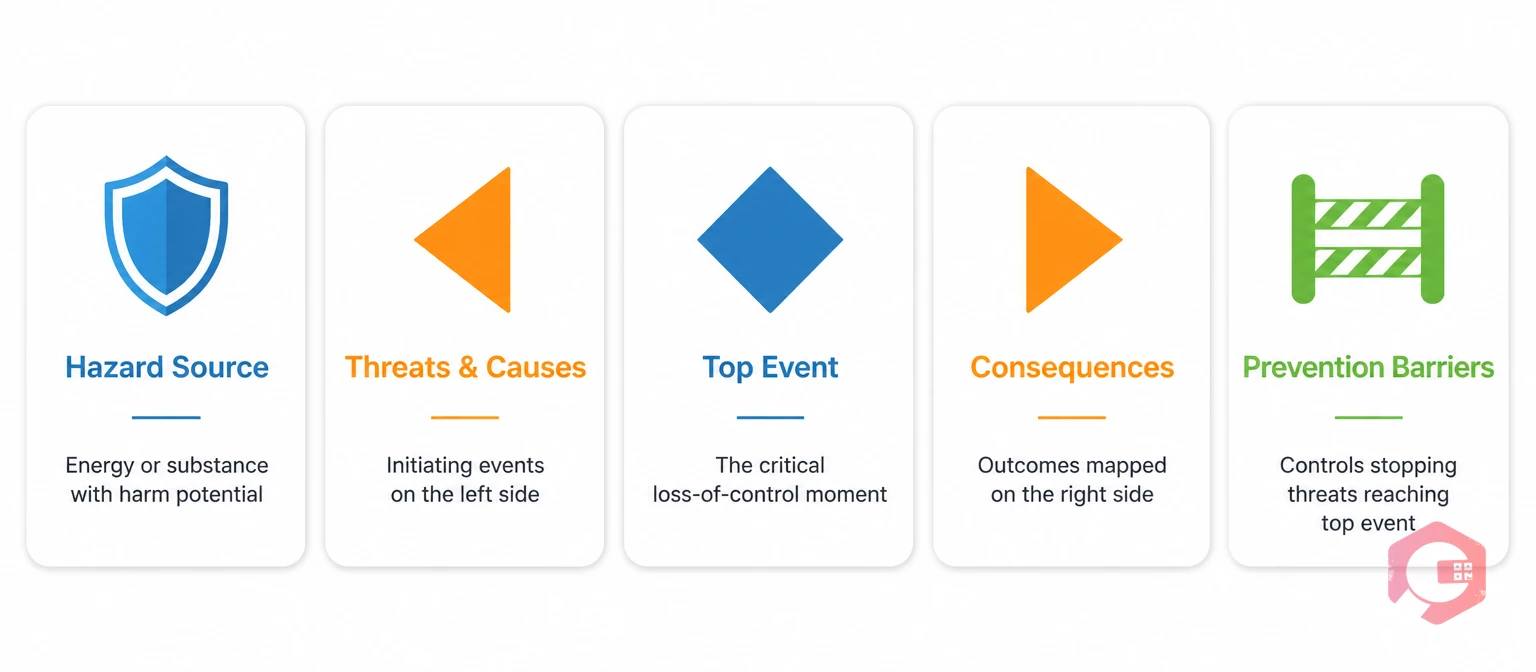
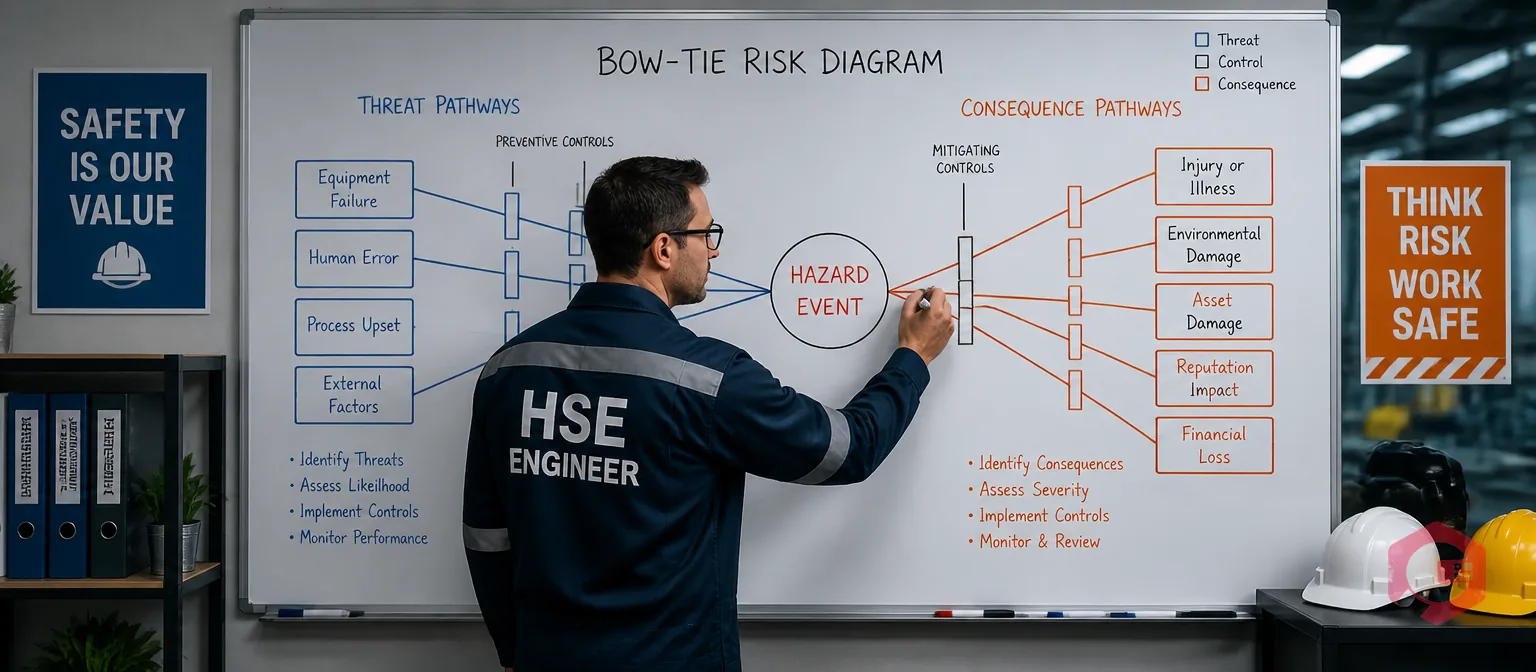
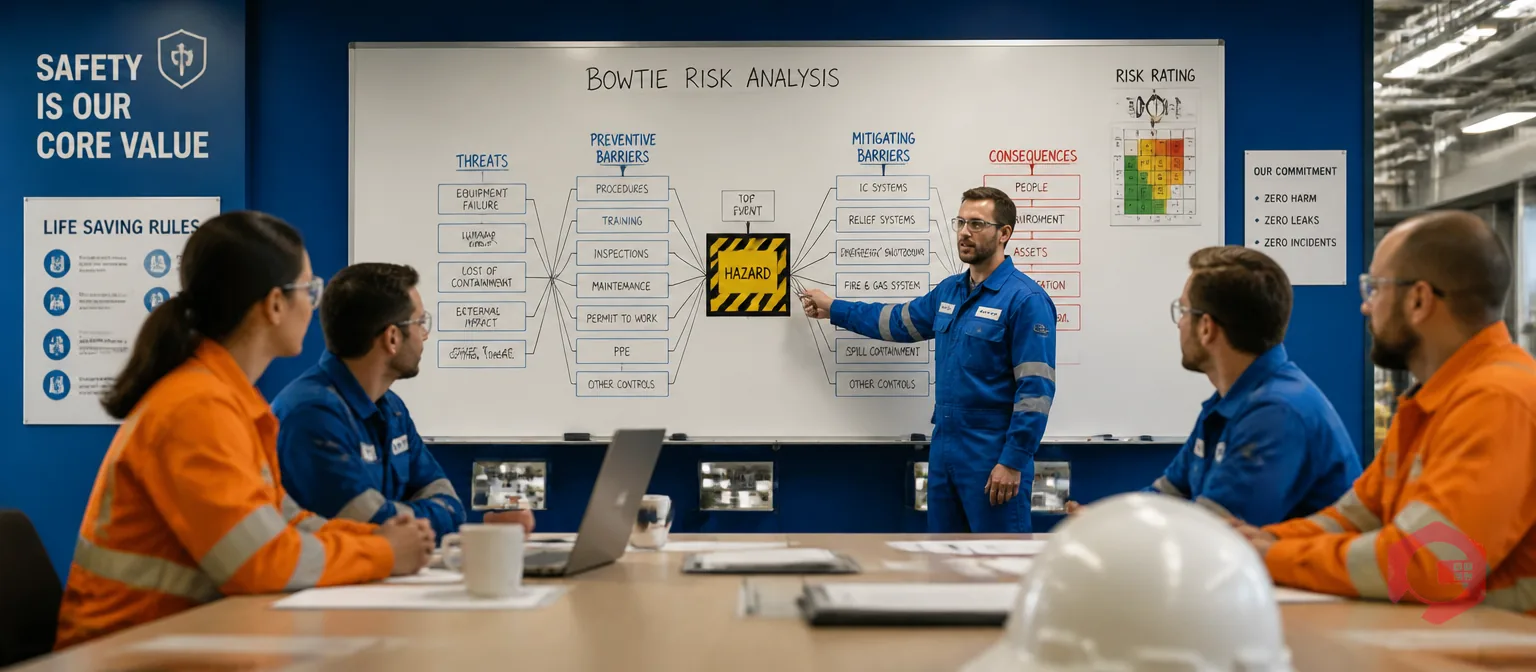
A bow tie analysis is a cause-and-consequence risk visualization technique that places a single critical event — called the top event — at the centre of a diagram shaped like a bow tie. On the left side, it maps all the threats that could trigger the top event. On the right side, it maps all the consequences that could result from it. Barriers sit on both sides: prevention barriers stop threats from reaching the top event, and mitigation barriers limit the damage after it occurs.
The method originated in the oil and gas industry in the 1970s and was formalized by Shell as a visual complement to quantitative risk assessment. It has since become standard practice in process safety, aviation, rail, nuclear, and increasingly in manufacturing and facilities management wherever high-consequence failures must be managed systematically. Unlike a root cause analysis — which works backward from a failure that has already occurred — a bow tie analysis is proactive: it maps risk before a failure happens and identifies the controls that must be in place to stop it.
According to the OSHA Process Safety Management standard, organizations managing highly hazardous chemicals are required to document process hazards, controls, and safeguards systematically. Bow tie analysis is one of the accepted methods that satisfies this requirement while remaining accessible to frontline teams.
Before walking through the creation steps, it helps to know exactly what each element of the diagram represents. Every completed bow tie contains the following components:
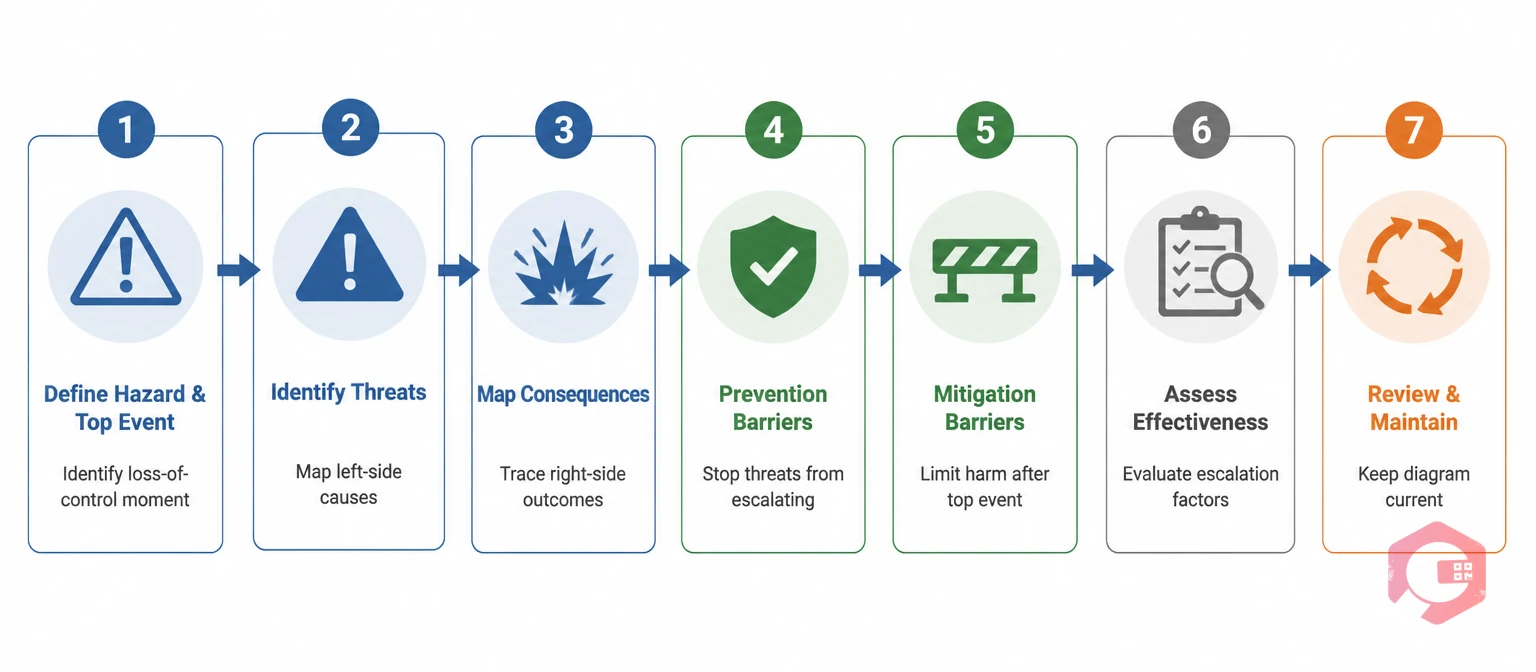
The following seven steps describe a complete bow tie analysis process that produces a diagram your team can actually use to manage risk — not just one that satisfies a compliance checkbox.
The bow tie starts with clarity about what you are analyzing. The hazard is the source of potential harm: a pressurized vessel, a flammable chemical, a high-voltage electrical system, a moving piece of heavy equipment. Write the hazard as a noun phrase — "stored LPG under pressure" or "high-temperature molten metal."
The top event is the specific moment of loss of control. It must be written as a discrete, observable event — not a general condition. "Loss of containment of LPG" is a valid top event. "LPG hazard" is not. The top event should be specific enough that everyone on the team agrees on whether it has occurred or not. A well-defined top event is the single most important decision in the entire analysis; every threat and consequence you map later depends on it. If two team members define the top event differently, they will produce incompatible left and right sides of the diagram.
Work backwards from the top event to identify every plausible cause. Ask: "What could cause this top event to occur?" Each answer is a threat. Threats are typically initiating events — specific failure modes, human errors, external conditions, or equipment malfunctions.
For a top event of "loss of containment of LPG," threats might include: corrosion causing pipe wall failure, overpressure from control system failure, mechanical impact from a vehicle strike, or operator error during maintenance. Use a multi-discipline team for this step — process engineers, maintenance technicians, operations supervisors, and HSE professionals each contribute threats the others would miss.
A practical starting point is to review historical incident reports and near-miss data for similar hazards in your industry. The ISA functional safety framework and industry loss databases (like those maintained by process safety bodies) are useful reference sources for threat identification on common chemical and mechanical hazards.
Work forward from the top event to map every plausible outcome. Ask: "If this top event occurs and nothing else stops it, what are the possible results?" Each distinct outcome pathway is a consequence. Consequences range from immediate physical harm — fire, explosion, toxic release, structural collapse — to secondary outcomes like business interruption, environmental damage, regulatory enforcement, and reputational damage.
Resist the temptation to list only catastrophic consequences. A bow tie analysis that captures only the worst-case scenario misses the full range of outcomes your barriers need to address. A toxic gas release might result in a fatality (worst case), an injury requiring hospitalization (significant), or an evacuation with no injury but major disruption (moderate). Each consequence pathway may require different mitigation barriers.
For each threat on the left side, identify the barriers that prevent it from triggering the top event. A barrier is a control that is independent of the threat, specific in its function, auditable, and assigned to a responsible owner. Good barriers have three characteristics: they can stop or interrupt the threat pathway, they can be tested to confirm they still work, and their failure would require a separate failure independent of the threat itself.
Examples of prevention barriers include: safety instrumented systems (SIS) that shut a process down on overpressure, physical guards that prevent vehicle access to a pipe rack, inspection programs that detect corrosion before it causes a breach, and permit-to-work procedures that control maintenance activities on live equipment. Each barrier goes between the threat and the top event in the diagram, labeled with its name and owner.
Do not list barriers you cannot verify are functioning. A "procedure exists" is only a barrier if you can confirm it is being followed consistently — which requires a system to track compliance. Cryotos's work order management software lets you track barrier-related tasks — inspections, proof tests, permit issuance — with timestamped completion records, so your bow tie reflects actual barrier status rather than intended controls.
For each consequence on the right side, identify the barriers that limit harm after the top event occurs. Mitigation barriers operate after loss of control — they cannot prevent the top event but they can reduce the severity of its consequences. Examples include: gas detection systems that trigger an alarm and evacuation before ignition, deluge systems that suppress a fire, emergency shutdown systems that isolate a release, medical response protocols that minimize injury severity, and containment bunds that prevent a spill from reaching a watercourse.
The same principle applies as for prevention barriers: mitigation barriers must be testable, owned, and independent of the consequence they are mitigating. A response plan that exists in a filing cabinet and has not been drilled is not an effective mitigation barrier.
This is the step most bow tie analyses skip — and the reason many bow ties give organizations a false sense of security. Every barrier can be defeated by conditions that compromise its effectiveness. These are called escalation factors. For each barrier, ask: "What could cause this barrier to fail when it is needed?"
A safety valve is a barrier against overpressure — but it can be defeated if it is set to the wrong pressure, corroded shut, or isolated for maintenance without an alternative in place. The corroded condition is an escalation factor. The barrier against that escalation factor is a periodic proof test of the valve.
Escalation factors and their controls should be documented on the bow tie diagram, usually as a secondary layer attached to the barrier it affects. This step transforms the bow tie from a static inventory of controls into a dynamic map of interdependencies — and it directly reveals which barriers are most vulnerable and which escalation factors deserve priority attention in your maintenance program. The 5 Whys methodology is a useful companion for tracing escalation factor root causes.
A bow tie analysis has no value if it is produced once and filed. Operations change, barriers degrade, new threats emerge, and equipment is modified. The analysis must be treated as a living document with a formal review cycle. At minimum, review the bow tie whenever: the process or equipment it covers changes significantly, an incident or near-miss occurs that was not anticipated in the diagram, a barrier failure is identified, or at scheduled intervals (typically annually for major hazards, every two to three years for lower-severity scenarios).
Each review should confirm that every barrier still exists, is still functioning, and still has a named owner. The root cause analysis investigation checklist provides a structured starting point for incident-triggered bow tie reviews, connecting the investigation findings directly to barrier gaps. The Energy Institute's guidance on bow tie methodology recommends that barrier validation be tied to the organization's safety management system — so that barrier tests, inspections, and drills generate records that can be cross-referenced during bow tie reviews.
Use the barrier assessment completed in Step 6 to create a barrier management schedule in your maintenance system. Each barrier proof test, inspection interval, and competency assessment becomes a scheduled work order — giving you a structured, auditable record that your barriers are not just documented but actively maintained.
All three are risk analysis techniques, but they serve different purposes and answer different questions. Understanding when to use each one — and when they complement each other — prevents redundant work and ensures you get the right depth of analysis for each risk.
| Criterion | Bow Tie Analysis | FMEA | Fault Tree Analysis |
|---|---|---|---|
| Primary purpose | Visualize barriers between threats and consequences for a single top event | Systematically identify failure modes and their effects across all components | Model the logical combinations of events that lead to a specific failure |
| Direction of analysis | Both directions — causes and consequences | Forward — from failure mode to effect | Backward — from top event to root causes |
| Output | Visual barrier map with ownership and escalation factors | Tabular list of failure modes with severity, occurrence, and detectability ratings | Logical tree showing combinations of events that produce a failure |
| Best for | Major hazard risk communication, barrier management, safety case | Product or system design, maintenance task justification, RCM programs | Quantitative reliability analysis, complex system interdependencies |
| Quantitative? | Qualitative (can be extended with probability data) | Semi-quantitative (RPN scoring) | Quantitative or qualitative |
| Audience | Operations teams, HSE, regulators, leadership | Engineering, maintenance, design teams | Reliability engineers, safety specialists |
In practice, bow tie analysis and FMEA are often used together — the FMEA identifies failure modes for individual equipment items, and the bow tie maps those failure modes as threats on the left side of a broader process safety diagram. This combined approach gives you both the equipment-level detail and the system-level risk picture.
Most bow tie analyses fall short not because the technique is wrong, but because of systematic errors in how it is applied. Recognizing these in advance saves significant rework.
Identifying barriers in a bow tie diagram is the analysis. Keeping those barriers functioning is the operational challenge — and this is where a maintenance management system becomes essential.
Every barrier in a bow tie diagram that depends on physical equipment or a recurring human action needs to be connected to a maintenance schedule. Safety valves require periodic proof testing. Detection systems require calibration and functional checks. Permit-to-work procedures require regular audits to confirm compliance. Emergency response equipment requires inspection and drill records. Without a system to schedule, assign, and record these tasks, the bow tie is a document about controls that may or may not be working.
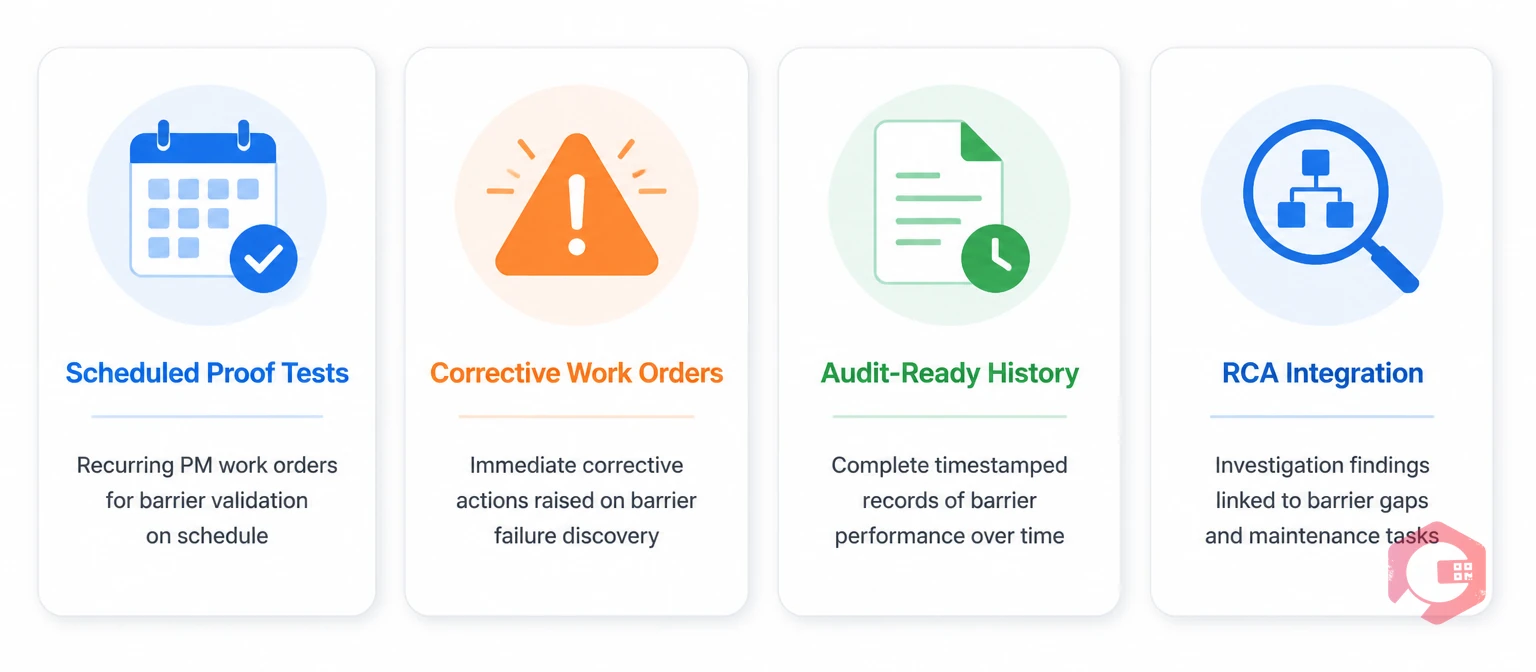
Cryotos CMMS supports barrier management in four specific ways. First, barrier proof tests and inspection tasks can be set up as recurring preventive maintenance work orders linked to the relevant asset — so the test happens on schedule, gets assigned to the right technician, and generates a completion record. Second, when a barrier failure is discovered during a proof test or inspection, a corrective work order is raised immediately from the same platform, with escalation to the relevant supervisor. Third, the maintenance history for each barrier-related asset is stored in one place — giving you audit-ready documentation of barrier performance over time. Fourth, when an incident or near-miss triggers a bow tie review, the root cause analysis workflow within Cryotos connects investigation findings to specific assets and work orders, so barrier gaps identified in the review become actionable maintenance tasks, not just documentation updates.
Teams managing major hazard risks who use Cryotos report a 30% reduction in unplanned downtime — which, in a bow tie context, translates directly to fewer barrier failures going undetected until they matter most.
A risk assessment is a broad process that identifies hazards, evaluates their likelihood and consequence, and determines whether risk is acceptable. A bow tie analysis is a specific technique within a risk assessment that focuses on one top event at a time, mapping the causal pathways to that event and the consequence pathways from it, with barriers at each stage. Bow tie analysis answers "what controls do we have and are they sufficient?" — a level of specificity that general risk assessments often do not reach.
There is no fixed number, but each threat-to-top-event pathway should have at least two independent barriers — the "defense in depth" principle. Similarly, each top-event-to-consequence pathway should have at least one mitigation barrier. In practice, major hazard bow ties typically show three to five prevention barriers per threat and two to three mitigation barriers per consequence pathway. Too few barriers signal an under-controlled risk; too many can indicate that controls are not genuinely independent and the count is inflated.
A focused bow tie for a single top event with four to six threats and three to four consequences typically takes a half-day workshop with a cross-functional team of four to six people, followed by a few hours of documentation and review. Complex top events with many threats and consequences, or systems with extensive escalation factor analysis, can take two to three full days. The workshop time is the essential component — a bow tie produced by one person at a desk without field input is rarely reliable enough to use as a risk management tool.
Bow tie analysis is most valuable for major hazards — scenarios where loss of control could result in multiple fatalities, significant environmental damage, or catastrophic asset loss. For lower-severity hazards, simpler risk assessment techniques are more proportionate. Most organizations apply bow tie analysis to their top ten to twenty major hazard scenarios, then use task risk assessments, method statements, and FMEA for the broader range of day-to-day operational risks.
Dedicated bow tie software such as BowTieXP (CGE Risk) and Safex provide structured environments for building and managing bow tie diagrams at scale. For organizations starting out, bow ties can also be constructed in PowerPoint, Visio, or purpose-built safety management platforms. The software choice matters less than the quality of the analysis itself — a well-structured bow tie built in any tool is more valuable than a superficially impressive diagram that does not reflect real operational controls. According to the Center for Chemical Process Safety (CCPS), the most critical requirement is that barrier information in the diagram is kept current and connected to actual barrier performance data.
A bow tie analysis is only as valuable as the barrier management program behind it. Schedule a free demo to see how Cryotos helps organizations track barrier proof tests, inspection schedules, and corrective actions — connecting your bow tie analysis to the maintenance system that keeps barriers functional.


Cryotos AI predicts failures, automates work orders, and simplifies maintenance—before problems slow you down.


