

Capacity utilization is the share of available production capacity that a plant uses for productive work. You calculate it by dividing actual productive time by available capacity and multiplying by 100. A plant with 100 available hours and 70 productive hours runs at 70% capacity utilization.
Machines and moulds decide whether that number climbs or falls. A worn mould or a skipped inspection can take hours from a shift long before anyone sees a breakdown. This guide explains how the metric works, where capacity is lost, and how routine machine and mould inspections keep hours productive. A Computerized Maintenance Management System ties the whole routine together.
Key Takeaways
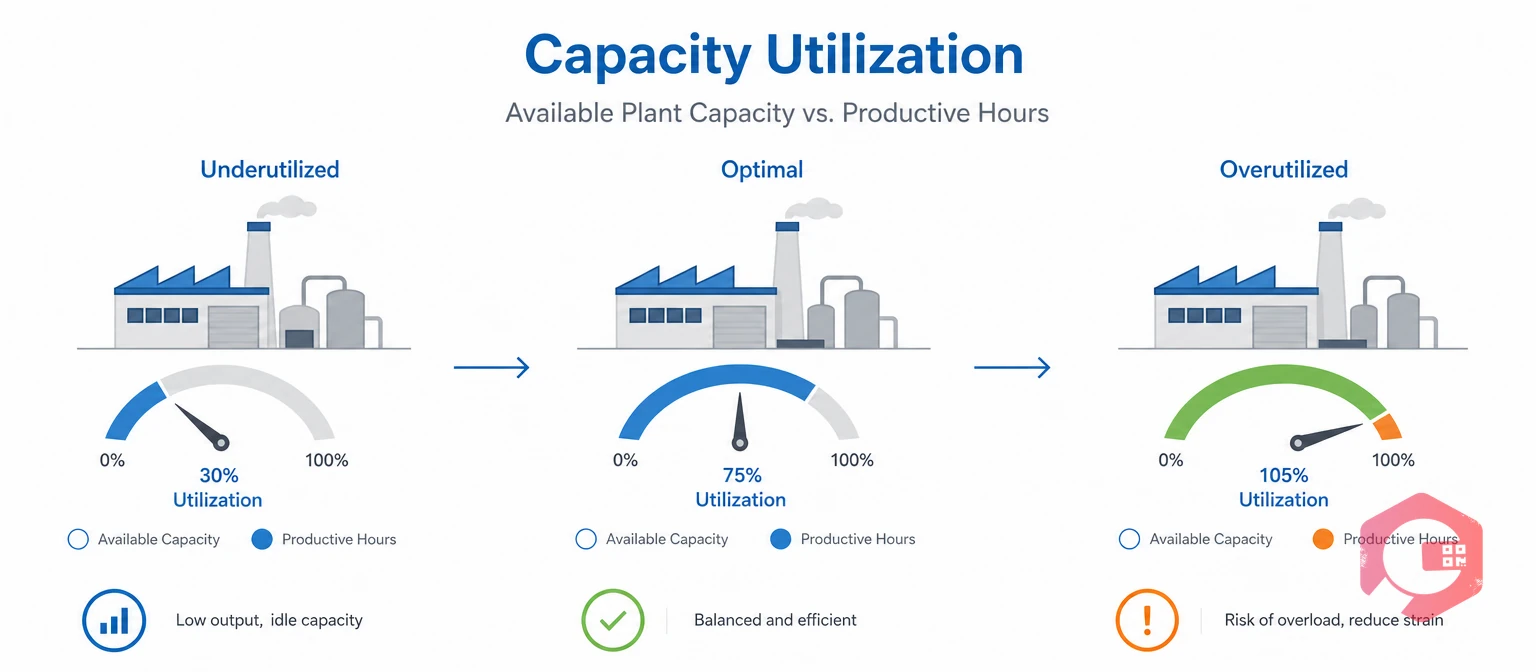
Capacity utilization is a KPI that shows how much of a plant's available capacity produces real output. Plants measure capacity in machine hours, labor hours, or units produced. Economists track the same idea across whole industries, as the capacity utilization entry on Wikipedia explains.
Most plants follow two versions of the metric:
The gap between the two is where capacity losses hide.
Capacity utilization asks how much of the available time the plant used. Overall equipment effectiveness (OEE) asks how well the running time performed, based on availability, performance, and quality. OEE grew out of total productive maintenance (TPM), which treats routine operator inspection as part of production. A machine can run all day and still waste capacity, so plants track both.
To calculate capacity utilization, divide actual productive time by available capacity and multiply by 100. Use the same unit for both numbers, such as machine hours per week.
The formula: Capacity utilization (%) = (Actual productive time ÷ Available capacity) × 100
Take a moulding line with 100 available machine hours in a week. Production planned 85 hours of load, and the line logged 70 productive hours.
That 15-hour gap is the number to attack. Closing a third of it adds five productive hours a week without buying a machine.
Want to see how your own running hours perform? Try the OEE calculator to measure availability, performance, and quality on your line.
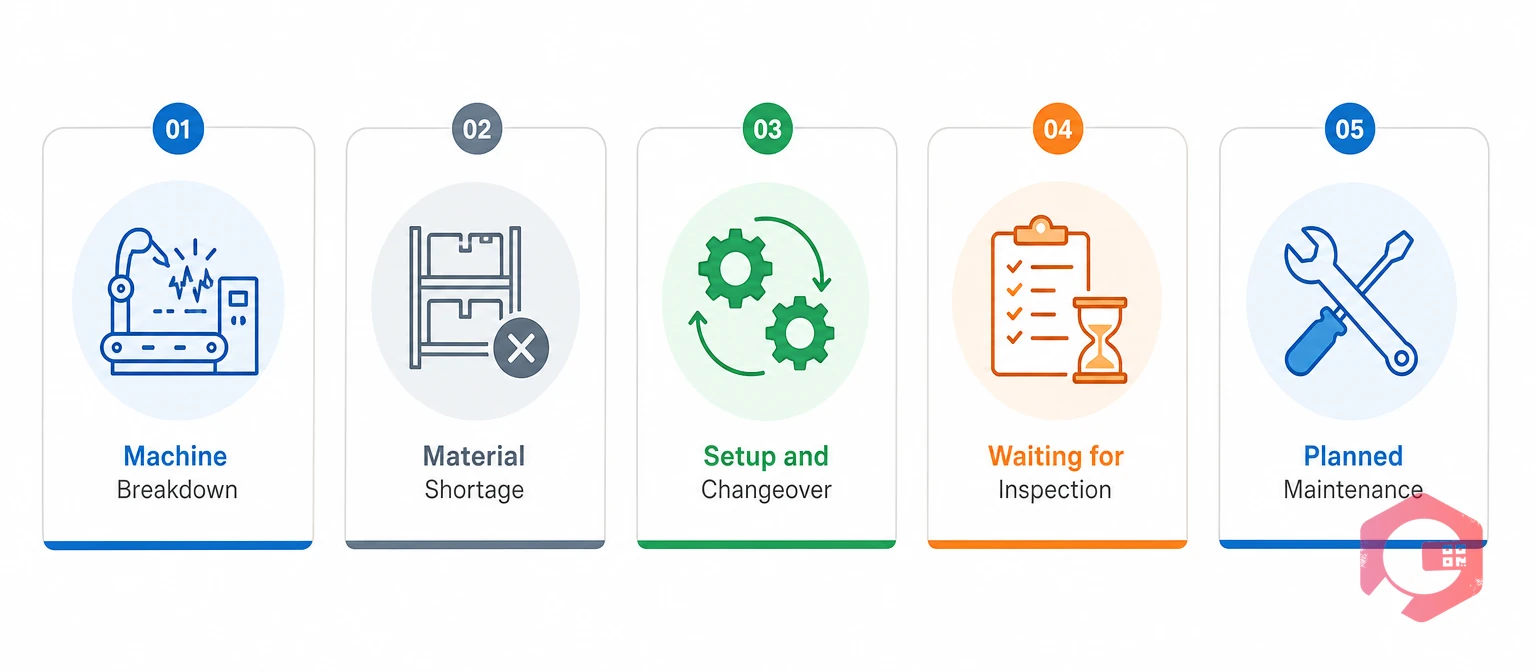
Capacity loss is any productive time that a plant schedules but does not get. In the example, five causes account for the full 15-hour gap.
Breakdowns are the largest single cause, and changeover time and inspection waits also trace back to machine and mould condition. A mould that needs long adjustment at each changeover adds hours. So does a first-off part that fails inspection. Neither shows up as a breakdown.
The one planned loss, an hour of scheduled maintenance, is the cheapest hour on the list. It exists to cut the five hours lost to breakdowns. Downtime tracking assigns each lost hour to a cause, so your list reflects real data instead of estimates.
A healthy capacity utilization range for most plants is 60% to 85%. In that band, the plant has enough load to cover its costs and enough slack to absorb breakdowns and rush orders.
The goal is not always 100%. A realistic level that supports on-time delivery is the target. The 85% to 90% band works as a watch zone, because any new loss can push the plant into overload.
This is why routine inspection needs protected time in the schedule. A plant running at 95% has no room for it, and the inspection it skips becomes the breakdown it cannot absorb.
Machine availability is the share of scheduled time that a machine is ready to run. Every unplanned stop lowers availability, and lower availability lowers capacity utilization. Machine maintenance protects capacity in three ways.
Most maintenance teams get the biggest gain from one change: moving from fix-when-it-breaks to a calendar and usage-based plan. Preventive maintenance software creates those tasks by date, run hours, or meter readings, so no machine depends on someone's memory.
Mould maintenance is the routine cleaning, inspection, and repair that keeps a mould producing parts that meet spec. Moulds shape plastic, rubber, and metal parts in processes such as injection moulding. A small defect in the mould repeats in every part.
That is why mould condition drives capacity. A mould that runs slowly, flashes, or sticks costs hours even when the machine is healthy.
A routine mould inspection checks cavity surfaces, vents, cooling lines, ejector pins, and guide pins and bushings. It also covers hot runner or heater parts where fitted. Operators do a quick visual check at every mould change. Toolroom technicians do the deeper inspection on a schedule set by shot count.
Shot count is the most useful trigger for moulds, because wear follows use, not the calendar. Cryotos supports usage-based PMs driven by meter readings. A shot-count reading, captured through IoT meter reading, can trigger the next mould inspection.
Machine and mould wear shows up in production data weeks before a failure. Watch for these signs in your daily reports.
Any one of these signs justifies an early inspection. Two or more together mean capacity is already leaking.
A routine inspection schedule gives every machine and mould check a trigger, an owner, and the capacity loss it prevents. The sample below shows how one plant might organize it. Adjust every interval to your OEM manuals, mould maker guidance, and duty cycle.
| Asset | Inspection Task | Suggested Trigger | Owner | Capacity Loss Prevented |
|---|---|---|---|---|
| Machine (all) | Check lubrication, leaks, unusual noise, and heat | Start of every shift | Operator | Breakdowns |
| Machine (hydraulics and clamp) | Check oil level, hoses, and clamp condition | Weekly | Maintenance technician | Breakdowns |
| Machine (heating and cooling) | Check chiller, water lines, and heater bands | Monthly | Maintenance technician | Slow cycles and breakdowns |
| Mould (at changeover) | Visual check of cavity, parting line, vents, and ejector pins | Every mould change | Operator or setter | Flash, short shots, and changeover delays |
| Mould (cooling channels) | Flow test and scale cleaning | Set shot interval or quarterly | Toolroom technician | Longer cycle time |
| Mould (guide pins, bushings, ejectors) | Lubricate and measure wear | Set shot interval | Toolroom technician | Sticking parts and misalignment |
| Mould (storage) | Apply rust preventive, cover, and log condition | Before storage and on every return | Toolroom technician | Rework and repair before the next run |
Log every result, not only the failures. A clean inspection is data too, because it shows which intervals are safe to lengthen. Digital maintenance checklists let operators and toolroom staff record each check on a phone, with photos of any defect.
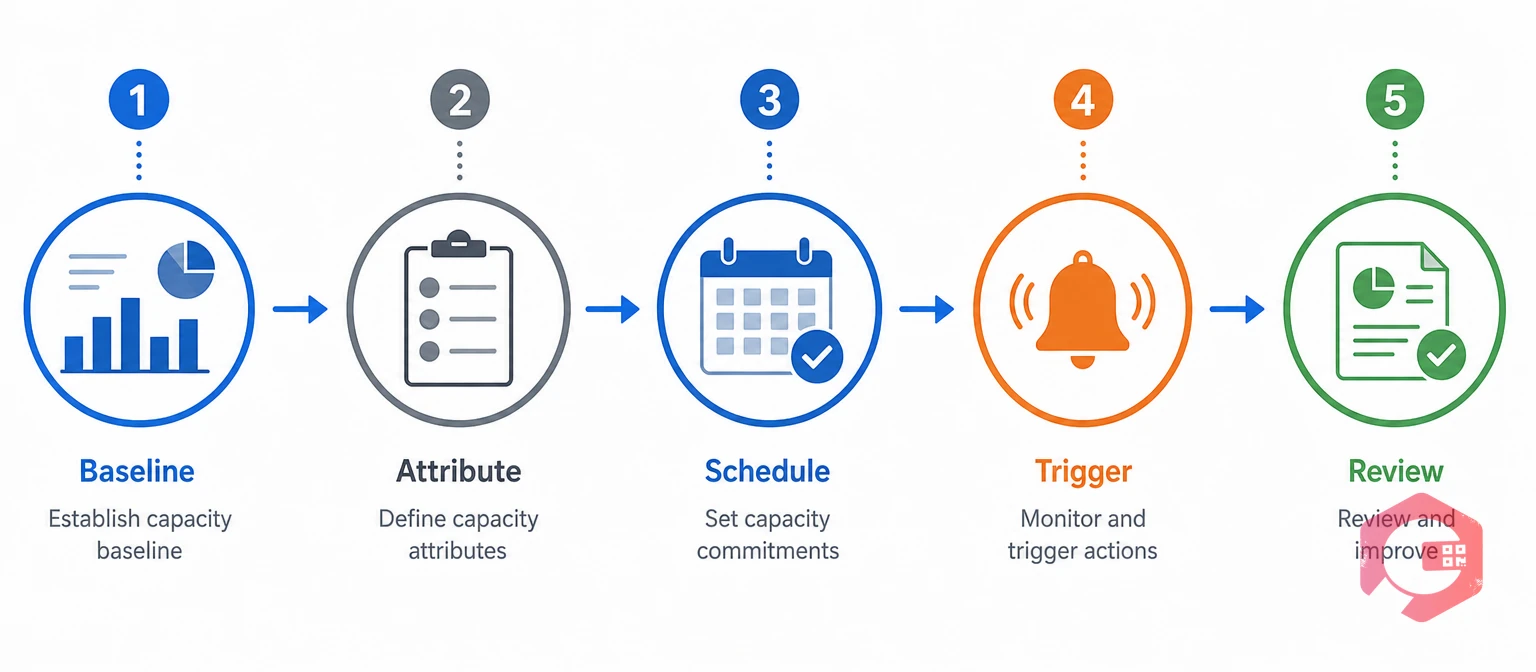
The Capacity Protection Framework is a five-step routine that links inspection work to the hours it protects. Plants that apply it treat inspection as part of production planning, not as an interruption.
The Capacity Protection Framework:
A common mistake is to schedule inspections only when the plant is quiet. Plants that run above 90% never get a quiet period, so inspections slip and breakdowns fill the gap. Reserve inspection time in the plan first, then load production around it.
A CMMS tracks capacity utilization by recording every stop, its cause, and its length. It also schedules the inspections that prevent those stops. Cryotos brings that data into one place for every machine and mould.
Maintenance teams using Cryotos have reported up to 30% reduction in unplanned downtime and 25% faster repair turnaround. Less unplanned downtime means more of the planned load turns into productive hours.
Capacity utilization is the percentage of available production time or output that a plant uses productively. If a line could run 100 hours and runs productively for 70, its utilization is 70%.
Most plants aim for 60% to 85%. Below 60% signals excess capacity and higher unit cost, while above 90% raises the risk of delays and breakdowns. The right level depends on your demand pattern and how much time you need for maintenance.
Worn or dirty moulds lengthen cycle times, cause rejects, and trigger stoppages, all of which cut productive hours. Routine inspection catches these problems early, so repairs happen in planned windows instead of mid-shift.
Operators should check moulds visually at every mould change, and toolroom staff should inspect them in depth at shot-count intervals. Follow the mould maker's guidance first, then adjust the interval based on what your inspections find.
No. Running at 100% leaves no time for maintenance, changeover variation, or urgent orders. A sustainable level that protects on-time delivery and equipment health is a better target.
Every productive hour starts with a machine and a mould that are ready to run. Schedule a free demo to see how Cryotos tracks capacity losses, schedules machine and mould inspections, and keeps planned hours productive.



Cryotos AI predicts failures, automates work orders, and simplifies maintenance—before problems slow you down.



