
A cost-optimized maintenance strategy is a disciplined approach to allocating PM spend based on the actual failure cost and risk profile of each asset — rather than applying the same schedule to everything in your facility. According to Plant Engineering's maintenance benchmarks, facilities with reactive-heavy programs spend 3–5 times more per repair than those with structured preventive programs. Yet throwing money at PM is not the answer either — over-maintenance wastes labor, accelerates component wear through unnecessary disassembly, and diverts budget from genuinely high-risk assets. The right balance requires a clear methodology: calculate what each failure actually costs, compare it to the cost of the PM that prevents it, and schedule accordingly. This guide walks through exactly that process — with a decision framework, a PM frequency formula, and practical guidance on using CMMS data to keep your cost-risk balance calibrated over time.

Most maintenance budgets grow year over year — not because assets are getting older, but because teams keep adding PM tasks without ever removing the ones that no longer make sense. The result is a bloated schedule full of tasks performed on healthy equipment while genuinely risky assets quietly fail. At the same time, some facilities swing the other way and cut PM budgets to hit a quarterly target, then spend three times that amount scrambling to recover from an unplanned breakdown. Both extremes are expensive. The goal is to find the precise middle: enough preventive maintenance to hold failure risk at an acceptable level, without funding tasks that cost more than the failures they prevent.
Three patterns drive cost overruns in most maintenance departments:
Before you can make a rational decision about how much PM spend is justified, you need an honest number for what downtime actually costs. Most estimates focus on lost production, but the real figure is substantially higher. According to McKinsey research on industrial operations, unplanned downtime costs manufacturers an average of $260,000 per hour across sectors — with heavy process industries reporting figures two to three times higher.
A practical cost-of-downtime formula looks like this:
Total Downtime Cost = (Lost Revenue per Hour × Hours Down) + Labor Overtime + Emergency Parts Premium + Quality Scrap + Regulatory/Safety Penalties + Customer Penalty Clauses
Walk through a real example. A packaging line produces 500 units per hour at $40 margin per unit. An unplanned gearbox failure causes 8 hours of downtime. The direct production loss is $160,000. Add $4,200 in overtime for the repair crew, $1,800 in expedited shipping for a replacement gearbox, and $3,000 in scrapped product. Total: $169,000. The gearbox PM that could have prevented this costs $600 every six months. That is a 140:1 return on a single PM task — yet it is exactly the kind of task that gets cut when budgets tighten. Use the Cryotos unplanned downtime calculator to run this math for your own assets before making any PM budget decision.
Not every maintenance strategy carries the same cost or risk profile. The table below maps the four primary approaches against the dimensions that matter most for budget decisions: relative PM spend, downtime risk, best-fit asset criticality, and implementation requirements.
| Strategy | Relative PM Spend | Downtime Risk | Best-Fit Assets | Key Requirement |
|---|---|---|---|---|
| Run-to-Fail (Reactive) | Very Low (upfront) | Very High | Non-critical, easily replaced components | Spare parts buffer; fast repair capability |
| Time-Based PM | Medium | Medium | Assets with predictable wear cycles | Accurate OEM service intervals; scheduling discipline |
| Condition-Based Maintenance | Medium-High | Low | High-criticality assets with measurable degradation | Sensors or regular inspections; threshold rules |
| Predictive Maintenance (PdM) | High (tool investment) | Very Low | Mission-critical assets where failure is catastrophic | IoT sensors; data analytics platform; trained team |
The goal is not to pick one strategy for your entire facility. A cost-optimized approach applies run-to-fail on $50 conveyor rollers, time-based PM on standard motors, condition-based maintenance on your most critical production lines, and predictive tools where catastrophic failure is unacceptable. Mixing strategies based on asset criticality and failure cost is the core discipline of reliability-centered maintenance (RCM).
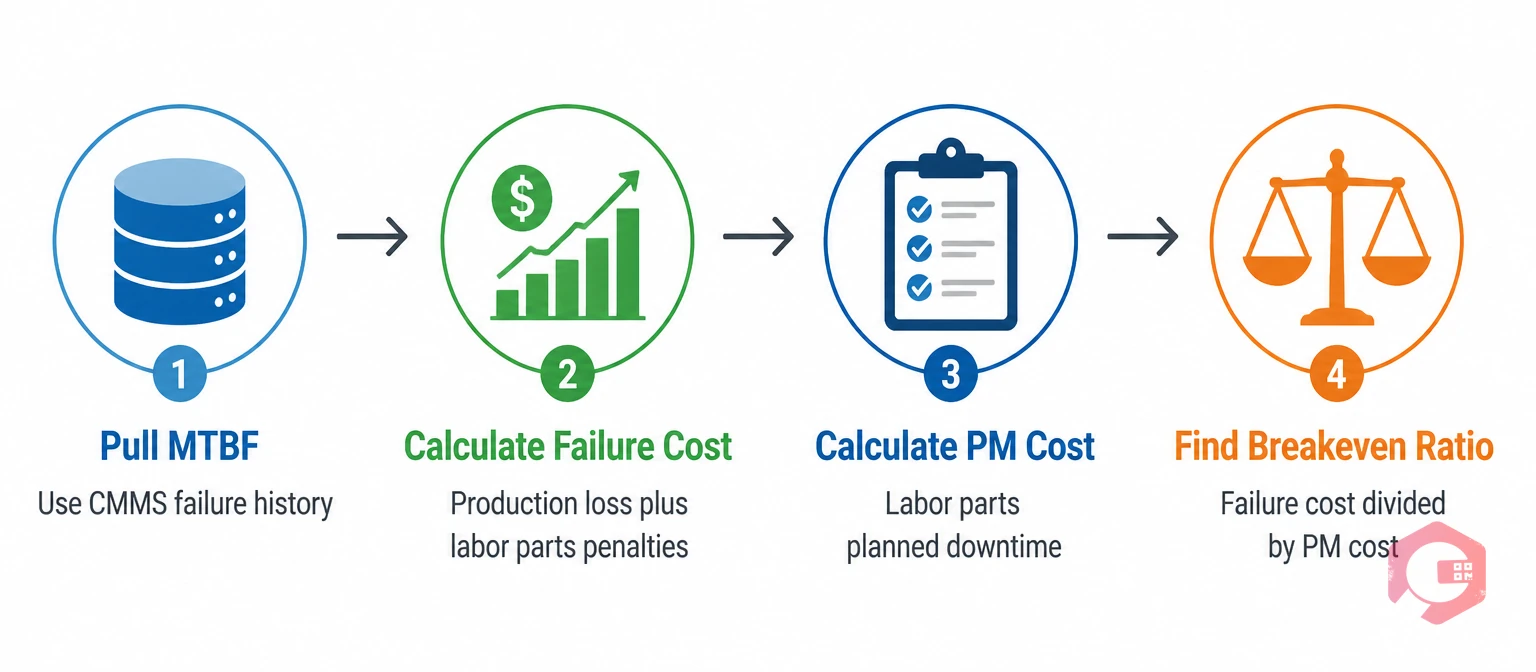
The right PM interval is the one where the total cost of maintaining the asset equals — or just falls below — the expected cost of letting it fail. Here is a four-step process to find that number for any asset.
Step 1 — Pull your MTBF. Use your CMMS failure history to calculate Mean Time Between Failures for the asset. If you do not have enough data, start with the OEM recommendation and refine as you collect more. The MTBF calculator makes this quick.
Step 2 — Calculate your failure cost. Use the downtime cost formula from the section above. Include production loss, repair labor, parts, and any downstream penalties.
Step 3 — Calculate your PM cost. Include technician labor time, any parts consumed during the PM, and the cost of planned downtime windows if the PM requires a shutdown.
Step 4 — Find your breakeven ratio. Divide your failure cost by your PM cost. A ratio above 3:1 almost always justifies more frequent PM. A ratio below 1.5:1 suggests you may be over-maintaining, or that the task needs to be redesigned to reduce labor time. For assets with a ratio below 1:1 — where the PM costs more than the failure — run-to-fail is the correct strategy, provided the failure carries no safety or regulatory consequence.
Repeat this exercise annually as part of your PM program review, or whenever asset failure patterns change significantly. The mean maintenance cost calculator can help you track cost trends over time and flag assets where the economics are shifting.
Over-maintenance is a real and costly problem. It ties up technician hours, accelerates wear through unnecessary disassembly, and burns budget that could fund higher-value work. Watch for these indicators:
Under-maintenance is usually more dramatic and more expensive than over-maintenance — it just shows up less frequently, which makes it easier to dismiss as bad luck. These patterns signal that your PM program is not covering the risk it should be:

The frameworks above work on paper, but executing them at scale across dozens or hundreds of assets requires a system that can track failure history, calculate costs, trigger work orders dynamically, and report on outcomes in real time. That is precisely where a modern maintenance management system closes the gap between strategy and execution.
Cryotos supports both static and dynamic PM scheduling, which is critical for cost optimization. Static PMs fire on calendar intervals — useful for assets with predictable wear. Dynamic PMs trigger based on actual operating data: runtime hours, machine cycles, meter readings, or IoT sensor thresholds. This means a compressor that runs 18 hours a day in summer and 8 hours in winter gets serviced based on what it has actually done, not on a date that assumes constant load. The result is fewer unnecessary PMs during low-use periods and no missed PMs during high-demand cycles — a direct improvement in both cost efficiency and reliability. The IoT meter reading feature connects live sensor data directly to PM triggers, removing the manual step of reading gauges and updating schedules.
On the reporting side, Cryotos's BI dashboard surfaces OEE, downtime by asset and department, MTBF trends, and maintenance cost per asset — giving managers the data they need to run the breakeven analysis described earlier on a rolling basis rather than as an annual exercise. When a work order closes, the system captures the actual labor hours, parts used, and downtime duration, building the failure history that makes future PM decisions sharper. Teams using Cryotos have reported up to 30% reduction in unplanned downtime and 25% faster repair times — not by spending more on maintenance, but by spending it in the right places.
For teams starting the optimization journey, the maintenance audit checklist provides a structured starting point for reviewing your current PM program before making any scheduling changes.
Most reliability benchmarks target 80:20 or better — meaning 80% of maintenance hours are planned and only 20% are reactive. World-class facilities often reach 90:10. If your ratio is below 70:30, your PM program likely has coverage gaps that are costing more in reactive repairs than a structured PM investment would.
Run the breakeven analysis: divide the cost of the failure the PM prevents by the cost of the PM itself. If the ratio is above 3:1, keep it. If it is below 1.5:1, redesign the task or extend the interval. If it is below 1:1 and the failure carries no safety or regulatory consequence, eliminate it and document your decision.
Not always. Condition-based maintenance requires sensors or regular inspections to measure asset health, which carries its own cost. For assets with very predictable wear patterns and low sensor ROI, time-based PM is often more economical. The right choice depends on asset criticality, failure cost, and the cost of monitoring.
A CMMS like Cryotos helps reduce costs in three ways: it prevents failures through scheduled and dynamic PMs, it shortens repair time by giving technicians work order history and asset documentation on their mobile devices, and it surfaces the data needed to optimize PM intervals over time — so you stop spending money on tasks that cost more than the failures they prevent.
The six most important for cost optimization are: MTBF (failure frequency), MTTR (repair speed), unplanned downtime percentage, maintenance cost per asset, PM compliance rate, and OEE on critical assets. Tracking all six monthly gives you enough signal to catch both over-maintenance and under-maintenance patterns before they become expensive.
Balancing PM spend against downtime risk is not a one-time project — it is an ongoing discipline that gets sharper as you collect more failure data and refine your cost models. Cryotos gives your team the scheduling engine, the real-time downtime tracking, and the reporting depth to run that discipline at scale. Book a demo to see how Cryotos can help your team build a maintenance strategy that controls costs without accepting preventable risk.


Cryotos AI predicts failures, automates work orders, and simplifies maintenance—before problems slow you down.


