
Factory floor intelligence combines IoT sensors, Overall Equipment Effectiveness (OEE), and autonomous maintenance into one connected system that turns raw machine data into maintenance decisions — without waiting for a breakdown. Manufacturers using this approach report up to 30% reduction in unplanned downtime and OEE gains of 10–20 percentage points within 12 months of deployment. The shift is real: factories that once ran on scheduled rounds and paper logs are now operating with live sensor feeds, automated alerts, and operator-led maintenance routines that catch failures before they happen. This post breaks down how these three technologies work together, what the implementation path looks like, and the common mistakes that slow teams down.
Factory floor intelligence is the ability to collect, analyze, and act on machine data in real time — across every asset on your shop floor. It goes beyond simple monitoring. A truly intelligent factory floor connects sensor readings to performance metrics and feeds those metrics into maintenance workflows that operators can own and act on independently.
The concept matters because reactive maintenance — fixing things after they break — costs manufacturers between 3x and 5x more than planned maintenance, according to McKinsey's Industry 4.0 research. Factories that build intelligence into their floor operations break this cycle by giving every technician and operator access to the same live data that maintenance managers used to review days or weeks later.
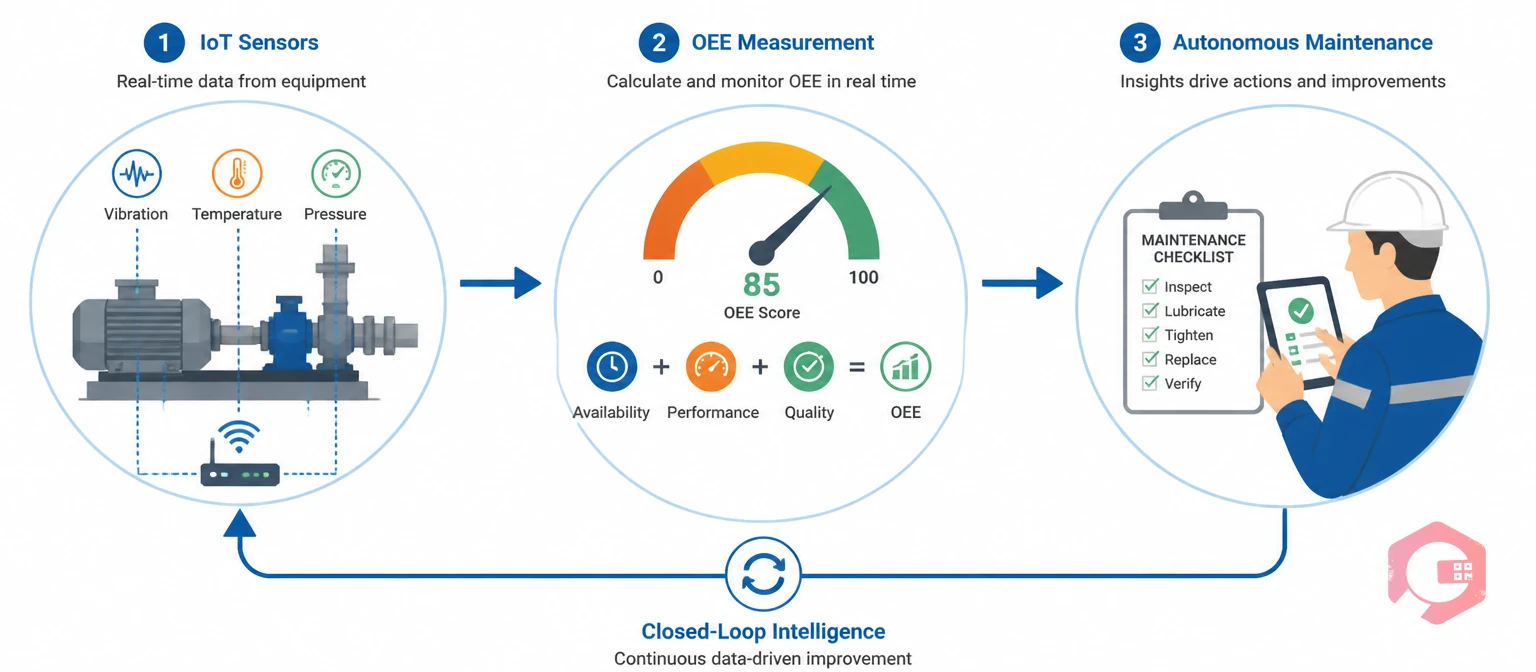
These three pillars work as a system, not in isolation:
When these three work together, IoT data feeds OEE calculations in real time, and OEE trends trigger autonomous maintenance tasks automatically — closing the loop between sensing, measuring, and acting.
Traditional OEE calculation depends on manual data entry — operators log downtime reasons, quality counts, and cycle times on paper or in a spreadsheet. This creates two problems: the data arrives too late to prevent failures, and it’s often inaccurate. A study by GE Digital found that manual OEE reporting has an average error rate of 15–20%.
IoT sensors solve both problems. When you attach vibration sensors to motors, temperature probes to bearings, and cycle counters to presses, your IoT meter reading system captures every data point automatically. Your OEE dashboard updates in real time — not at the end of a shift.
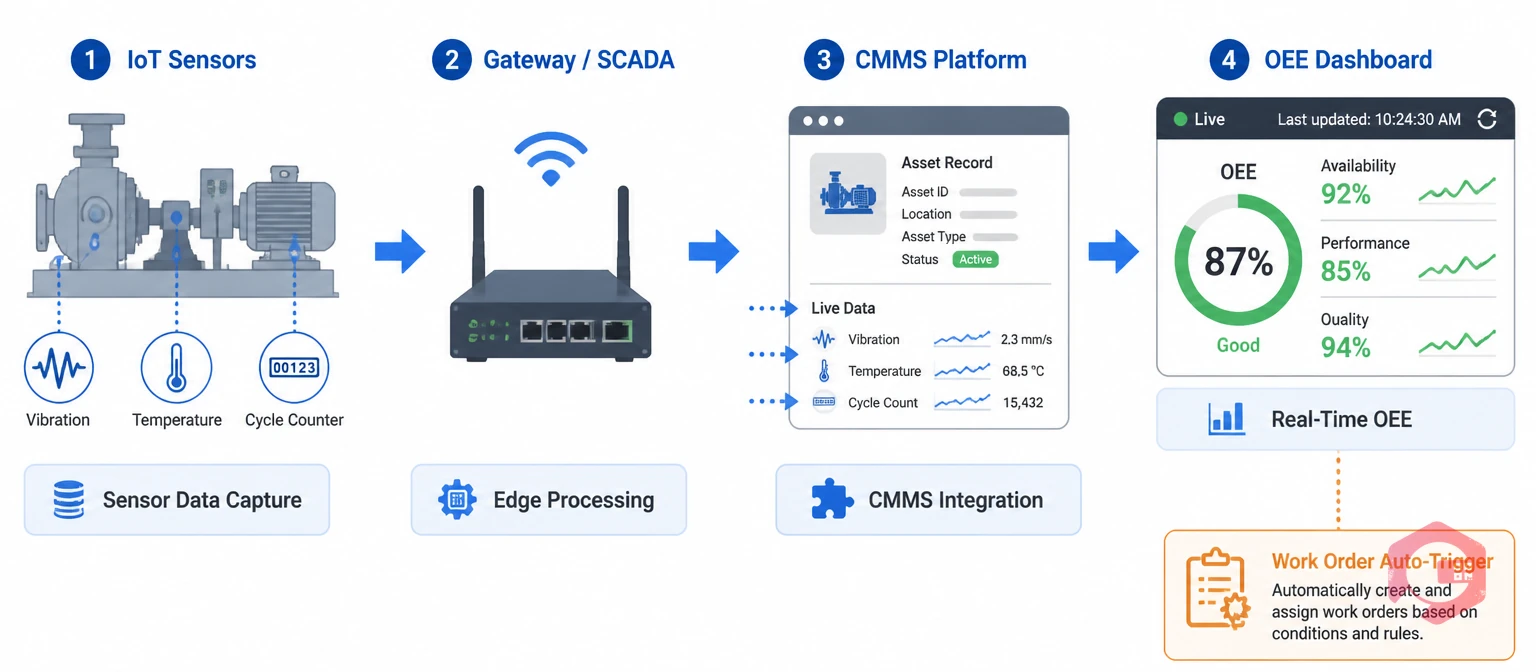
The path from raw sensor data to a maintenance decision follows three steps. First, sensors push readings to a gateway or edge device — often integrated with SCADA or PLC systems. Second, the data flows into your CMMS platform, where it’s mapped to specific assets and fed into OEE calculations. Third, when a reading crosses a defined threshold — say, vibration amplitude exceeds 4 mm/s on a critical pump — the system triggers a work order automatically.
This is where Cryotos BI Dashboard adds value. It aggregates IoT meter readings alongside work order history, downtime logs, and quality data to give maintenance teams a single OEE view per asset, per line, or per plant. Instead of chasing data across three spreadsheets, your team sees one number and knows exactly which asset needs attention today.
Autonomous maintenance — the first pillar of Total Productive Maintenance (TPM) — shifts routine care from maintenance specialists to machine operators. Operators inspect their equipment daily, clean and lubricate as scheduled, and flag abnormalities before they escalate. When it works, failure rates on operator-maintained assets drop by 25–40%, according to the Japan Institute of Plant Maintenance.
In practice, autonomous maintenance means operators work from standardized checklists — not memory. Each checklist is tied to a specific asset, includes reference photos for normal vs. abnormal conditions, and takes 5–15 minutes to complete at the start or end of a shift. When operators find an issue, they log it immediately via mobile, triggering a corrective work order before the next shift runs the machine.
Cryotos supports this directly with customizable maintenance checklists that operators can access from any mobile device — including in offline mode. Checklists can be built from existing Excel templates or digitized via OCR, so implementation doesn’t require starting from scratch.
The link between autonomous maintenance and OEE is direct. Most OEE losses in manufacturing fall into six categories: breakdowns, setup and adjustment, small stops, reduced speed, startup defects, and in-process defects. Autonomous maintenance addresses the first four by ensuring machines are clean, properly lubricated, and running within spec before each shift starts. In plants that have implemented full autonomous maintenance programs, OEE scores typically improve from an industry average of 60–65% toward the world-class benchmark of 85%.
Understanding the practical differences helps maintenance managers make the case for IoT investment to leadership. Here’s how the two approaches compare across the most important operational dimensions:
| Dimension | IoT Monitoring | Traditional Monitoring |
|---|---|---|
| Data Frequency | Continuous / real-time | Manual rounds (once per shift or day) |
| OEE Accuracy | High (automated capture) | Lower (manual entry errors 15–20%) |
| Failure Detection | Predictive (before failure) | Reactive (after failure or near failure) |
| Alert Speed | Instant (SMS, WhatsApp, email) | Delayed (next round or shift handover) |
| Maintenance Trigger | Threshold-based automatic work order | Human observation or calendar-based PM |
| Cost to Operate | Higher upfront; lower long-term | Lower upfront; higher long-term downtime cost |
| Scalability | Scales across hundreds of assets | Constrained by technician headcount |
The shift to IoT monitoring doesn’t eliminate manual inspection — it focuses human attention where it matters most, backed by data that confirms where abnormalities are developing.
Most factories don’t need to replace all their equipment to get started with floor intelligence. A phased approach — starting with critical assets, proving ROI, then expanding — is the most practical path. Here’s how to structure it.
Start with your highest-impact assets: the machines whose downtime directly affects production throughput or customer delivery. For each asset, identify the failure modes that cause the most downtime using your historical work order data. Then map each failure mode to the sensor type that detects it earliest — vibration sensors for bearing wear, temperature probes for motor overheating, current sensors for load anomalies. A practical starting point is 10–15 critical assets per production line. Use your IoT sensor deployment validation checklist to confirm each sensor is calibrated, connected, and pushing data correctly before moving to the next phase.
Sensor data is only useful when it feeds into a system that tracks context — which asset, which shift, which product line. Connect your sensor gateway to your CMMS via API or direct integration. Cryotos integrates with SCADA, PLC, and edge computing devices so sensor readings map automatically to asset records. Once connected, configure your OEE calculator thresholds: define what “planned downtime” vs. “unplanned downtime” means for each asset, set quality pass/fail criteria, and confirm cycle time baselines. Your OEE dashboard should update within minutes of each shift start.
With IoT and OEE running, the final step is closing the loop with autonomous maintenance. Assign each critical asset to a primary operator. Build a 5–15 minute daily inspection checklist that covers the sensor-monitored parameters — if the vibration sensor is watching bearing condition, the operator checklist should include a manual touch-and-listen check of the same bearing. Link checklist completion to your preventive maintenance software so that missed inspections automatically escalate to the maintenance supervisor. Track checklist completion rates alongside OEE trends — you’ll typically see OEE start improving within 60–90 days of consistent autonomous maintenance execution.

Many factories invest in sensors and dashboards but see limited results. The most common reasons aren’t technical — they’re operational.
IoT sensors automate the data collection that OEE calculations depend on — capturing machine availability, cycle counts, and quality readings in real time instead of relying on manual operator logs. This removes the 15–20% inaccuracy typical of manual OEE reporting and allows maintenance teams to identify and respond to performance losses within minutes rather than at the end of a shift. Factories using IoT-driven OEE tracking typically see a 10–15 percentage point OEE improvement within the first year of deployment.
Autonomous maintenance reduces unplanned downtime by catching early-stage abnormalities — loose fasteners, contamination, lubrication gaps — during daily operator inspections, before they cause a breakdown. When operators run structured checklists every shift, small issues get logged and corrected as minor work orders rather than escalating into multi-hour stoppages. Studies from TPM-implementing plants show a 25–40% reduction in unplanned downtime within 18 months of a fully operational autonomous maintenance program.
The world-class OEE benchmark is 85% — meaning 85% of planned production time results in good product at the designed cycle rate. Most manufacturers operate between 60–75% OEE. If your current OEE is below 65%, start by focusing on the Availability component (reducing unplanned downtime) before optimizing Performance or Quality. Use the free OEE calculator to benchmark your current score and identify which of the three components is your biggest opportunity.
Yes — a modern maintenance management software platform like Cryotos connects IoT sensor data, OEE dashboards, and autonomous maintenance checklists in one system. When a sensor reading crosses a threshold, the CMMS automatically creates a work order and assigns it to the right operator or technician. Checklist completion data flows back into the asset record, giving maintenance managers full visibility into both machine health and operator activity in one view.
Factory floor intelligence isn’t a single technology — it’s what happens when IoT sensors, OEE measurement, and autonomous maintenance work as one connected system. Cryotos brings all three together: real-time IoT meter readings feed directly into your OEE BI dashboard, while operator checklists and automated work orders keep your team aligned and your assets running. If you’re ready to move from reactive firefighting to proactive floor intelligence, explore how Cryotos supports connected manufacturing maintenance.


Cryotos AI predicts failures, automates work orders, and simplifies maintenance—before problems slow you down.


