
Failure history in your CMMS is the single most underused asset your maintenance team has. When you analyze historical failure data — what broke, when it broke, how long it took to fix, and what caused it — you can shift from reacting to breakdowns to preventing them on a schedule grounded in how your equipment actually behaves. According to a Deloitte analysis on predictive maintenance, organizations that use equipment failure data to inform maintenance strategy reduce unplanned downtime by up to 40% and cut maintenance costs by 10–25%.
This guide covers exactly how to pull failure history out of your CMMS, what to look for in the data, and how to turn those patterns into a maintenance schedule that reduces breakdowns before they disrupt production.
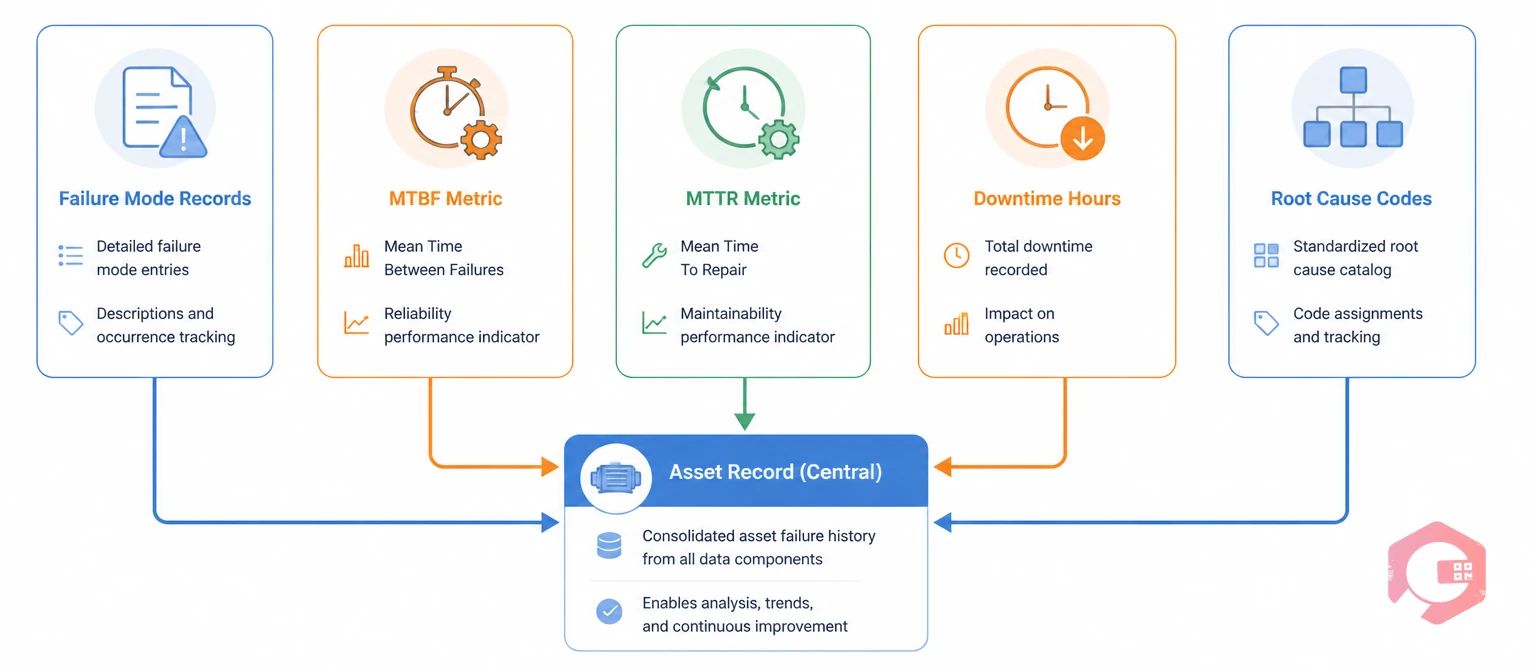
Failure history in a CMMS is the cumulative record of every breakdown, corrective work order, downtime event, and root cause analysis linked to a specific asset. Every time a technician closes a work order, logs a failure mode, records a repair duration, or documents a root cause, they are adding to that asset's failure history. Over months and years, this data builds into a pattern library that reveals when assets tend to fail, why they fail, and how long repairs take.
A well-configured CMMS stores this history in structured fields: failure date, failure code, downtime hours, parts consumed, technician assigned, and root cause. When you query this data at scale — across assets, departments, or time windows — failure patterns emerge that are invisible to a team reacting to breakdowns one at a time.
Not all failure data has equal value for maintenance strategy. The most actionable data types are:
The gap between a reactive maintenance team and one that uses failure history strategically is not a technology gap — it is a data utilization gap. Both teams may use the same CMMS. The difference is whether the failure data they log gets analyzed and acted on.
| Dimension | Reactive Maintenance | Failure-History-Driven Maintenance |
|---|---|---|
| PM interval source | OEM manual or fixed calendar | Actual MTBF from asset's own failure history |
| Task design | Generic checklist | Targeted tasks that address documented failure modes |
| Priority setting | First-come, first-served | Based on downtime cost and repeat failure rate |
| Parts stocking | Based on intuition or past orders | Based on parts consumed in historical work orders |
| Root cause follow-up | Rarely documented | Systematically logged and reviewed monthly |
| Schedule adjustment | Never or rarely updated | Reviewed quarterly using MTBF trend data |
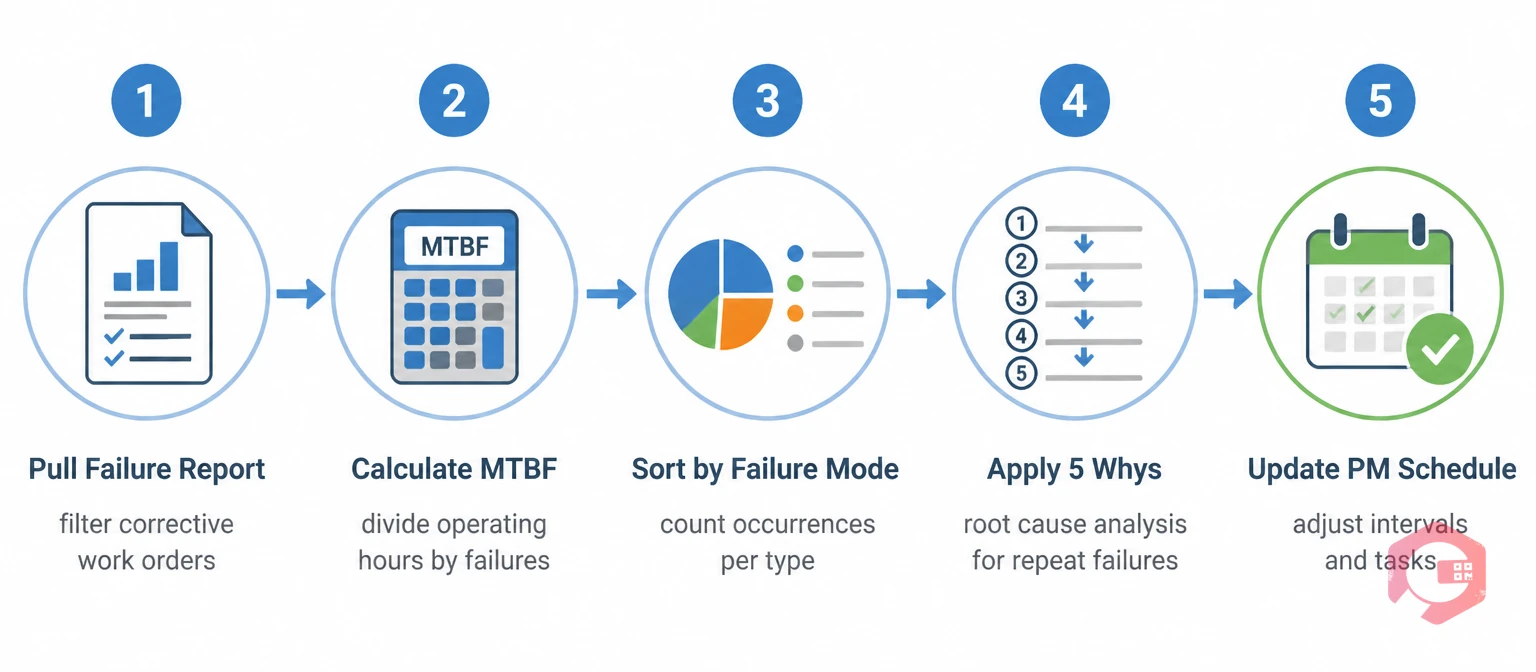
Analyzing failure history is not a one-time project — it is a recurring review cycle. Here is a practical framework for doing it consistently:

The most direct application of failure history is refining your preventive maintenance schedule. OEM-recommended intervals are a starting point, not an endpoint. They are based on typical operating conditions — not your facility's specific load cycles, environment, or process chemistry. Your CMMS failure history tells you how your assets actually behave, and that data should take precedence over generic recommendations once you have 12 months or more of reliable records.
There are three specific adjustments failure history supports. First, interval calibration: if your MTBF data consistently shows failures occurring at 900 hours but your current PM is set at 2,000 hours, you are running assets 1,100 hours past their reliable operating window. Second, task prioritization: if lubrication-related failures account for 60% of your bearing failures, a lubrication task belongs at the top of every PM checklist for rotating equipment in that environment. Third, frequency reduction for stable assets: if an asset has zero unplanned failures in two years and MTBF is trending upward, you may be able to extend its PM interval without increasing risk — freeing technician hours for higher-priority equipment.
A reliability-centered maintenance approach formalizes this logic by matching the maintenance task type (preventive, condition-based, or run-to-failure) to the failure mode's characteristics. Your CMMS failure history is the data source that makes RCM decisions defensible rather than theoretical.
Failure history does not just optimize your maintenance schedule — it tells you exactly which parts your team needs on the shelf. The most common cause of extended MTTR is not diagnostic delay; it is waiting for parts that were not stocked because no one analyzed which parts your assets actually consume during failures.
Your CMMS work order history contains a parts consumption record for every corrective job ever completed. Querying this data by asset class and failure mode gives you a consumption-based stocking model that replaces guesswork. If bearings of a specific size appear in 15 of the last 20 corrective work orders on your pump assets, those bearings belong in your minimum-stock inventory with an automatic reorder trigger.
Cryotos's spare parts inventory software links parts consumption directly to work orders, so this analysis is built into the data you are already capturing. Setting minimum-stock thresholds based on failure history — rather than intuition — reduces both stockouts and the over-stocking that ties up working capital in parts that sit unused for years.
Once you have 12–18 months of well-structured failure history, you have the foundation to move from preventive to condition-based maintenance on your highest-criticality assets. Failure history tells you which assets fail most often, which failure modes precede catastrophic breakdowns, and which operating parameters correlate with failure onset.
This knowledge guides sensor deployment. If your failure history shows that 80% of motor failures on a specific asset class are preceded by a temperature increase above 75°C, placing a temperature sensor on those motors gives you an early warning system grounded in actual failure behavior — not a theoretical threshold from an equipment datasheet. When that threshold is crossed, your CMMS can automatically generate a condition-based work order before the failure occurs.
Cryotos supports IoT integration via IoT meter reading, connecting sensor data directly to your work order system so that condition-based triggers translate automatically into actionable maintenance tasks. The combination of historical failure data and real-time condition monitoring is the core of a mature predictive maintenance program.
The value of failure history depends on how accessible it is. If pulling a failure trend report requires a custom export and several hours of spreadsheet work, it will not be reviewed consistently enough to drive decisions. Your CMMS should surface failure data in a format that maintenance managers can review in a weekly or monthly meeting without preparation time.
Cryotos's BI Dashboard tracks MTBF, MTTR, breakdown occurrences, downtime hours, and availability percentage in real time — broken down by asset, department, and plant. The Report Builder lets you schedule these reports to arrive in your inbox daily or weekly, so failure trends are reviewed as a routine part of operations rather than only in response to a major incident.
Key reports to build into your maintenance review cycle include: top 10 assets by unplanned downtime hours (monthly), MTBF trend per critical asset (rolling 90-day), repeat failure rate by asset and failure mode (monthly), and parts consumption vs. stock level for your highest-frequency corrective parts (weekly).
Failure history analysis is only as good as the data technicians enter when they close work orders. A failure history program fails when technicians consistently log "general breakdown" as the failure mode, leave root cause fields blank, or close corrective work orders without recording parts used. The analysis tools in your CMMS are only as useful as the data flowing into them.
Three practices build data quality without adding significant time to field work. First, make failure mode selection mandatory in work order close-out — not an optional dropdown. Second, provide a defined list of standardized failure codes that cover your actual equipment failure types, rather than a generic list that does not match what technicians encounter. Third, create a brief monthly review where the maintenance team discusses the top 5 recurring failures and what root cause data was or was not captured — this reinforces the connection between data quality and maintenance decisions.
Cryotos supports mandatory field configuration so that work orders cannot be closed without the required failure mode, root cause code, and resolution notes. This builds the data discipline into the workflow rather than relying on voluntary compliance.
In most facilities, 6–12 months of structured failure data is enough to identify your highest-frequency failure modes and calculate a meaningful MTBF for critical assets. The more failure events per asset, the more statistically reliable your MTBF calculation becomes. Assets that fail less than 3 times per year may require 24 months of data before you can set a reliable PM interval based on failure history alone.
MTBF (Mean Time Between Failures) applies to repairable assets and measures the average operating time between consecutive failures. MTTF (Mean Time to Failure) applies to non-repairable components — like a seal or a fuse — and measures the average time from commissioning to failure. For maintenance strategy optimization on major equipment, MTBF is the more relevant metric. Use the MTTF calculator for individual component replacement planning.
Start by listing the 15–20 most common failure types for your specific asset classes — bearing failure, seal failure, electrical fault, lubrication failure, operator error, and so on. Map these to a standard failure taxonomy and configure them as a required dropdown in your work order close-out form. Review the list every 6 months and add new codes as new failure types emerge. Consistency over time matters more than having the perfect list on day one.
Yes — significantly. Analyzing parts consumption in historical corrective work orders gives you a consumption-based stocking model that replaces over-stocking based on intuition. Most maintenance teams find they are carrying 20–30% more inventory than their actual failure history justifies, while simultaneously being short on the specific parts their assets consume most frequently.
Turning failure history into a maintenance strategy requires the right data capture habits, a CMMS that surfaces failure trends automatically, and a review process that connects the data to decisions. Cryotos CMMS gives maintenance teams the structured failure tracking, MTBF and MTTR dashboards, IoT integration, and PM scheduling tools needed to move from reactive firefighting to a failure-data-driven program. Maintenance teams using Cryotos report a 30% reduction in downtime and 25% faster repair times — outcomes driven directly by the practices in this guide. Explore how Cryotos can help your team use failure history at cryotos.com.


Cryotos AI predicts failures, automates work orders, and simplifies maintenance—before problems slow you down.


