
Interpreting an oil analysis report means reading a set of lab results — viscosity, wear metals, contamination levels, and fluid condition markers — and determining whether your equipment's lubricant is still serviceable, needs action, or signals a developing failure. According to Noria Corporation, oil analysis can detect up to 70% of mechanical failures before they cause unplanned downtime when reports are read and acted on correctly. The challenge for most maintenance teams is knowing exactly which numbers matter, what they indicate, and what to do next. This guide walks you through every section of an oil analysis report in plain language — from viscosity and wear metals to contamination and fluid degradation markers — with practical action steps for each finding.
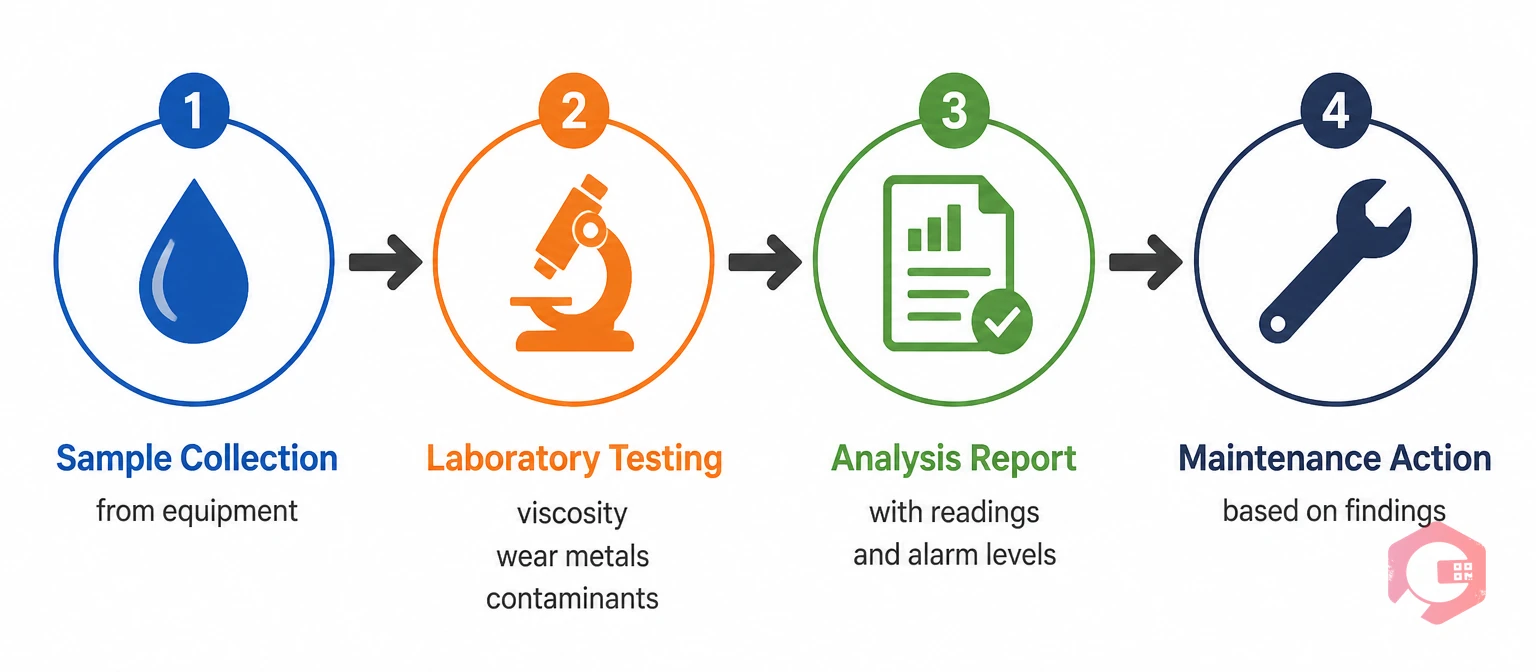
An oil analysis report is a laboratory document that characterizes the condition of a lubricant sample taken from a piece of equipment. It tells you three things simultaneously: the health of the oil itself, the health of the machine it lubricates, and whether any outside contaminants have entered the system. Most reports cover rotating equipment — engines, gearboxes, hydraulic systems, compressors, and turbines — though the same principles apply to any oil-lubricated component. When read correctly and trended over time, oil analysis functions as a non-invasive health check for your assets, giving maintenance teams weeks or months of warning before a failure occurs. It sits at the core of any mature condition-based maintenance program.
A standard oil analysis report arrives from the lab with three broad sections: fluid properties (what happened to the oil), contamination (what got in), and wear debris (what came off the machine). Each section contains multiple parameters, each with a measured value and — in most reports — a reference range flagged as normal, caution, or critical. Your job as a maintenance professional is to read across all three sections together, because a single parameter rarely tells the full story on its own.

Before you can interpret a report, you need to understand what each parameter measures and why it matters. The parameters below appear in most industrial oil analysis reports and form the foundation of any interpretation workflow.
Viscosity is the oil's resistance to flow — the single most critical fluid property on the report. It is measured at 40°C and 100°C and reported in centistokes (cSt). If viscosity has shifted more than 10% from the oil's fresh-oil specification, that is a flag requiring investigation. Viscosity rising beyond specification typically indicates oxidation, contamination with a heavier fluid, or fuel dilution in diesel engines causing the oil to thicken with soot. Viscosity falling below specification points to contamination with a lighter fluid (water, fuel, or solvent), shear degradation of VI improver additives, or mixing with the wrong oil grade. Either direction increases wear rates on bearings and gears.
Wear metals are the elemental fingerprints of machine component deterioration. Each element on the report traces back to a specific material in your machine. Iron comes from cylinder liners, gears, shafts, and housings. Copper and lead originate from bearings, bushings, and bronze components. Chromium indicates piston rings or chrome-plated components. Aluminum points to pistons, pump housings, or impellers. Silicon appears in wear metal panels but also flags external contamination from dirt and dust ingestion. The key is not just the presence of these metals, but their concentration in parts per million (ppm) and — critically — the trend from sample to sample. A doubling of iron content from one sample to the next is more significant than the absolute value alone.
Contamination data tells you what has entered the oil from outside. Water is the most damaging contaminant — even 0.1% water content in a hydraulic system can accelerate corrosion and reduce film strength significantly. Reports measure water as a percentage or in ppm. Silicon above 25–30 ppm (when paired with elevated aluminum) typically signals ingressed dirt and dust from a compromised air filter, breather, or seal. Sodium can indicate coolant leak entry (along with potassium, which is a glycol marker). Fuel dilution shows up via a drop in flash point and is reported as a percentage in most diesel engine oil reports.
Oxidation and nitration measure chemical degradation of the oil itself, reported in absorbance units from infrared spectroscopy. Oxidation increases as the oil reacts with oxygen under heat — it thickens the oil, promotes varnish and sludge formation, and depletes antioxidant additives. Nitration is common in natural gas engines and occurs when combustion blowby gases react with the oil's nitrogen compounds. Both values increase over service life; the question is whether they are rising faster than expected for the equipment's operating conditions. Many labs report these as absolute values with a flag when they exceed a defined limit — others compare against a fresh oil baseline.
Total Acid Number (TAN) measures the acidity of the oil — a rising TAN indicates oil oxidation and additive depletion. Total Base Number (TBN) measures the oil's remaining alkaline reserve, which neutralizes acidic combustion byproducts. TBN is critical in diesel engine oils; a TBN that has dropped to 50% of its fresh-oil value is a typical drain trigger. In industrial gear oils and hydraulic fluids, TAN is more relevant than TBN. A TAN above 2.0 mg KOH/g in a turbine oil or above 4.0 in a gear oil signals that the oil is approaching the end of its serviceable life.
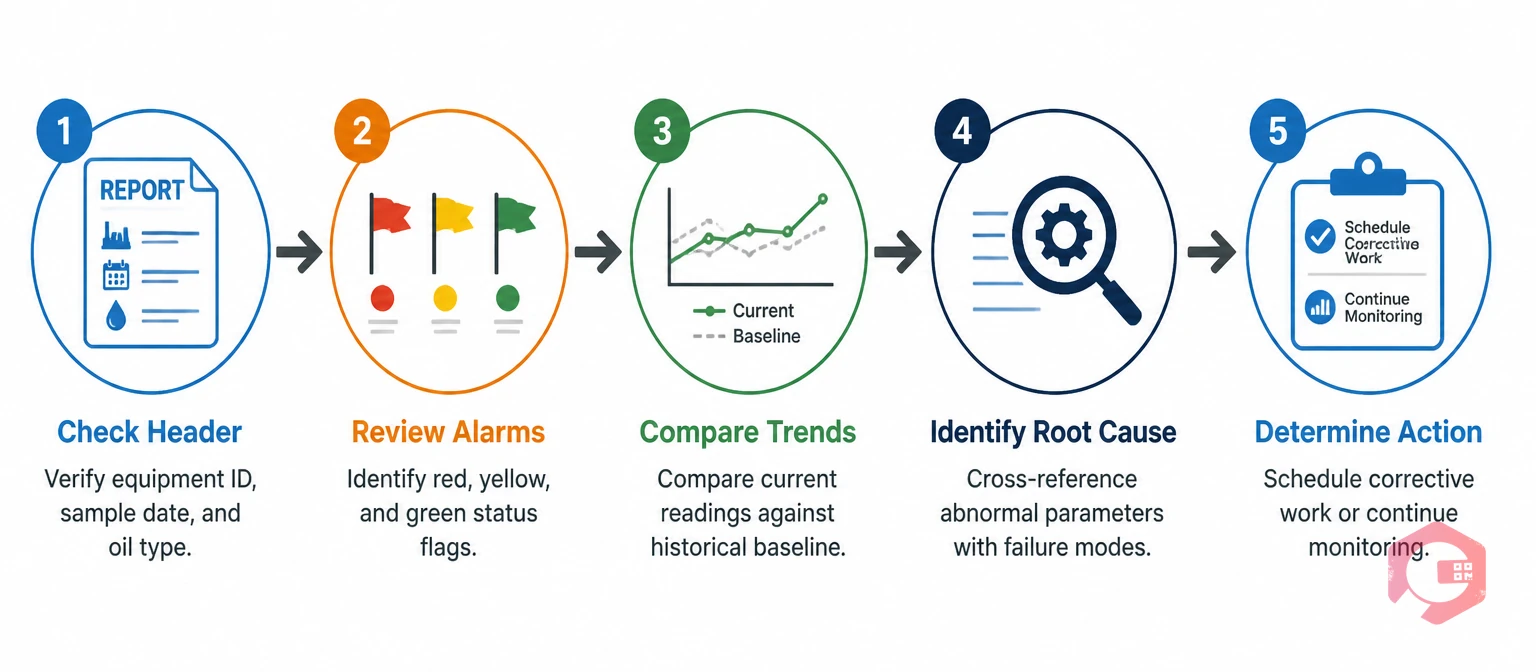
Most maintenance teams receive oil analysis reports and either file them without acting or react to individual flagged parameters without context. The correct interpretation process reads the full report as a system, not a list of isolated numbers. Here is a reliable five-step approach.
Every oil analysis program runs on alarm limits — the thresholds that separate normal operation from investigation-required and action-required states. Understanding how these limits are set — and their limitations — prevents both over-reaction and under-reaction to report findings.
Labs use two types of alarm limits. Statistical limits are derived from population data across thousands of machines of the same type and oil. They represent what is typical for that machine class. Trend limits are specific to your machine and your previous samples — they flag when a parameter has changed significantly from your own baseline, regardless of whether the absolute value is statistically abnormal. The best oil analysis programs use both: statistical limits to catch absolute exceedances and trend limits to catch developing failures early.
According to Machinery Lubrication, the most common mistake maintenance teams make is waiting until a parameter hits a critical alarm before taking action. By that point, a bearing or gear may already be in accelerated wear. The caution zone — often 1.5× to 2× the normal limit — is where investigations should begin, not where action ends.
Alarm levels also differ by equipment criticality. A gearbox driving a redundant conveyor might tolerate a caution-level iron reading for two more weeks until the next planned shutdown. A gearbox on a single-line critical compressor at the same reading warrants immediate investigation. Your preventive maintenance software should link oil analysis findings directly to the asset's criticality tier so the response is calibrated to actual risk.
The table below maps the most common abnormal findings in an oil analysis report to their likely root causes and recommended initial actions.
Reading the report correctly is only half the job. The value of oil analysis is entirely determined by the quality of the action it drives. Many maintenance programs collect and interpret oil analysis data correctly but fail to convert findings into timely work orders — and that failure costs equipment life.
When a report comes back with a caution or critical finding, the response should follow a defined decision tree. A caution finding on a non-critical asset warrants shortening the next sampling interval and noting the finding in the asset's history. A critical finding on any asset warrants an immediate work order — either for a targeted inspection, a corrective maintenance task, or an oil change — depending on what the finding indicates.
For teams running condition-based maintenance, oil analysis findings should feed directly into the work order management system as documented evidence. Every finding, every decision, and every action taken should be recorded against the asset — building the trended history that makes future interpretation more accurate and defensible in audits or root cause analysis investigations.
Oil analysis data has limited value when it sits in a lab email inbox and is never connected to maintenance scheduling, asset history, or work order generation. The most effective oil analysis programs are the ones where findings automatically trigger structured responses in the CMMS — creating a closed loop between lab results and maintenance action.
An integrated workflow looks like this: oil samples are scheduled as recurring tasks in the CMMS on a defined interval (typically 250–500 operating hours for critical rotating equipment). When results return, findings above caution limits automatically generate an investigation work order against the specific asset. The work order includes the oil analysis report as an attachment, the specific parameters of concern, and a recommended initial inspection.
Cryotos CMMS supports this workflow through its preventive maintenance scheduling module. Maintenance teams using Cryotos have reported a 30% reduction in unplanned downtime and 25% faster repair times by connecting condition monitoring data to structured maintenance workflows.
Sampling frequency depends on equipment criticality, operating conditions, and whether you are establishing baselines or monitoring a known issue. For most critical rotating equipment — compressors, gearboxes, hydraulic systems — sampling every 250 to 500 operating hours or at every oil change (whichever comes first) is appropriate.
Wear metals are elemental particles shed from machine components as they wear against each other under load. Each element corresponds to specific materials in your machine: iron from steel gears and shafts, copper from bushings and bearings, chromium from rings and chrome-plated parts.
High silicon in an oil analysis report is one of the most important contamination indicators. Silicon above 20–30 ppm — particularly when paired with elevated aluminum — strongly suggests external dirt ingestion from a failed air filter, breather, or degraded shaft seal.
Yes — oil analysis is one of the earliest and most reliable methods for detecting developing bearing failures. Bearings shed iron, copper, and lead particles as they wear; these appear in the wear metal section of the report as rising concentrations across consecutive samples.


Cryotos AI predicts failures, automates work orders, and simplifies maintenance—before problems slow you down.


