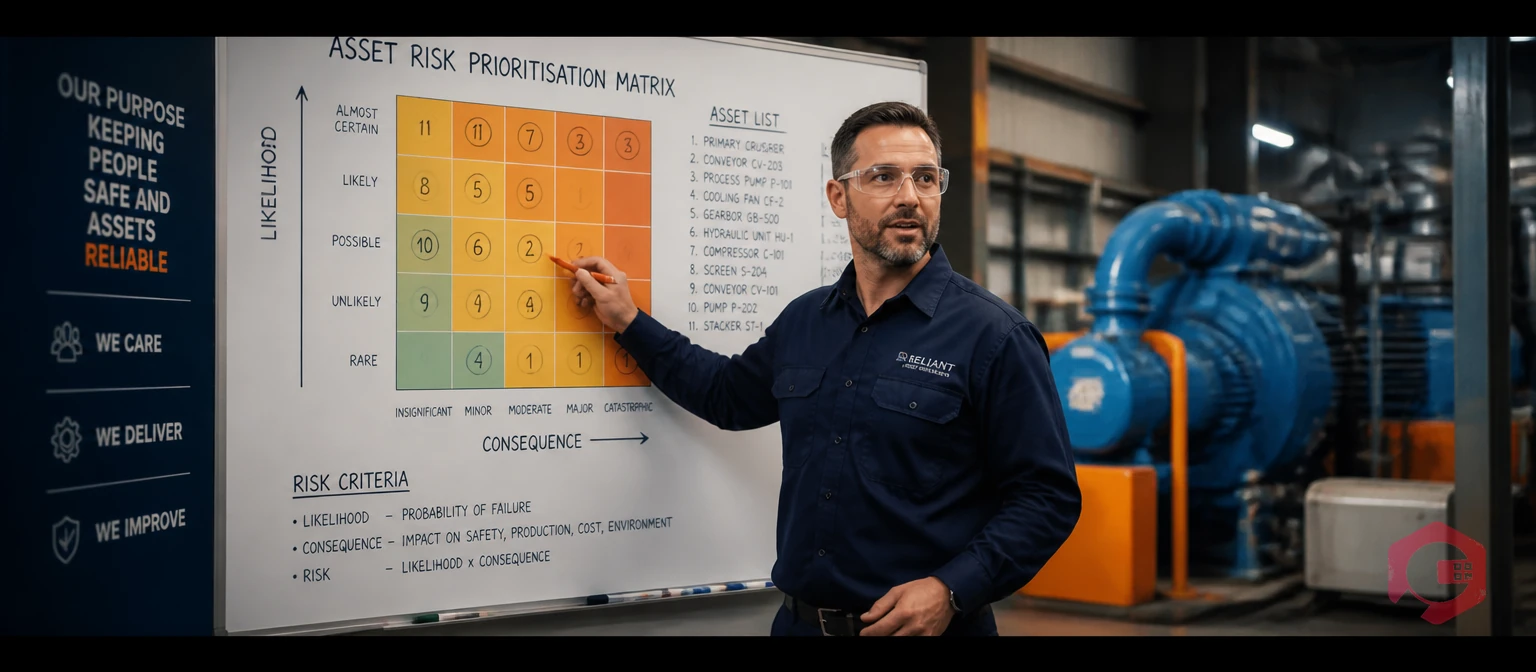
Prioritizing assets by risk means evaluating each asset based on both the likelihood of failure and the severity of its consequences — not just how important the asset is to production. Most maintenance teams rank assets by criticality: if it stops the line, it gets top priority. But criticality only tells you half the story. An asset can be critical and highly reliable at the same time, meaning it rarely needs urgent attention. Conversely, a "lower-criticality" asset with a high probability of failure and serious safety consequences can be far more dangerous to ignore. Risk-based asset prioritization gives you a complete picture — and a smarter way to allocate your maintenance budget and team capacity.
According to ISO 55000, effective asset management requires balancing cost, risk, and performance across the full asset lifecycle. Risk-based maintenance, aligned with reliability-centered maintenance (RCM) principles, is the standard approach recommended by both ISO 31000 and the Asset Management Council.
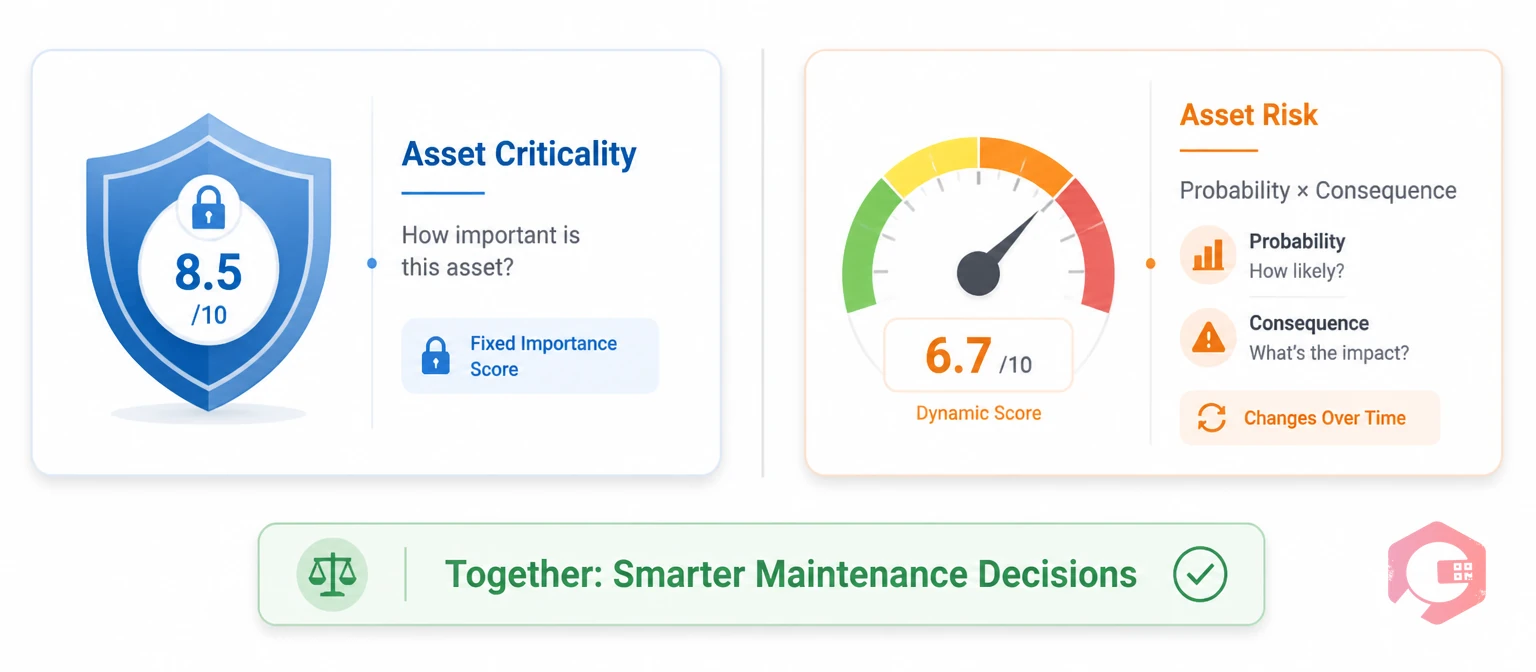
These two terms are often used interchangeably — but they measure very different things, and confusing them leads to maintenance strategies that protect the wrong assets.
Asset criticality is a static measure of how important an asset is to your operation. It answers the question: "How badly would we be affected if this asset failed right now?" A bottleneck machine on a single-path production line is highly critical. A backup generator that is never tested but rarely used may be rated lower — even though it carries enormous safety consequences when it does fail.
Asset risk is a dynamic measure that combines two variables: the probability that an asset will fail, and the impact of that failure when it occurs. Risk changes over time as assets age, as operating conditions shift, and as maintenance history accumulates. An asset that was low-risk two years ago may have drifted into high-risk territory because its failure rate is climbing.
The practical difference: criticality tells you which assets matter most to the business. Risk tells you which assets need attention now. You need both — but risk is the better guide for allocating maintenance resources on any given week.
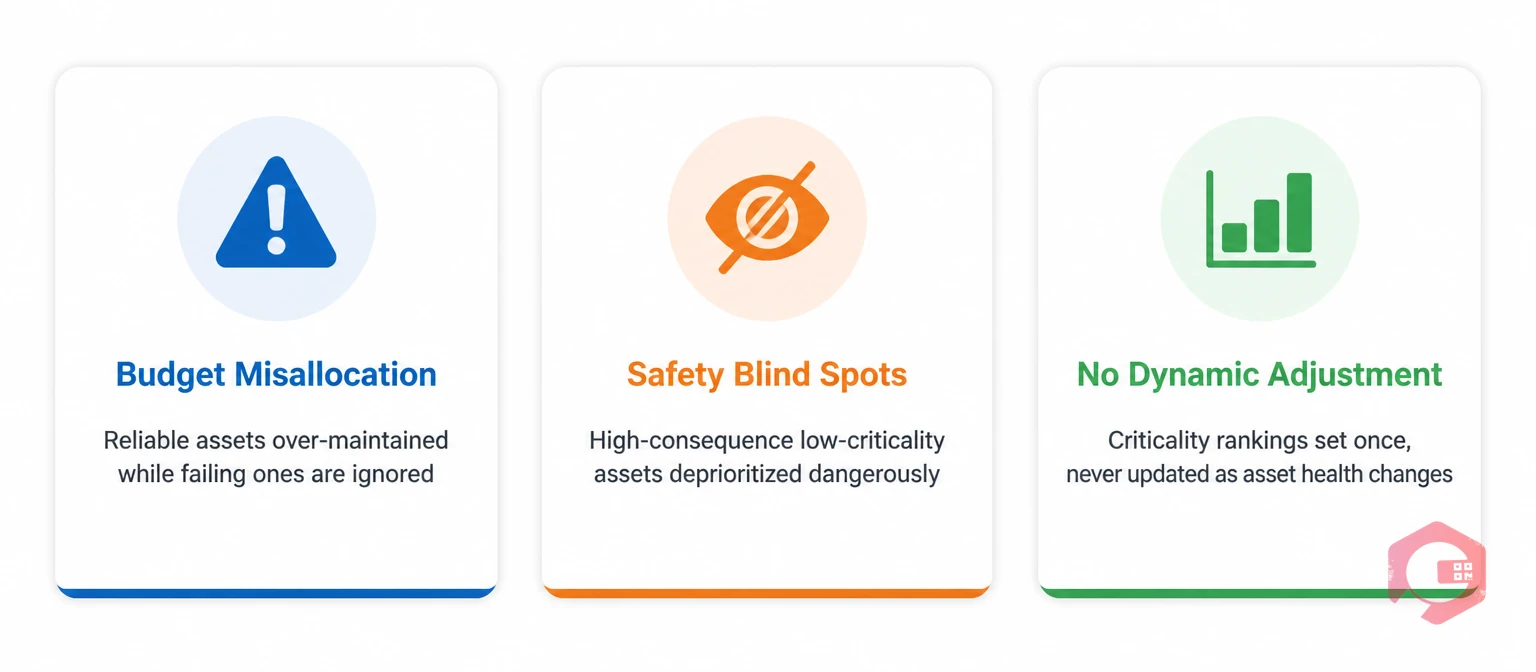
When maintenance teams rely on criticality alone, they tend to fall into a predictable trap: they over-maintain assets that are important but reliable, while under-serving assets that are less prominent but genuinely deteriorating. Three specific failure modes emerge:
A 2022 Plant Engineering maintenance benchmarking survey found that facilities using risk-based prioritization frameworks reduced unplanned downtime by 22% more than those using criticality ratings alone. The difference is not in the tools — it is in the decision logic.
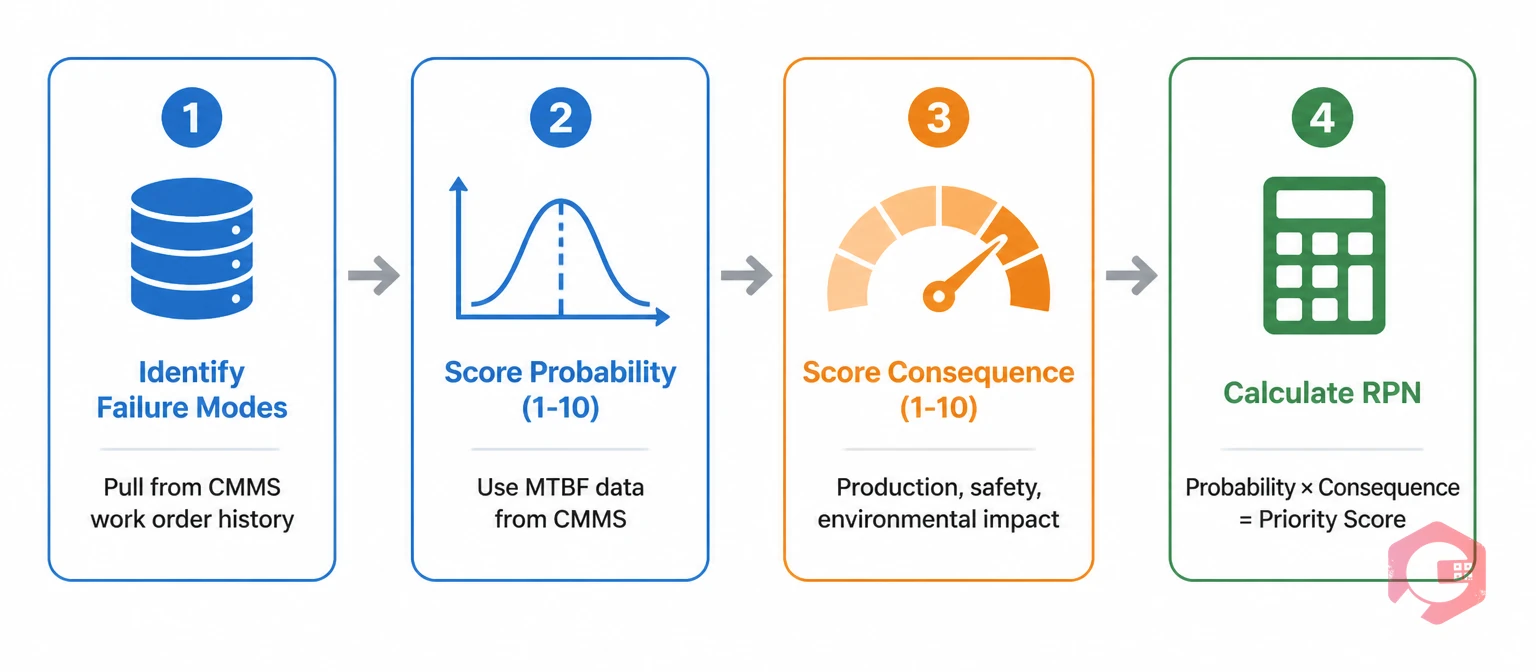
The most practical risk-scoring method for maintenance teams is derived from Failure Mode and Effects Analysis (FMEA). It produces a Risk Priority Number (RPN) for each asset that you can rank, compare, and act on directly.
Before you score anything, you need to know how each asset can fail. For a centrifugal pump, failure modes include bearing failure, seal leak, impeller wear, and motor overheating. For a conveyor system, they include belt slip, drive motor failure, and roller bearing seizure. Pull this information from your CMMS work order history, manufacturer documentation, and your maintenance team's field knowledge. Each distinct failure mode gets its own risk score.
Rate the likelihood of each failure mode occurring on a scale of 1 to 10. Use your actual CMMS failure data wherever possible — Mean Time Between Failures (MTBF) is the most reliable input. A failure mode occurring several times per year scores 8–10. One that has never been observed in five years of operation scores 1–3.
Rate the impact of each failure mode on a scale of 1 to 10 across three dimensions: production impact, safety impact, and environmental impact. Take the highest score across these three as your consequence rating. This ensures that a failure with severe safety consequences — even if production impact is moderate — gets the weight it deserves.
RPN = Probability × Consequence. The result is a score between 1 and 100. Assets with an RPN above 64 require immediate attention and should be placed in your highest-priority maintenance tier. Assets scoring 25–64 are managed proactively with scheduled preventive maintenance. Assets below 25 can be monitored with lower-frequency inspections or run-to-failure strategies where appropriate.
This scoring approach is directly aligned with ISO 31000 risk management principles and gives you a defensible, data-driven basis for every maintenance priority decision you make.
Once you have RPN scores for your asset fleet, visualize them in a risk matrix. Plot probability on the vertical axis and consequence on the horizontal. The result is a four-quadrant map that makes your highest-risk assets immediately visible and drives the right maintenance response for each zone.
| Risk Zone | Probability (P) | Consequence (C) | RPN Range | Label |
|---|---|---|---|---|
| Top Right | High (7–10) | High (7–10) | 49–100 | Unacceptable — Act Immediately |
| Top Left | High (7–10) | Low (1–4) | 7–40 | Monitor Closely — Reduce Frequency |
| Bottom Right | Low (1–4) | High (7–10) | 7–40 | Safeguard — Redundancy or Inspection |
| Bottom Left | Low (1–4) | Low (1–4) | 1–16 | Accept — Periodic Check or RTF |
The bottom-right quadrant — low probability, high consequence — is the one most criticality-based systems miss. These assets rarely fail, so they feel like they do not need attention. But when they do fail, the consequences are severe. Backup systems, safety interlocks, and emergency equipment typically live here. They need a different maintenance strategy: not frequent preventive maintenance, but rigorous inspection schedules and redundancy verification to ensure they will function when called upon.
Risk scores are only useful if they drive different maintenance actions. The table below maps RPN ranges to the appropriate maintenance strategy, aligning with the five maintenance maturity levels described in reliability-centered maintenance frameworks.
| RPN Range | Risk Tier | Recommended Strategy | Review Frequency |
|---|---|---|---|
| 64–100 | Critical Risk | Predictive / Condition-Based Maintenance + immediate corrective action | Continuous monitoring |
| 36–63 | High Risk | Preventive Maintenance at accelerated intervals; FMEA review | Monthly |
| 16–35 | Moderate Risk | Standard scheduled PM; monitor failure trends | Quarterly |
| 1–15 | Low Risk | Periodic inspection or run-to-failure where consequences are acceptable | Semi-annually |
This strategy mapping gives your maintenance planner a direct link between the risk score and the work order frequency, type, and urgency. It also makes your maintenance budget justifiable to operations and finance leadership — you are not over-maintaining low-risk assets, and you are not gambling on high-risk ones.
Review RPN scores at least quarterly and after every significant failure event. A single breakdown that reveals a previously unknown failure mode should trigger a re-score for the affected asset and any similar assets in your fleet. Your root cause analysis (RCA) process feeds directly into this loop.
A risk-based framework is only as effective as the data and tools behind it. Running RPN scoring on spreadsheets works for a fleet of 20 assets — it breaks down at 200. Cryotos CMMS gives maintenance teams the data infrastructure to make risk-based prioritization practical at any scale.
Maintenance teams using Cryotos report a 30% reduction in unplanned downtime and 25% faster mean time to repair — outcomes that directly reflect the shift from criticality-only prioritization to risk-based decision-making. The difference is not simply working harder on maintenance. It is working on the right assets at the right time, with the data to prove every decision.
Ready to build a risk-based maintenance prioritization framework for your facility? Book a free Cryotos demo and see how your asset risk data can drive smarter maintenance decisions from day one.
Asset criticality measures how important an asset is to your operation — how badly a failure would affect production. Asset risk combines criticality with the probability of failure to produce a more complete picture. A critical asset with a low failure rate may require less urgent attention than a moderate-criticality asset that is deteriorating rapidly and carries safety consequences. Risk-based prioritization accounts for both dimensions.
RPN = Probability of Failure (1–10) × Consequence of Failure (1–10). Score probability based on your asset's failure history — MTBF data from your CMMS is the most reliable input. Score consequence based on the worst-case impact across production, safety, and environmental dimensions. The resulting score (1–100) determines which maintenance strategy applies: continuous monitoring for scores above 64, scheduled PM for 16–63, and periodic inspection or run-to-failure for scores below 16.
A risk-based maintenance strategy allocates maintenance resources based on each asset's Risk Priority Number rather than treating all critical or high-visibility assets the same way. Assets with high failure probability and high consequences receive predictive maintenance and continuous monitoring. Assets with low probability and low consequences receive periodic inspections or are allowed to run to failure where economically appropriate. This approach reduces over-maintenance of reliable assets and prevents under-maintenance of genuinely deteriorating ones.
Review risk scores at least quarterly, and immediately after any significant failure event or major maintenance intervention. Asset risk is dynamic — an overhaul that extends an asset's MTBF changes its probability score. A change in operating conditions that increases load on an asset changes its consequence score. A CMMS with up-to-date failure history makes quarterly reviews practical rather than time-consuming.
Yes. A CMMS like Cryotos stores the failure history, downtime records, and work order data needed to score probability of failure for each asset. It then enforces risk-tiered PM schedules automatically, triggers condition-based work orders via IoT sensor thresholds, and surfaces MTBF trends through real-time dashboards. This turns a manual scoring exercise into a continuously updated prioritization system.


Cryotos AI predicts failures, automates work orders, and simplifies maintenance—before problems slow you down.


