
Repeat incidents are not bad luck — they are data failures. When the same type of breakdown, injury, or equipment failure recurs in the same area or on the same asset, it means the root cause was never identified, the corrective action was never implemented, or both. A Computerized Maintenance Management System gives maintenance teams the data infrastructure to break that cycle: incident records, asset history, failure codes, work order closure rates, and preventive maintenance compliance — all connected in one place. This guide covers how to use each category of maintenance data to identify repeat incident patterns, what corrective and preventive actions actually prevent recurrence, and how to build the workflows that keep the loop closed.
Key Takeaways

Repeat incidents happen when organizations treat each safety event as an isolated occurrence rather than a signal from a system under stress. The investigation happens, the form gets filed, and then the corrective action — if one was assigned at all — quietly ages in an inbox until the next event makes it relevant again.
Three structural failures drive most repeat incident cycles:
Not all maintenance data is equally useful for preventing recurrence. The categories below are the ones that directly connect to repeat incident patterns. Each type answers a specific question that a reactive maintenance record alone cannot answer.
| Data Type | What It Tells You | Key Question Answered | Repeat Incident Use |
|---|---|---|---|
| Incident logs (near-miss, minor, serious) | What happened, where, to whom, severity classification | Is this event recurring on the same asset or in the same area? | Pattern detection across events over time |
| Failure codes and cause codes | Why the equipment failed (mechanical, procedural, environmental) | Is the same root cause appearing across multiple work orders? | Identify systemic causes not visible in individual events |
| Corrective action close-out records | What fix was assigned, who owns it, was it completed and verified | Did the corrective action actually prevent recurrence? | Distinguish genuine fixes from paper closures |
| PM compliance data | Which preventive tasks were completed on time vs. deferred | Was the affected asset's PM up to date before the incident? | Link deferred PM to repeat failure events |
| MTBF and downtime history | How often an asset fails and how long repairs take | Is this asset's failure rate increasing over time? | Identify deteriorating assets before they generate incidents |
| Permit to Work records | Whether required safety controls were in place during high-risk work | Did a procedural or authorization gap contribute to the incident? | Identify safety control failures in high-risk work contexts |
The power of this data is not in any single column — it is in the connections between them. An asset with a rising failure frequency, a deferred PM record, and three open corrective actions from previous incidents is a repeat incident waiting to happen. You cannot see that picture without all three data types in the same system.
You cannot analyze patterns you haven't captured. The first structural requirement for reducing repeat incidents is a centralized incident log where every event — near-miss, minor first-aid, and recordable injury — is recorded against a specific asset, location, and severity level.
Incident and work order records are only analytically useful if they include standardized failure codes and cause codes. Free-text descriptions ("machine stopped," "worker slipped") are unqueryable. A defined code set — mechanical failure, procedural deviation, environmental condition, human factors, design deficiency — allows the CMMS to surface patterns across hundreds of records automatically.
The work order management system in Cryotos includes failure code fields on every corrective work order, creating a queryable failure database that builds automatically as your team closes jobs.
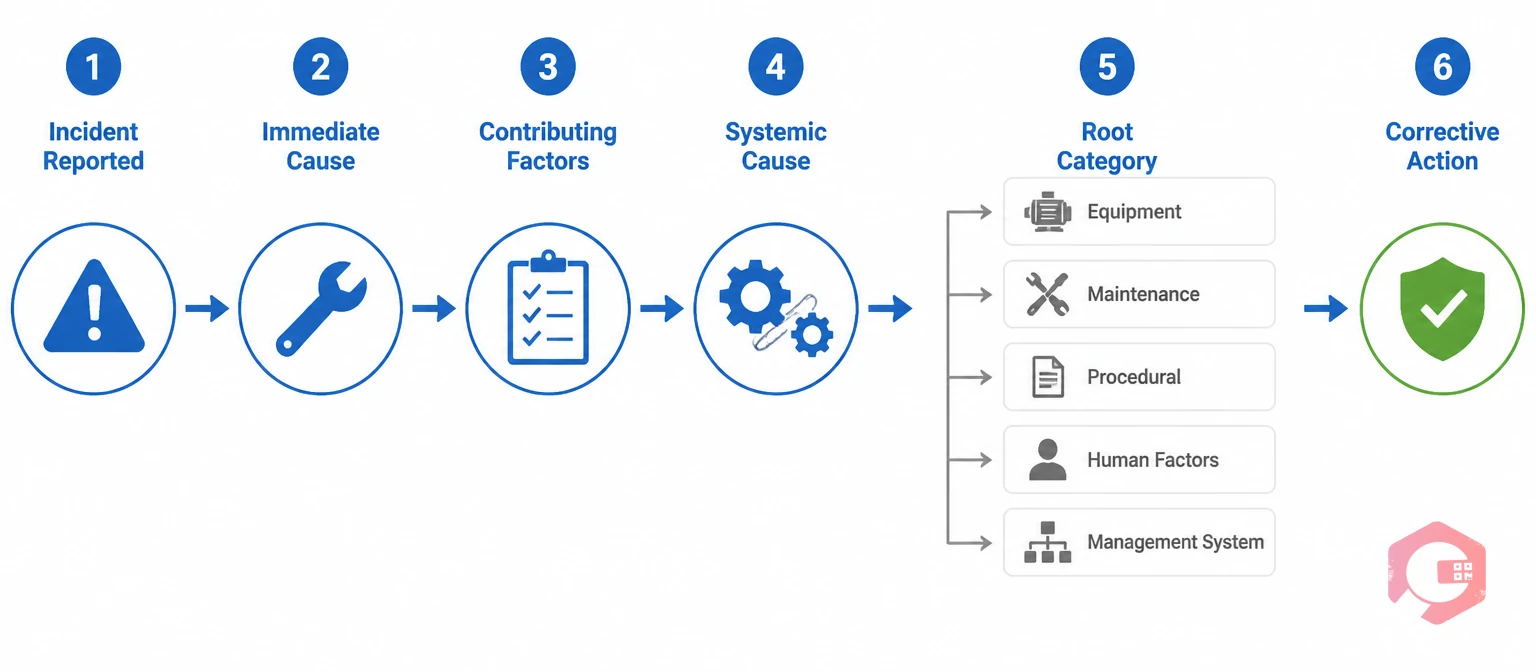
Root cause analysis (RCA) is the mechanism that converts incident data into prevention. Without it, corrective actions address symptoms — the spill is cleaned, the guard is reinstated, the worker is retrained — but the condition that created the hazard remains active.
Not every incident warrants the same investigation depth. A structured RCA should be triggered by:
The most practical RCA method for maintenance contexts is a structured 5 Whys process layered against asset history and PM records. The goal is to reach one of five root cause categories:
Most repeat incidents trace to categories 2 (maintenance failure) or 5 (management system failure) — which is why CMMS data is so central to prevention. Cryotos embeds the 5 Whys RCA directly into corrective work orders, so the investigation happens at the point of action rather than as a separate administrative process.
A structured root cause analysis investigation checklist ensures the investigation covers contributing factors — asset history, PM compliance, work authorization records, training status — not just the immediate trigger event. This is the difference between a finding ("the bearing failed") and a root cause ("the bearing failed because the lubrication PM was 45 days overdue because the PM schedule was calendar-based and the asset runs at twice the standard operating load").

Corrective and Preventive Actions (CAPA) are only valuable when they are completed, verified, and confirmed to have worked. A corrective action that gets assigned but never verified is functionally equivalent to no corrective action at all — and the incident data from the next recurrence will be indistinguishable from the first.
| CAPA Stage | Required Action | Owner | Deadline | Evidence Required |
|---|---|---|---|---|
| Immediate corrective action | Eliminate or isolate the hazard; stop further exposure | Supervisor on scene | Same shift | Photo + work order note |
| Root cause investigation | Complete RCA to systemic level using 5 Whys or fault tree | Safety officer + maintenance lead | 24–72 hours (severity-dependent) | Completed RCA form with findings |
| Preventive action assignment | Assign long-term fix (PM update, SOP revision, design change, training) | Named individual | 7–30 days | Updated procedure / training record / PM revision |
| Close-out verification | Confirm preventive action was implemented correctly | Safety officer | At completion | Sign-off + verification note |
| Effectiveness review | Check whether incident type has recurred in the 30–60 days post-closure | Safety manager | 30–60 days post-closure | Incident log review + confirmation note |
Cryotos tracks CAPA through the work order lifecycle — from initial assignment through escalation reminders to verified close-out. Every stage is timestamped and linked to the originating incident record, creating an unbroken audit trail from event to confirmed resolution.
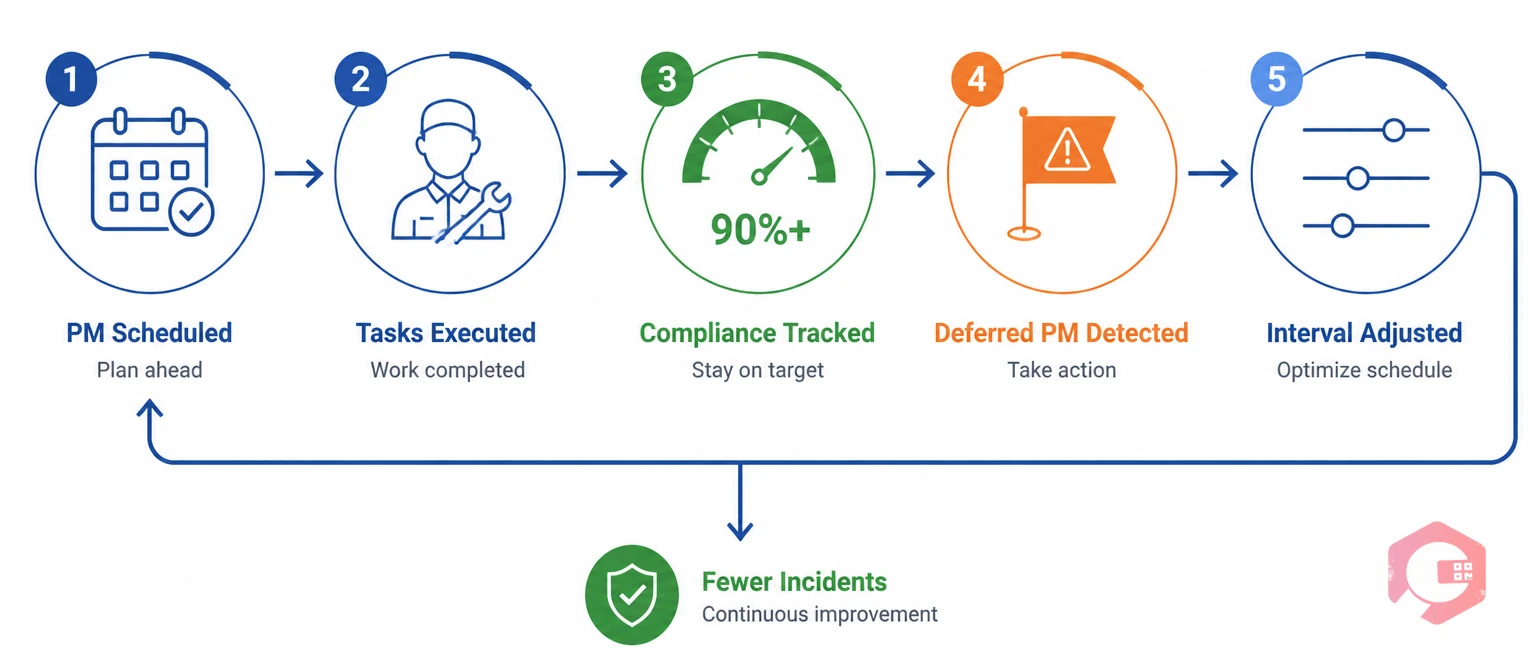
The majority of repeat incidents in industrial environments trace directly to deferred or skipped preventive maintenance. Equipment that is not serviced on schedule deteriorates in ways that are invisible to daily operations — worn bearings, degraded seals, misaligned components, depleted lubrication — until the failure mode manifests as an incident.
The analytical step that most maintenance teams skip: before closing any repeat incident investigation, check whether the affected asset's PM was current at the time of the event. In the majority of repeat incidents involving mechanical failure, the PM record will show one of three patterns:
Each of these findings produces a different corrective action — and none of them are visible without CMMS data tying the incident record to the asset's maintenance history.
Calendar-based PM schedules — service every 30 days, inspect every quarter — are designed for average operating conditions. Assets running at above-normal load, in harsh environments, or with aging components need dynamic scheduling tied to actual usage metrics. Cryotos preventive maintenance software supports both time-based and meter-based (hours/cycles/mileage) PM triggers, so high-load assets get serviced when they actually need it, not when the calendar says so.
PM compliance rate — the percentage of scheduled PM tasks completed on time — is one of the most actionable leading indicators for incident prevention. Organizations that track PM compliance as a KPI and maintain above 90% consistently report significantly lower repeat incident rates than those managing compliance below 75%. The maintenance BI dashboard in Cryotos tracks PM compliance by asset, area, and team, making the connection between maintenance discipline and safety performance visible in real time.
Mean Time Between Failures (MTBF) is the most direct quantitative measure of whether your repeat incident reduction efforts are working on a specific asset. If an asset's MTBF increases after a corrective action and PM interval adjustment, the intervention worked. If MTBF stays flat or decreases, the root cause has not been addressed.
The standard use of MTBF is retrospective — calculate it after the fact to understand how often an asset failed. The more powerful use is predictive: track MTBF trends over rolling 90-day periods to identify assets whose failure interval is shortening before they generate a serious incident.
An asset that failed every 180 days for two years but is now failing every 90 days is sending a clear signal — one that the MTBF calculator and downtime tracking data will show months before the next incident occurs, if the data is being reviewed.
A quarterly asset risk review using three data points — incident frequency, PM compliance rate, and MTBF trend — identifies the assets most likely to generate repeat incidents in the next 90 days. Assets in the intersection of high incident frequency, low PM compliance, and declining MTBF are the priority intervention targets.
Cryotos produces asset-wise incident reports and failure trend analysis from the BI dashboard, enabling maintenance teams to run this review without manual data aggregation across multiple systems.
A significant proportion of serious repeat incidents in industrial environments occur during maintenance activities themselves — when energy isolation fails, confined space protocols are bypassed, or hot work is executed without proper authorization. These are not equipment failures; they are procedural failures in how maintenance work is controlled.
Every Permit to Work record documents what safety controls were in place — energy isolation, gas testing, fire watch, atmospheric monitoring — and who authorized the work. When a repeat incident occurs during a maintenance task, the PTW record answers the critical question: were the required controls actually applied?
Cryotos Permit to Work software integrates PTW issuance, condition verification, and closure directly into the work order workflow. When an incident occurs during a permitted task, the investigation has immediate access to the full authorization record — including what conditions were declared, who approved them, and whether all required checks were completed before work started.
Contractors who work infrequently in a facility are statistically overrepresented in maintenance-related incidents. PTW workflows that require contractor-specific inductions, competency verification, and permit acknowledgment before work authorization reduce this risk materially — and create the documentation trail needed to identify patterns in contractor-related incidents if they do occur.
Repeat incident reduction is not a project with a finish line — it is a continuous improvement cycle. The organizations that sustain low repeat incident rates are those that review incident trend data regularly, at a cadence that matches their operational risk level, and that connect what they find directly to maintenance scheduling decisions.
A monthly review combining five data points provides the information needed to catch developing repeat patterns before they produce serious events:
Once an investigation identifies a procedural gap — a missing step, an ambiguous instruction, an absent verification requirement — updating the SOP or checklist is not optional. Cryotos maintenance checklists are embedded directly into work orders, so updated procedures take effect the moment they are published — not when a supervisor happens to remind the team during a toolbox talk.
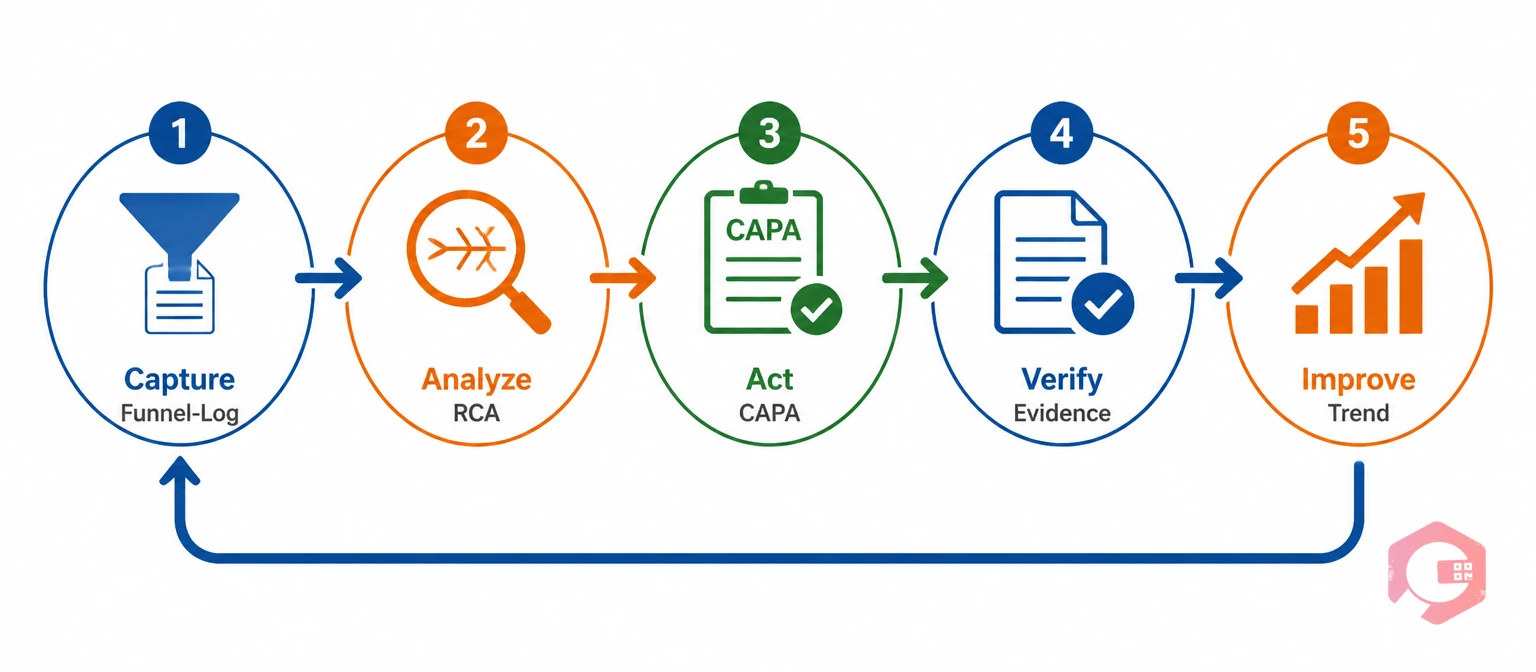
The Repeat Incident Reduction System is a five-component closed loop: capture, analyze, act, verify, and improve. Each component depends on the one before it, and the loop fails at whichever link is weakest.
Cryotos supports all five components in a single connected workflow. Maintenance teams using Cryotos have reported up to 30% reduction in unplanned downtime and 25% faster repair turnaround — both directly linked to the closed-loop incident management and preventive maintenance capabilities that prevent the same failures from recurring. Schedule a free demo to see how Cryotos connects your incident data to corrective action closure and PM scheduling in one system.
The most common failure point is corrective action close-out — specifically, the gap between an action being assigned and that action being verified as complete and effective. In organizations without a CMMS-based CAPA tracking system, corrective actions are assigned through email or paper forms with no escalation mechanism when they stall. The investigation happened, the finding was correct, but the fix was never confirmed. An effectiveness review step 30–60 days post-closure is the single most reliable way to catch this gap before the next event occurs.
MTBF (Mean Time Between Failures) measures how often an asset fails over a defined period. Tracking MTBF trends over rolling 90-day windows lets maintenance teams identify assets whose failure interval is shortening — a clear signal that a maintenance or design issue is worsening. Acting on a declining MTBF trend before the next failure is what converts reactive maintenance data into proactive incident prevention. The key is reviewing MTBF trends at the asset level, not just as a fleet average, where deteriorating assets can be hidden by stable performers.
Yes — when the near-miss has significant potential severity. A near-miss where a worker narrowly avoided a serious injury shares the same systemic root causes as an incident where the injury actually occurred. The only difference is luck. Organizations that investigate high-potential near-misses with the same depth as Level 2 or Level 3 incidents identify and close out the underlying hazard before it produces a recordable event. This is explicitly required under ISO 45001 Section 10.2, which mandates incident investigation for events that have significant potential for harm, not just those where harm occurred.
Monthly at minimum, with a quarterly deep-dive that includes MTBF trends and PM compliance rates by asset. The monthly review should be short — 30–45 minutes using a dashboard — and focused on three questions: Are any incident types increasing? Are any corrective actions at risk of not closing? Are any assets showing deteriorating MTBF? The quarterly review is where PM interval adjustments, SOP revisions, and asset replacement decisions are made based on the cumulative data from the past three months. Organizations that review more frequently than monthly without a structured agenda tend to surface noise rather than signal.
Six data points should be pulled immediately after any Level 2 or Level 3 incident: the asset's full maintenance history for the past 12 months; PM compliance rate for the affected asset over the same period; all open and recently closed corrective actions for that asset; the Permit to Work record if the incident occurred during a maintenance task; MTBF trend for the past 90 days; and any similar incident records from the past 24 months involving the same asset type, area, or failure mode. This data package gives the investigation team the context to reach a systemic root cause rather than stopping at the immediate trigger.


Cryotos AI predicts failures, automates work orders, and simplifies maintenance—before problems slow you down.


