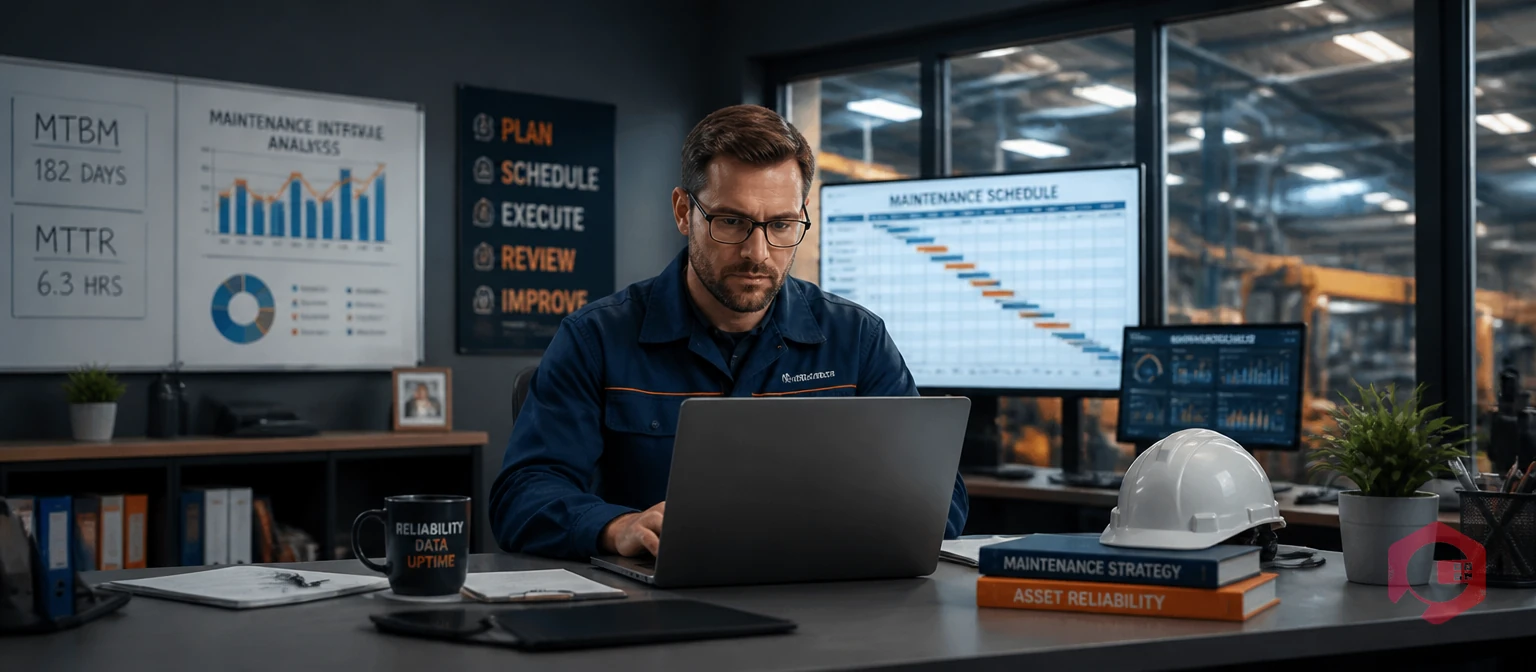
Mean Time Between Maintenance (MTBM) is a reliability metric that measures the average time between scheduled maintenance events for an asset or system. Unlike failure-based metrics, MTBM tells you how often planned maintenance occurs — not how often equipment breaks. For maintenance teams managing complex asset portfolios, MTBM is a direct indicator of preventive maintenance frequency and resource load. A higher MTBM means fewer interruptions, lower labor costs, and better asset uptime. According to ReliabilityWeb, organizations that track MTBM alongside MTBF reduce unnecessary maintenance events by up to 20%.

Mean Time Between Maintenance (MTBM) is defined as the total operating time of an asset divided by the total number of maintenance actions performed during that period — including both scheduled preventive maintenance and unscheduled corrective maintenance. It answers one key question: on average, how long does equipment run before someone needs to touch it?
MTBM is often confused with Mean Time Between Failures (MTBF), but they measure different things. MTBF only counts failure-driven interventions. MTBM counts all maintenance interventions — planned or unplanned. This makes MTBM a broader, more practical measure for teams running active asset maintenance management programs.
The metric is used across manufacturing, oil and gas, utilities, and facility management to benchmark how maintenance-intensive specific assets are and to optimise workforce scheduling. A low MTBM signals that an asset demands frequent attention — whether from aging components, poor design, or aggressive operating conditions. A high MTBM indicates a well-maintained, reliable asset that doesn't consume excessive technician time.
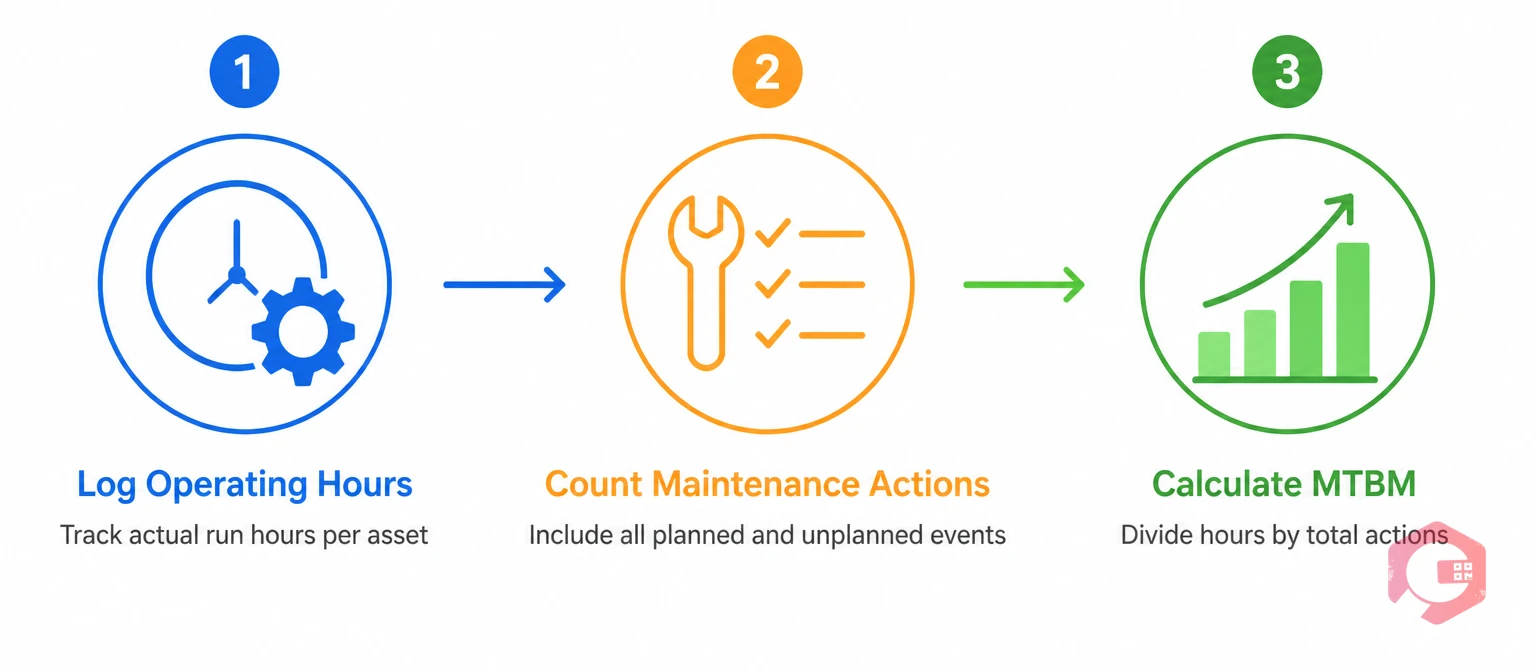
The MTBM formula is straightforward:
MTBM = Total Operating Time ÷ Total Number of Maintenance Actions
Here's how to apply it in practice. Say a production pump operates for 4,380 hours in a year (roughly half of all available hours). During that period, your team performs 12 maintenance actions — 8 scheduled preventive maintenance tasks and 4 corrective repairs after minor failures. Your MTBM would be:
MTBM = 4,380 ÷ 12 = 365 hours
That means, on average, a technician needs to work on that pump every 365 operating hours. If you want to improve utilisation, you now have a baseline to benchmark improvements against.
A few things to note when calculating MTBM:
You can track MTBM trends over time by comparing quarterly or annual figures. A rising MTBM indicates your PM program is working. A falling MTBM means an asset needs re-evaluation — whether that's recalibrating PM intervals, replacing worn components, or retiring aging equipment entirely.
MTBM and MTBF (Mean Time Between Failures) are both time-based reliability metrics, but they serve very different purposes. Confusing them leads to poor maintenance planning decisions.
| Aspect | MTBM | MTBF |
|---|---|---|
| What it measures | Average time between all maintenance actions (planned + unplanned) | Average time between equipment failures only |
| Maintenance types counted | Preventive + corrective + predictive maintenance | Corrective maintenance only (failure-triggered) |
| Primary use | Workforce planning, PM interval optimisation | Reliability analysis, failure prediction |
| Value when high | Equipment needs less technician attention overall | Equipment fails less frequently |
| Best for | Scheduling, resource allocation, maintenance budgeting | Risk assessment, spare parts planning |
| Limitation | High MTBM may hide over-maintained equipment | Ignores scheduled maintenance burden |
In practical terms: an asset can have a high MTBF (rarely fails) but a low MTBM (requires frequent scheduled maintenance). A hydraulic press, for example, might never break down unexpectedly — but still require lubrication, seal checks, and pressure calibration every 200 hours. MTBF would look excellent; MTBM would flag the high maintenance burden.
The two metrics work best together. Use MTBF to measure reliability and predict failures. Use MTBM to measure total maintenance load and plan technician schedules. Together, they give a complete picture of asset health and resource demand. Cryotos tracks both metrics in its BI Dashboard, letting you correlate reliability trends with maintenance frequency at the asset level.

MTBM directly shapes how you design and optimise your preventive maintenance program. When you know the average time between maintenance actions, you can set PM intervals with evidence rather than guesswork.
Here's where MTBM becomes a practical planning tool. If your conveyor belt has an MTBM of 500 hours, scheduling PM every 400 hours gives you a safety buffer without wasting labor on over-maintenance. If you schedule at 600 hours, you're likely to see corrective maintenance events creeping in — which will drop your MTBM and signal the problem clearly.
MTBM also impacts workforce planning directly. A maintenance team managing 50 assets needs to know the aggregate maintenance demand across the fleet. Assets with low MTBM values consume disproportionate technician time. Identifying these "high-demand" assets lets you make strategic decisions: increase PM intervals if the asset is over-maintained, invest in upgrades if it's genuinely failure-prone, or prioritise replacement in the next capital cycle.
From a cost perspective, Plant Maintenance Resource Center data shows that planned maintenance costs 3 to 5 times less than unplanned corrective repairs. Driving up your MTBM — by reducing unplanned interventions — directly reduces your cost per maintenance event. This is the financial case for tracking MTBM: it ties PM efficiency directly to the bottom line.
CMMS platforms like Cryotos make this analysis automatic. Every work order closed adds to the maintenance action count per asset. Every operating hour logged feeds the MTBM calculation. Over time, your CMMS builds an accurate picture of which assets are meeting their MTBM targets and which are falling short — without any manual spreadsheet work.
Improving MTBM means reducing unnecessary maintenance actions while keeping equipment reliable. There are five proven approaches maintenance teams use to move the needle:
One practical benchmark: world-class maintenance teams in manufacturing typically target an MTBM that keeps unplanned maintenance below 10% of total maintenance actions. If your corrective-to-preventive ratio is higher than 1:3, your MTBM is likely lower than it should be — and driving it up will require addressing the root causes behind those unplanned events.
MTBM benchmarks vary significantly by industry and asset type. Understanding where your assets sit relative to industry norms helps prioritise investment and set realistic targets.
In manufacturing, rotating equipment like pumps and compressors typically targets an MTBM of 500 to 2,000 hours depending on operating conditions and criticality. Assets running 24/7 in high-temperature environments will naturally have lower MTBM than those in light-duty applications. According to the International Maintenance Conference, best-in-class manufacturing facilities maintain an MTBM above 700 hours for critical rotating assets.
In oil and gas, where unplanned downtime can cost hundreds of thousands per hour, MTBM targets are set conservatively. Wellhead equipment and pipeline systems often target MTBM values above 1,000 hours, with heavy investment in condition monitoring to maintain those intervals reliably. Cryotos supports oil and gas maintenance teams with real-time downtime tracking and automated PM scheduling.
In facility management, HVAC and electrical systems typically carry lower MTBM targets — monthly or quarterly PM is standard — because the maintenance actions are brief and low-cost. The priority is preventing the infrequent but expensive corrective events rather than minimising maintenance frequency overall.
A practical example: a food and beverage manufacturer tracked MTBM for their packaging line filling machines. Initial MTBM was 310 hours. After implementing condition monitoring and revising PM intervals based on FMEA data, MTBM climbed to 580 hours within 18 months — a near-doubling of maintenance intervals with no increase in unplanned failures. Labor cost per machine dropped by 31% in that period.
The key lesson: MTBM isn't just a measurement — it's a management target. Set it deliberately, track it consistently, and tie it to your PM program design. Teams that do this reduce maintenance labor costs while improving asset availability simultaneously.
There's no universal benchmark because MTBM depends on asset type, industry, and operating conditions. The goal is a consistent improvement trend — a rising MTBM over time indicates your preventive maintenance program is becoming more efficient. Compare your MTBM to historical baselines and industry peers rather than an absolute number.
MTBM measures the time between maintenance events — it's a frequency metric. MTTM (Mean Time To Maintain) measures how long each maintenance action takes — it's a duration metric. Both matter for workforce planning: MTBM tells you how often technicians are needed; MTTM tells you how long they're tied up each time.
Yes. An unusually high MTBM may indicate deferred maintenance rather than genuine reliability. If PM tasks are being skipped or delayed, the maintenance action count drops artificially — making MTBM look better than it is. Always cross-reference MTBM with PM compliance rates and unplanned downtime data to validate the number.
Cryotos tracks every work order and operating hour per asset, giving you the raw data needed to calculate MTBM automatically through the reporting module. You can configure dashboards to display MTBM trends per asset class, site, or individual asset — making it a live KPI rather than a periodic calculation.
Tracking MTBM is one of the most practical steps maintenance teams can take to reduce costs and improve asset reliability at the same time. Cryotos makes it easy — from automated work order logging to BI dashboards that surface MTBM trends across your entire asset portfolio. Explore Cryotos maintenance management software and see how leading operations teams use data-driven metrics to run leaner, more reliable maintenance programs.


Cryotos AI predicts failures, automates work orders, and simplifies maintenance—before problems slow you down.


