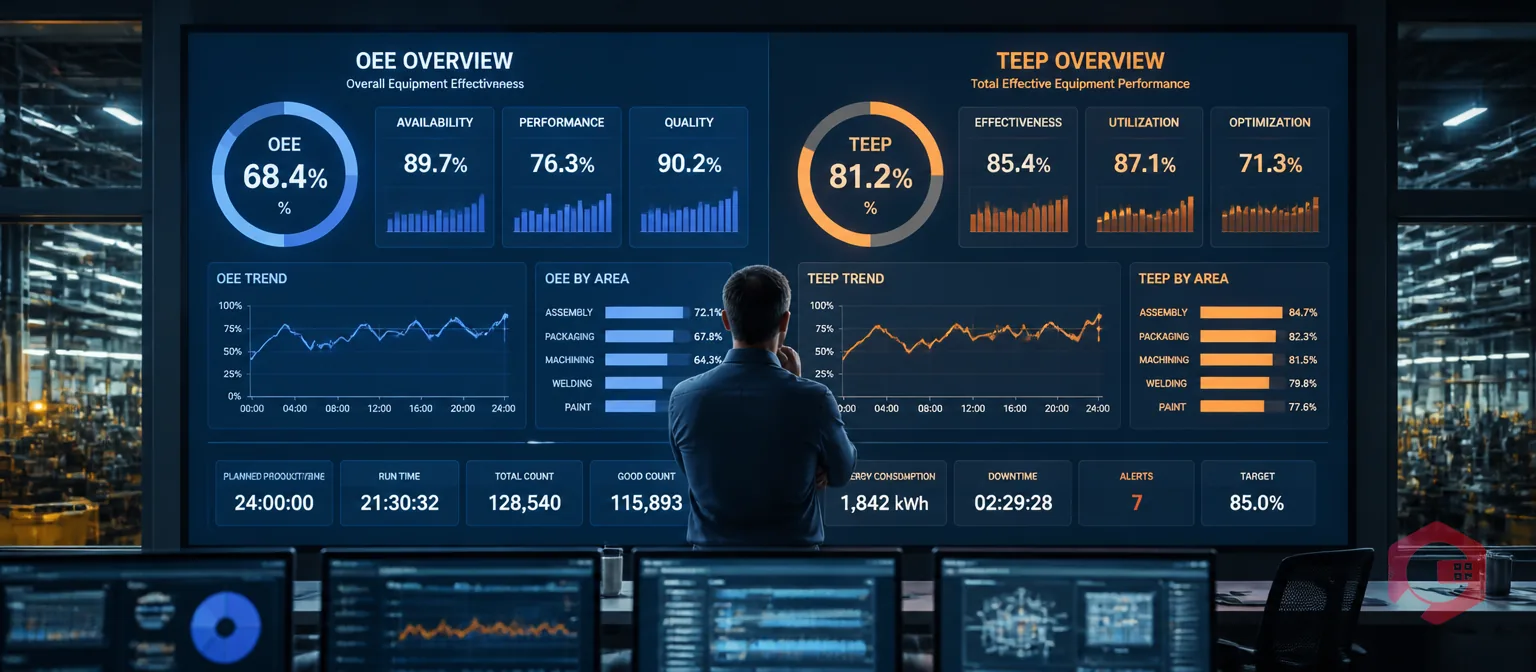
OEE (Overall Equipment Effectiveness) and TEEP (Total Effective Equipment Performance) both measure how well your equipment is performing — but they answer different questions and serve different purposes. OEE measures how effectively a machine uses its scheduled production time. TEEP goes further: it measures how effectively the machine uses all calendar time, including the hours when it isn't even scheduled to run. The difference between these two numbers tells you whether your performance problem is an operations issue, a scheduling issue, or a capacity utilisation issue — and that distinction determines the right action.
This guide explains both metrics with plain-language definitions, the exact formulas, a worked example using the same plant data, a side-by-side comparison table, and practical guidance on when to track each one and what to do with the results.
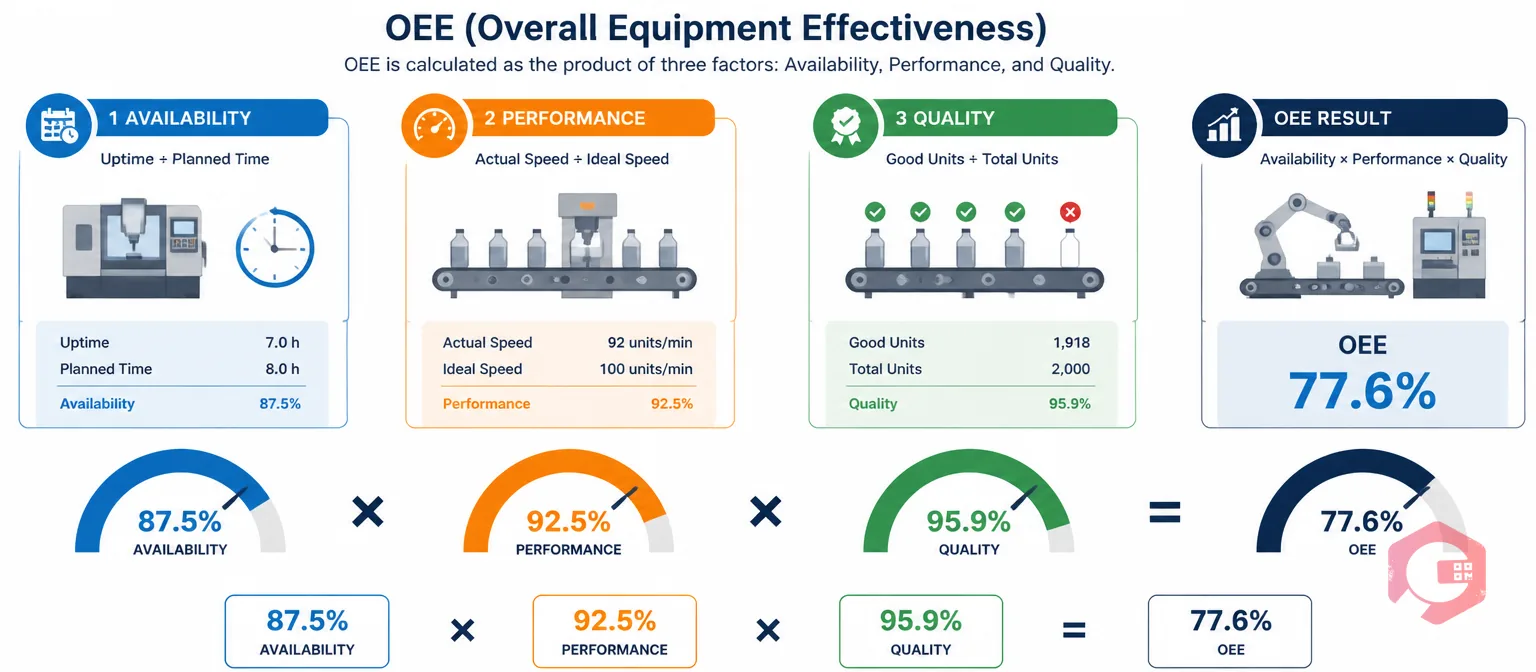
OEE is the manufacturing industry's standard metric for measuring machine productivity during the time a machine is actually scheduled to produce. It was developed as part of the Total Productive Maintenance (TPM) methodology and is defined as the product of three factors: Availability, Performance, and Quality.
Availability measures the percentage of scheduled production time the machine was actually running — it accounts for unplanned breakdowns and planned maintenance stops. Performance measures whether the machine ran at its designed speed during that run time — it accounts for micro-stoppages, reduced speed, and idling. Quality measures the proportion of output that met specification on the first pass — it accounts for scrap, rework, and defects.
The OEE formula is: OEE = Availability × Performance × Quality
A worked example: a machine runs 420 minutes out of a 480-minute scheduled shift (Availability = 87.5%). During those 420 minutes it produces 370 units against a theoretical rate of 400 units (Performance = 92.5%). Of the 370 units, 355 pass quality inspection (Quality = 95.9%). OEE = 87.5% × 92.5% × 95.9% = 77.6%.
According to the OEE Institute, world-class OEE is typically considered to be 85% for discrete manufacturing. Most plants starting a continuous improvement programme will find OEE in the 40–60% range — which looks alarming but simply means significant improvement opportunity exists. OEE tracks the Six Big Losses that TPM aims to eliminate: breakdowns, setup and adjustment, minor stoppages, reduced speed, startup rejects, and production rejects.
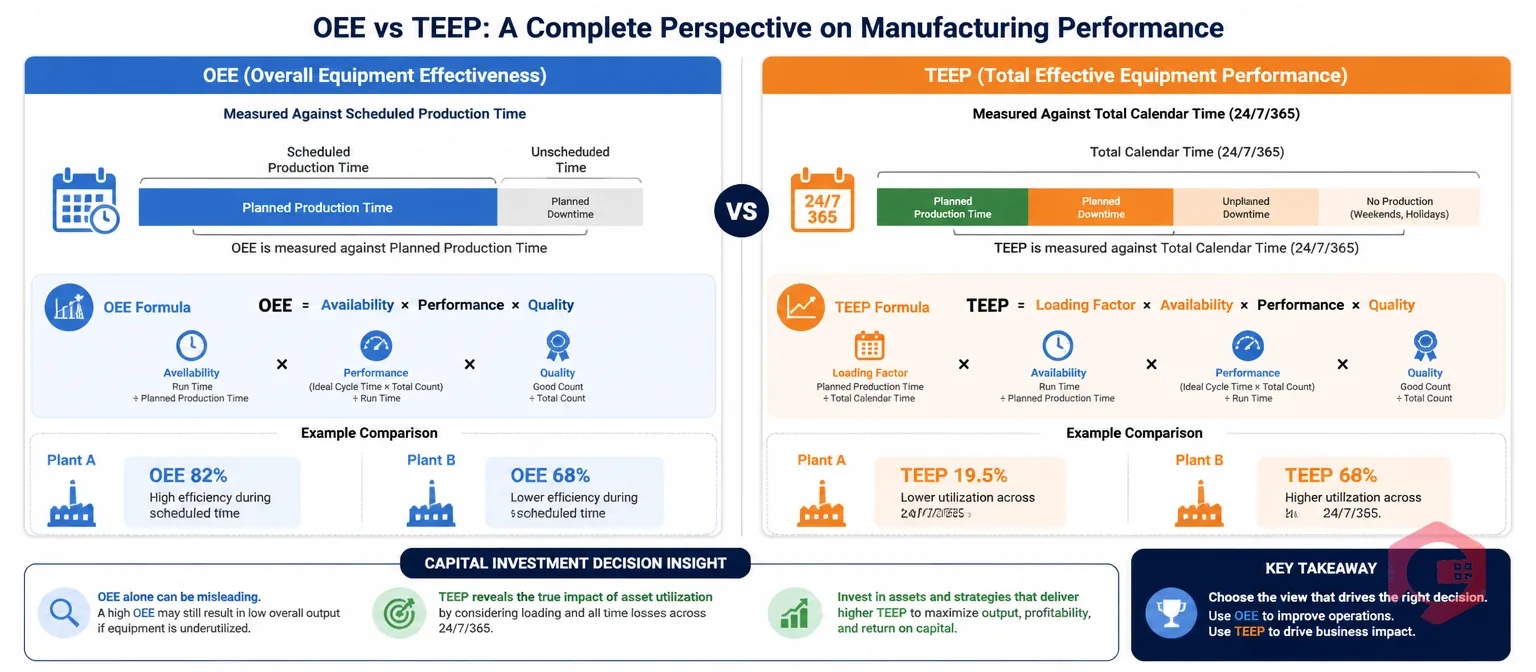
TEEP measures machine performance against total calendar time — all 8,760 hours in a year, or all 168 hours in a week — not just the hours when production is scheduled. It adds a fourth factor to the OEE calculation: Loading, which is the percentage of total calendar time that is actually scheduled for production.
The TEEP formula is: TEEP = Loading × OEE
Or expressed in full: TEEP = Loading × Availability × Performance × Quality
Using the same machine from the OEE example: if the 480-minute scheduled shift represents one 8-hour shift in a 24-hour day, then Loading = 480 ÷ 1,440 = 33.3%. TEEP = 33.3% × 77.6% = 25.9%.
That 25.9% TEEP tells you the machine is only producing good product for about one quarter of all available calendar time. The gap between OEE (77.6%) and TEEP (25.9%) is almost entirely explained by the fact that the machine sits idle for 16 hours every day. Whether that's a problem depends entirely on your business context — but TEEP makes the gap visible so you can make an informed decision about it.
TEEP is particularly relevant for capital-intensive industries — manufacturing, oil and gas, power generation — where equipment sits on the balance sheet as a major asset and the question "are we getting enough output per dollar of capital invested?" is a strategic one. A plant with strong OEE but low TEEP may be running efficiently during production hours while leaving significant revenue potential on the table in idle time.
| Dimension | OEE | TEEP |
|---|---|---|
| Time base | Planned/scheduled production time | Total calendar time (24/7/365) |
| Formula | Availability × Performance × Quality | Loading × Availability × Performance × Quality (= Loading × OEE) |
| What it measures | Efficiency during scheduled production runs | Total productive use of asset across all available time |
| What losses it captures | Six Big Losses (breakdowns, speed, quality) | Six Big Losses + unscheduled / idle time |
| World-class benchmark | ≥85% (discrete manufacturing) | No universal benchmark; context-dependent |
| Primary audience | Operations teams, maintenance teams | Plant managers, finance, strategy teams |
| Primary use case | Continuous improvement, TPM programmes | Capacity planning, capital investment decisions |
| Typical OEE/TEEP gap | N/A | TEEP is always ≤ OEE; gap = unscheduled idle time |
The real value of tracking OEE and TEEP together shows up when you compare plants or shifts — or when you're deciding whether to add a second shift, buy a new machine, or approve a capital project. Here's a concrete scenario.
Plant A runs one 8-hour shift, five days a week. OEE on that shift is 82% — a strong result. TEEP works out to: Loading = (8 hours × 5 days) ÷ (24 hours × 7 days) = 40 ÷ 168 = 23.8%. TEEP = 23.8% × 82% = 19.5%.
Plant B runs three 8-hour shifts, seven days a week. OEE is 68% — lower than Plant A. TEEP = (168 ÷ 168) × 68% = 68%.
Plant B extracts 3.5× more output per unit of installed capacity than Plant A, despite a lower OEE score. If a finance team looked only at OEE, they might recommend improving Plant B's operational discipline before approving a capital expansion. The TEEP data tells the opposite story: Plant B is already close to maximum theoretical capacity utilisation, and any further demand growth requires new capital. Plant A, by contrast, could potentially double output by adding a second shift before any capital is needed.
This is the decision TEEP is designed to inform. OEE alone would have pointed management in the wrong direction.
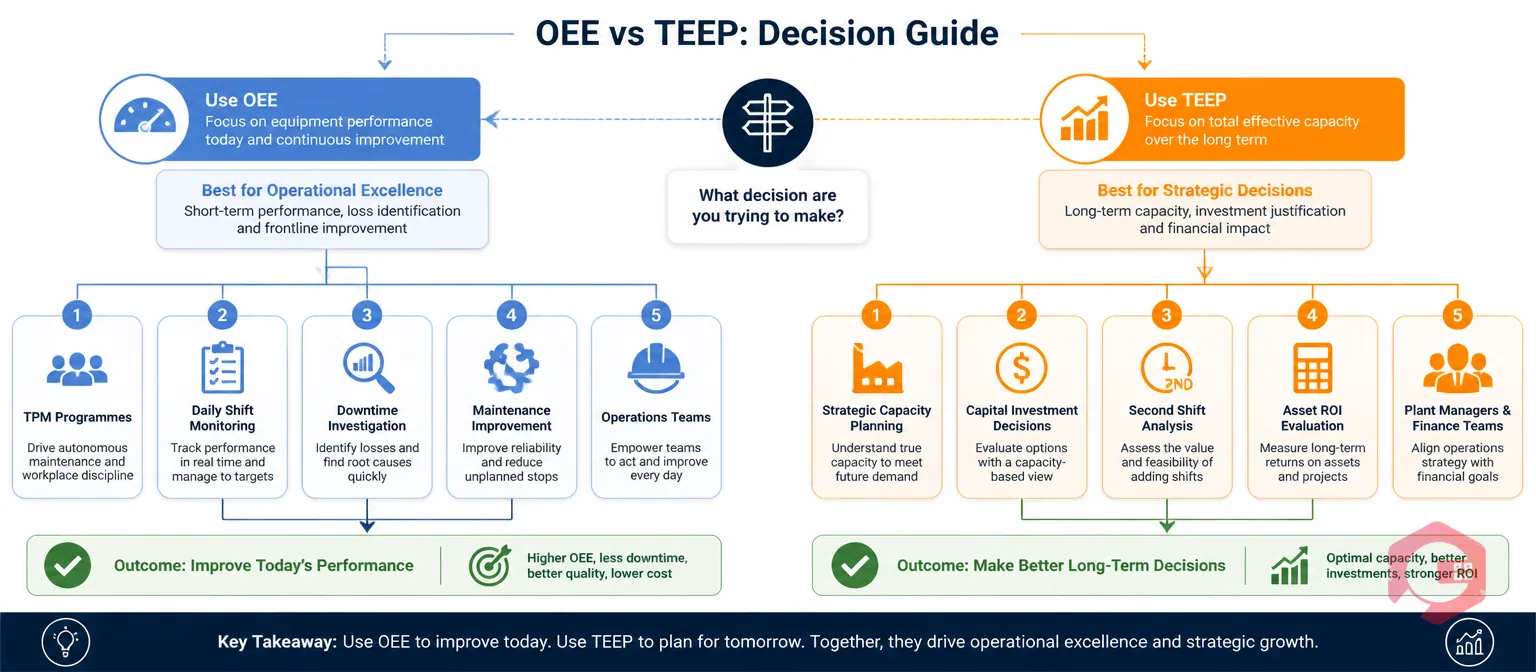
The question isn't which metric is better — both are right in the right context. The question is which question you're trying to answer.
Use OEE when you're focused on production floor performance: running a TPM programme, investigating a downtime spike, comparing shift performance, measuring the impact of a maintenance change, or targeting one of the Six Big Losses. OEE is the metric your production team should be reviewing daily or weekly. It's actionable at the maintenance technician and line supervisor level because every factor in the formula — availability, performance, quality — has a clear operational owner and a defined set of actions that can improve it. The OEE calculator and real-time BI dashboard in Cryotos CMMS let teams track these factors live and drill into the specific losses driving the number down.
Use TEEP when you're answering strategic questions: whether to add capacity, whether to run a second or third shift, whether the return on an asset justifies its carrying cost, whether a bottleneck machine needs a capital investment, or whether customer demand growth can be absorbed by existing equipment. TEEP is a monthly or quarterly metric for plant managers, operations directors, and finance teams. A TEEP below 50% on an asset with strong demand almost always means scheduling more production time is the fastest way to grow output. A TEEP above 80% means new capital is the only path to growth.
The most common mistake is using OEE to justify a capital purchase when TEEP is actually low — meaning idle time, not equipment efficiency, is the real constraint. Before approving any machine investment, it's worth running both numbers. If OEE is high but TEEP is low, add a shift. If both are high, then a capital investment is genuinely justified.
Both OEE and TEEP are only as reliable as the data behind them. The three most common data quality failures that produce misleading OEE and TEEP numbers are: inaccurate downtime recording (technicians logging the repair time but not the detection or wait time), inconsistent shift schedules that inflate planned production time, and quality counts that mix first-pass yield with reworked output.
A CMMS solves these problems by making data capture part of the normal work order workflow rather than a separate reporting task. When a technician closes a work order in Cryotos work order management, the system timestamps the event automatically — capturing actual downtime start and end, not the technician's retrospective estimate. Downtime tracking logs every unplanned stop against the specific asset and failure mode, so Availability calculations use actual run time rather than planned time minus a rough downtime estimate.
For TEEP specifically, accurate Loading calculation requires knowing total calendar time and total scheduled production time for each asset. Cryotos CMMS maintains the maintenance and production schedule per asset, so the Loading factor can be calculated automatically from shift patterns rather than manually compiled from spreadsheets each month. The report builder allows you to configure OEE and TEEP dashboards per asset, per line, or per plant — giving operations teams the drill-down they need and giving management the fleet-wide view they need, from the same data source.
Plants that integrate IoT meter reading with their CMMS can take this further: sensors on production lines capture actual run time, cycle time, and unit counts in real time, removing the manual count entirely and giving OEE and TEEP calculations that update continuously rather than at shift end.
The formulas are simple, but several misapplications consistently produce numbers that mislead rather than inform.
Including planned maintenance in unplanned downtime: Planned stops — scheduled PMs, changeovers, tooling changes — should not reduce Availability in OEE. They are part of the planning decision, not operational losses. If you include them, your Availability score will punish a well-maintained machine with a rigorous PM schedule. The correct treatment is to exclude planned stops from scheduled production time altogether, or to track them separately as planned downtime.
Using nameplate capacity for Performance instead of design rate: Performance should be calculated against the practical ideal cycle time — the fastest the machine can realistically run the current product in the current conditions — not the theoretical nameplate speed. Using nameplate speed inflates the Performance loss figure and misallocates improvement effort.
Conflating OEE with TEEP when reporting to leadership: An 80% OEE reported to a board that is trying to make a capacity investment decision is actively misleading if TEEP is 25%. Leadership needs TEEP for capital decisions. Operations needs OEE for day-to-day improvement. Reporting the wrong metric to the wrong audience leads to bad decisions at both levels.
Averaging OEE across a line without understanding the bottleneck: Line OEE is only meaningful if the calculation is anchored on the bottleneck machine — the one that constrains throughput. Averaging OEE across all machines in a line will always look better than the reality because good-performing machines mask the constraint. Identify the bottleneck first, then use that machine's OEE as the primary metric.
No. TEEP is always equal to or less than OEE because TEEP multiplies OEE by a Loading factor that is always between 0 and 1 (or exactly 1 if the machine runs 24/7/365, in which case TEEP equals OEE). The only scenario where TEEP equals OEE is a machine scheduled and running continuously across all calendar time — which in practice means continuous process operations like certain chemical plants or power generation assets.
Unlike OEE, TEEP has no universal "world-class" benchmark because the right Loading factor is entirely business-dependent. A single-shift assembly plant running at 85% OEE will have a TEEP around 28% — and that may be entirely appropriate if there's no demand justifying a second shift. The meaningful question isn't "is our TEEP good?" but "does our TEEP reflect a deliberate scheduling decision, or is it revealing idle capacity we should be using?" Context and trend matter more than the absolute number.
The Availability component of OEE is the factor most directly controlled by maintenance. Unplanned breakdowns and long mean-time-to-repair (MTTR) are both captured in reduced Availability. Tracking MTBF and MTTR alongside Availability gives the maintenance team a clear picture of whether improvements are coming from fewer failures (better PM or PdM) or faster recovery (better parts availability, technician response time, or work order processes).
Both — but for different audiences and at different frequencies. OEE belongs on the operations and maintenance dashboard, updated daily or per shift. TEEP belongs on the management dashboard, reviewed monthly or quarterly. A well-configured CMMS will let you set up both views from the same underlying data, so there's no reason to choose one over the other. The key is making sure the dashboard audience matches the metric — operations teams acting on TEEP or finance teams making decisions from OEE alone are both common mistakes.
Availability is one of the three components of OEE, not a separate metric. It specifically measures the percentage of scheduled production time when the machine was running (uptime ÷ planned production time). A machine can have 95% Availability but still have a low OEE if it runs slowly (low Performance) or produces defects (low Quality). OEE captures the combined effect of all three factors — which is why it's a more complete picture of operational performance than any single component on its own.
OEE tells your operations team how well the machine is running when it's scheduled to run. TEEP tells your leadership team how much productive work the machine is actually delivering against all the time it could theoretically deliver it. Both numbers are important — but they answer different questions and need to reach different decision-makers. Getting both right starts with accurate, timestamped data from every work order, downtime event, and production run. Cryotos CMMS captures that data automatically through its downtime tracking, work order workflows, and IoT integrations — so your OEE and TEEP numbers reflect what's actually happening on the plant floor, not what someone estimated at shift end. Book a free demo to see how Cryotos makes OEE and TEEP tracking automatic.


Cryotos AI predicts failures, automates work orders, and simplifies maintenance—before problems slow you down.