

Pareto analysis and FMEA answer two different maintenance questions. Combining them gives you a prioritization method that neither tool delivers alone. Pareto analysis shows you which assets are eating up the most downtime, cost, or work order volume. Failure Mode and Effects Analysis (FMEA) shows you how severe, frequent, and hard to detect each specific failure really is. Run on their own, the two methods often disagree, and teams end up unsure which list to act on first. According to the Society for Maintenance and Reliability Professionals (SMRP), teams that layer structured prioritization methods recover 15–25% of their maintenance budget. This guide shows you exactly how to combine Pareto analysis and FMEA into one workflow, with a worked example.
Key Takeaways
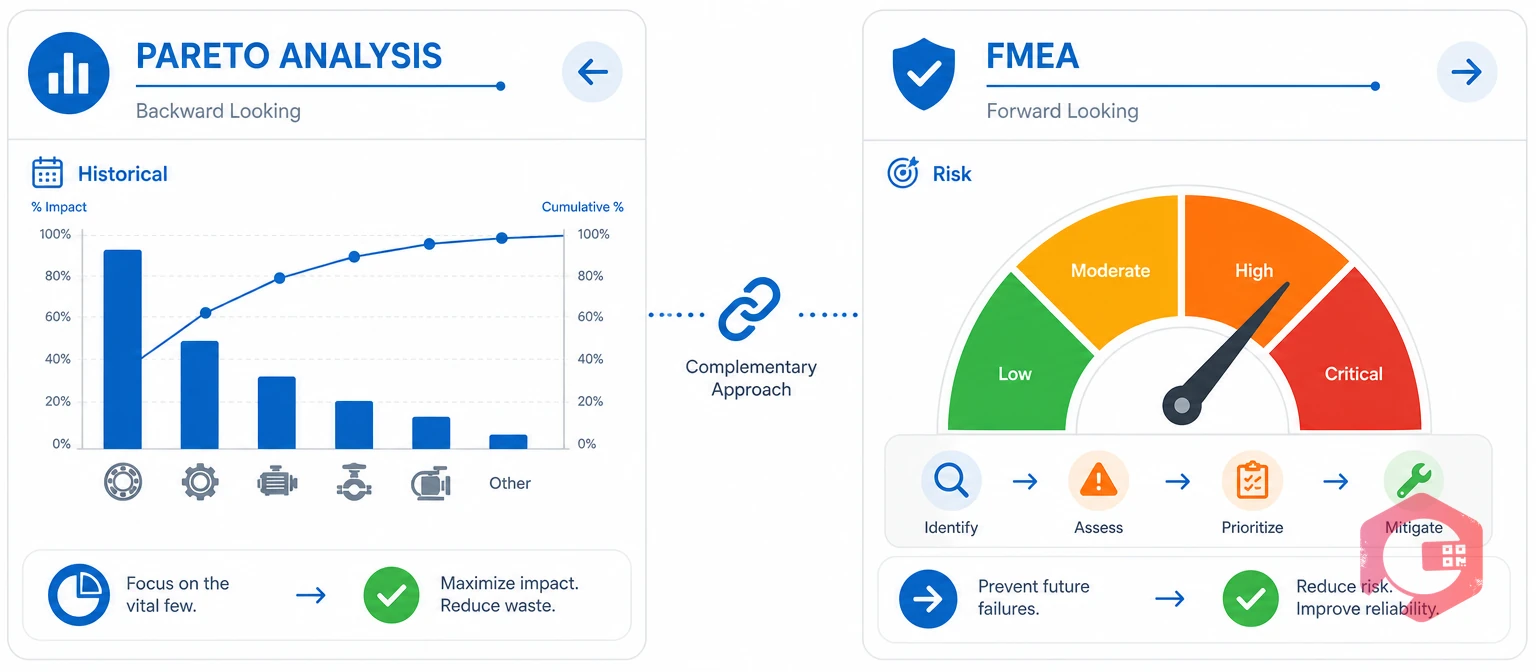
Pareto analysis and FMEA differ in what they measure and when they apply. Pareto analysis looks backward. It ranks assets by their actual, historical downtime, cost, or work order count. FMEA looks forward. It scores failure modes by projected risk, using Severity, Occurrence, and Detection — even if that failure has never actually happened yet.
| Dimension | Pareto Analysis | FMEA |
|---|---|---|
| Basis | Historical work order data | Projected risk score |
| Direction | Backward-looking | Forward-looking |
| Unit of analysis | Asset or asset class | One failure mode |
| Catches rare, severe risk? | No — low frequency hides it | Yes — Severity score flags it |
| Best used for | Deciding where to look first | Deciding what to do next |
Pareto analysis is a method that ranks assets by their past downtime, cost, or work order count. FMEA is a scoring method that rates each failure mode by Severity, Occurrence, and Detection. Neither ranking is wrong. They just answer different questions. An asset with a low Pareto rank can still carry a severe failure mode that FMEA would flag as urgent. That's the core reason to run both.
A combined Pareto and FMEA workflow is a two-stage filter. Pareto narrows a full asset list using historical data. FMEA then scores the survivors for risk. Running a full FMEA on every asset in a facility is rarely practical. Most teams do not have the hours to score hundreds of failure modes. Pareto analysis solves that problem by narrowing the field first.
Teams that use only one method hit a predictable gap. Pareto-only teams chase the assets causing the most historical pain. But they miss rare, high-severity risks sitting just outside the top of the chart. FMEA-only teams score risk in careful detail. But they often burn hours scoring assets that, historically, barely register a problem.
Combining Pareto analysis and FMEA closes both gaps. Pareto feeds FMEA a short, defensible list worth the scoring effort. FMEA then feeds back what Pareto cannot see on its own: which of those assets carry a failure mode severe enough to override the historical ranking. Root cause analysis findings from past investigations are often the fastest way to fill in FMEA's Occurrence and Cause columns.
Use the free failure rate calculator to set a data-backed Occurrence baseline before your team scores FMEA ratings on the assets Pareto surfaces.

The handoff works best as a defined three-step process. It should not be an informal chat between whoever ran each analysis.
The Pareto-to-FMEA Handoff:
This reconciliation step carries most of the value, and it's the step most teams skip. A Pareto chart and an FMEA worksheet sitting in separate files, never compared, just give you two competing priority lists instead of one.
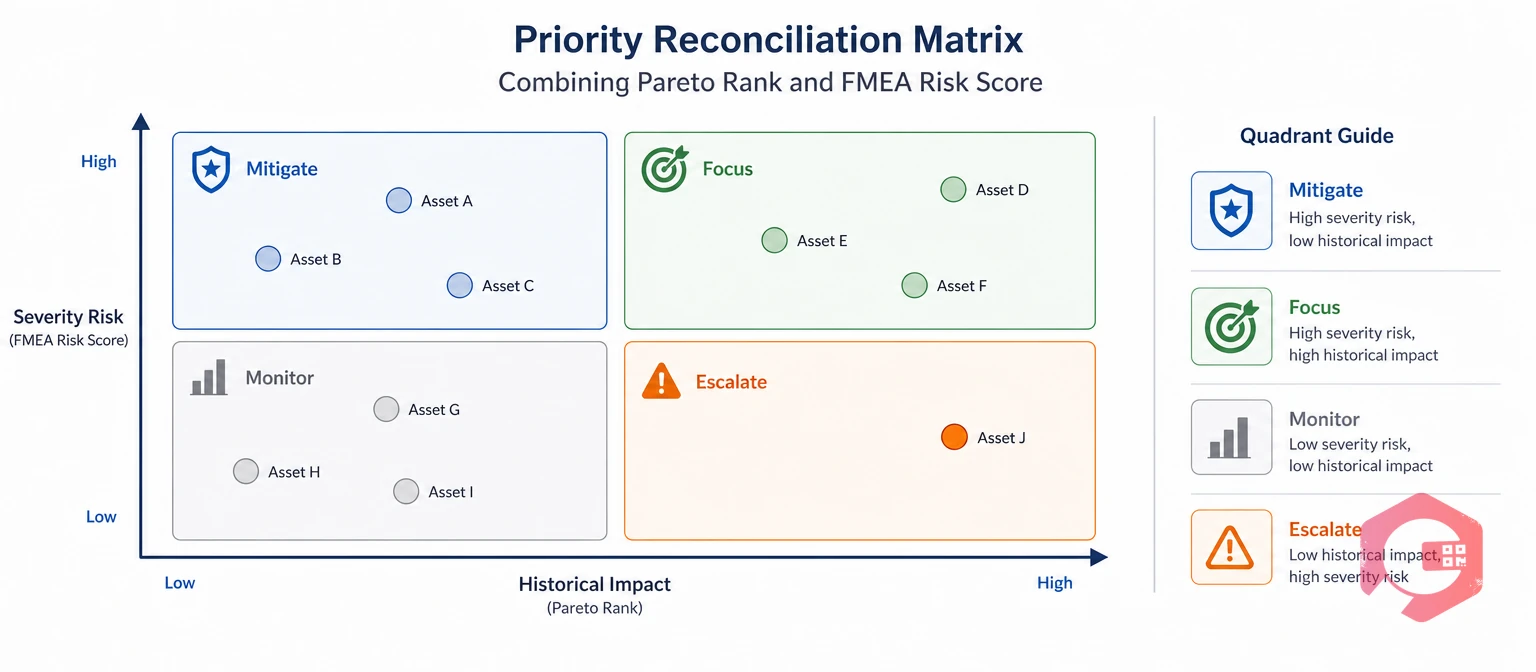
Here is a five-asset shortlist that survived a Pareto analysis on 12 months of downtime data. Each asset is then scored with FMEA on its dominant failure mode.
| Asset | Pareto Rank (Downtime) | Dominant Failure Mode | S × O × D | RPN | Combined Priority |
|---|---|---|---|---|---|
| Compressor C-04 | 1 | Bearing seizure | 7 × 6 × 4 | 168 | Top priority — high on both |
| Pump P-12 | 2 | Seal leak | 6 × 5 × 5 | 150 | Top priority — high on both |
| Relief Valve RV-09 | 14 | Fails to open under pressure | 9 × 3 × 6 | 162 | Escalate — low Pareto rank, high severity |
| Conveyor CV-03 | 3 | Belt misalignment | 4 × 6 × 5 | 120 | Standard priority |
| Motor M-07 | 5 | Winding overheat | 5 × 4 × 4 | 80 | Standard priority |
Relief Valve RV-09 is exactly the case this method is built to catch. It ranked 14th on historical downtime — low enough that a Pareto-only team would never have scheduled an FMEA session on it. But its dominant failure mode carries a Severity score of 9. A relief valve that fails to open under pressure is a safety event, not just an inconvenience. Combining Pareto analysis and FMEA surfaces that asset before it causes a serious incident, not after. The SAE J1739 FMEA standard is explicit here: any failure mode with a Severity score of 9 or 10 needs action regardless of the calculated RPN.
Three mistakes consistently undermine a combined Pareto and FMEA program.
According to the American Society for Quality, FMEA delivers the most value as a living document, reviewed on a fixed cadence rather than run once and filed away. A combined Pareto and FMEA program depends on that same discipline.
Running Pareto analysis and FMEA as one workflow needs the same underlying data: consistently coded work orders, asset-level cost and downtime history, and a way to turn scoring results into scheduled action. Cryotos, a Computerized Maintenance Management System, supplies all three from one system. That beats exporting data from one tool and re-typing it into another.
The BI Dashboard builds the Pareto ranking straight from live work order data — downtime hours, repair cost, and frequency by asset — with no manual export. Maintenance teams using Cryotos have reported up to 30% reduction in unplanned downtime and 25% faster repair turnaround, largely because prioritization runs on current data instead of a stale quarterly export. Once FMEA scoring identifies corrective actions for the reconciled list, each action becomes a trackable job through work order management, with an owner, a due date, and a completion record.
Maintenance teams that formalize this handoff usually run it quarterly. They refresh the Pareto ranking from the latest 12 months of data, re-score FMEA on any asset whose rank moved, then reconcile the two lists again. Teams that treat prioritization as a repeatable process — not an annual one-off — catch emerging high-severity risks before they cause a major failure. The ISO 55001 asset management standard frames prioritization the same way: an ongoing, evidence-based process, not a one-time audit.
Run Pareto analysis first. It narrows a full asset list down to a workable candidate set using historical downtime, cost, and frequency data. That makes the FMEA session that follows far more efficient. Running FMEA first on every asset in a facility rarely works, since scoring hundreds of failure modes takes more time than most teams can spare.
Escalate it. A low Pareto rank means the asset hasn't historically caused much downtime or cost. But a high FMEA Severity score means its failure mode carries serious consequences if it does occur — often a safety or major-loss scenario. This is exactly the blind spot a Pareto-only method misses, and it should override the historical ranking.
Quarterly works well for most maintenance operations. This cadence gives the Pareto ranking enough new work order data to reflect real changes. It also keeps the FMEA scores current, so the reconciliation step compares two fresh rankings instead of one fresh list against one stale one.
Yes, using spreadsheets. But manual exports and reconciliation steps add real time, and they open the door to stale or inconsistent data between the two analyses. A root cause analysis investigation checklist can help standardize the occurrence and cause data feeding into the FMEA side, even without dedicated software.
Combining Pareto analysis and FMEA gives maintenance teams a prioritization method that neither historical impact nor projected risk can deliver alone. It narrows a long asset list to a workable set, then scores that set with a depth a full-fleet analysis never has time for. Schedule a free demo to see how Cryotos turns a combined Pareto and FMEA workflow into one repeatable process instead of two disconnected spreadsheets.



Cryotos AI predicts failures, automates work orders, and simplifies maintenance—before problems slow you down.



