
Pareto analysis in maintenance applies the 80/20 rule to your asset failure data: roughly 80% of your total downtime, repair costs, and reactive work orders will trace back to approximately 20% of your assets. Identifying that 20% — and concentrating your PM investment, condition monitoring resources, and engineering attention on it — is one of the highest-return analytical exercises a maintenance team can run. The problem is that most teams never do it systematically. They know intuitively that some machines cause more trouble than others, but without a structured analysis of their CMMS work order data, they cannot quantify exactly which assets are responsible for what proportion of their losses — and therefore cannot make an evidence-based case for prioritising attention or capital investment on specific machines. According to the Society for Maintenance and Reliability Professionals (SMRP), maintenance organisations that apply structured asset prioritisation methods such as Pareto analysis recover 15–25% of their maintenance budget by redirecting resources from low-impact assets to the critical few that drive the majority of unplanned downtime. This guide explains exactly how to run a Pareto analysis on your asset failure data, what metrics to use, and how to translate the findings into specific maintenance programme changes.
Key Takeaways
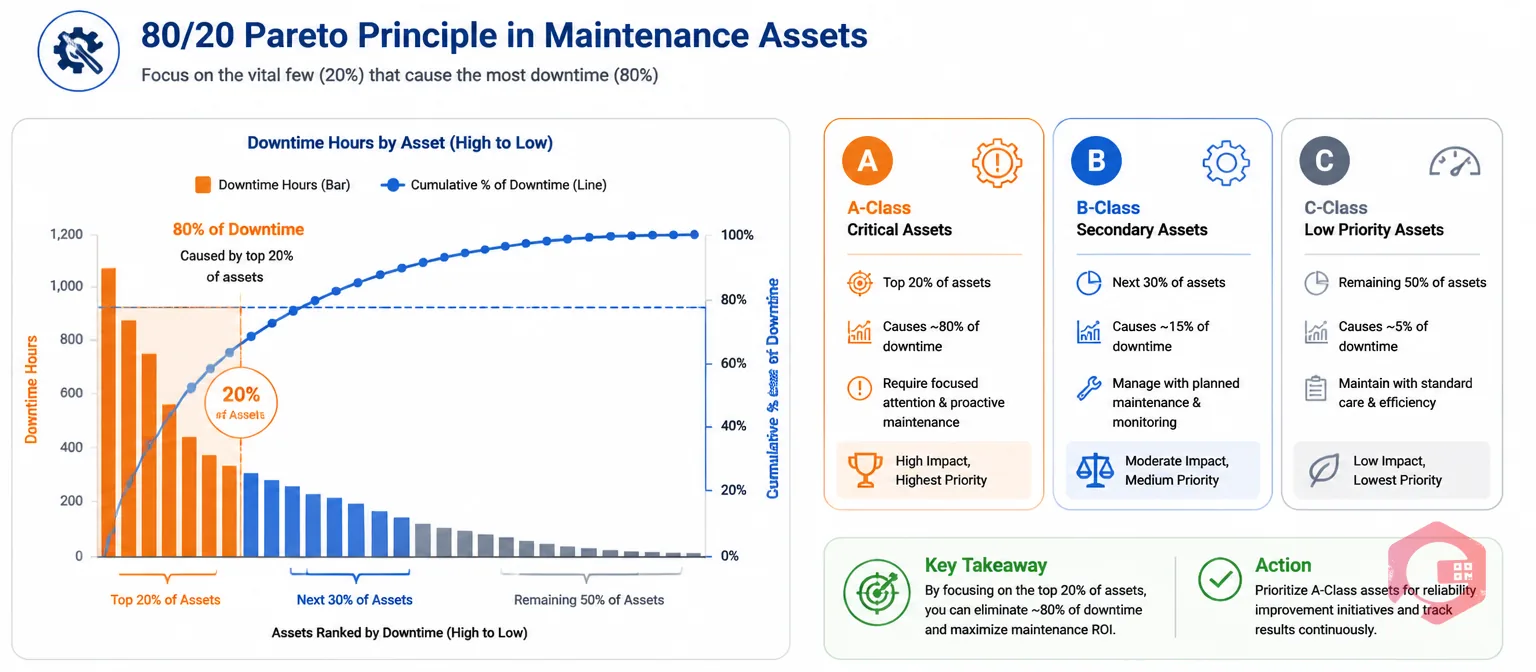
Pareto analysis is a prioritisation technique based on the observation that a small number of causes typically account for the large majority of consequences. In maintenance, those consequences are downtime hours, repair costs, and reactive work order volume. The "causes" are specific assets, asset classes, or failure modes that generate that disproportionate share of problems.
The analysis takes its name from Vilfredo Pareto, the Italian economist who observed that 80% of Italy's land was owned by 20% of the population — a distribution that turns out to be remarkably consistent across a wide range of systems, including manufacturing equipment failures. The 80/20 ratio is a rough guide rather than a precise law: in some operations it is 70/30, in others closer to 90/10. What is consistent is the underlying pattern — a small number of contributors account for most of the impact.
Applied to maintenance, Pareto analysis converts your raw work order history into a ranked view of which assets are driving the most pain. That ranked view answers questions your team cannot answer from memory or intuition alone: Is Pump 7 causing more downtime than the entire conveyor system? Is one packaging machine responsible for 35% of all reactive work orders? Is Asset 14 consuming 40% of the maintenance budget while representing 3% of the total asset value? These are the questions that should be driving PM frequency decisions, condition monitoring investment, and capital replacement planning — but without a formal Pareto analysis, they typically are not.
Running a Pareto analysis on a single metric gives you a partial picture. The most useful maintenance Pareto programmes run the analysis across three dimensions and compare the results.
| Asset | Unplanned Downtime Hours (12 months) | % of Total Downtime | Cumulative % | Pareto Classification |
|---|---|---|---|---|
| Compressor C-04 | 148 | 31% | 31% | A — Top priority |
| Pump P-12 | 94 | 20% | 51% | A — Top priority |
| Conveyor CV-03 | 71 | 15% | 66% | A — Top priority |
| Heat Exchanger HX-01 | 52 | 11% | 77% | B — Secondary priority |
| Motor M-07 | 38 | 8% | 85% | B — Secondary priority |
| All other assets (15) | 70 | 15% | 100% | C — Low priority |
In this example, three assets — Compressor C-04, Pump P-12, and Conveyor CV-03 — account for 66% of all unplanned downtime across the entire 20-asset operation. The remaining 15 assets together contribute only 15%. The Pareto principle holds clearly: if the maintenance team can significantly reduce failure frequency or downtime duration on just those three assets, they will recover two-thirds of their total unplanned downtime loss. The 15 other assets, despite consuming management attention and appearing in planning conversations, are producing a combined impact smaller than Conveyor CV-03 alone.
This is the insight Pareto analysis delivers that intuition cannot. Most maintenance managers know their Compressor C-04 is problematic — but they do not know it is responsible for 31% of the total, nor can they make the case to operations management or finance for increased investment on that specific asset without the numbers to back it.
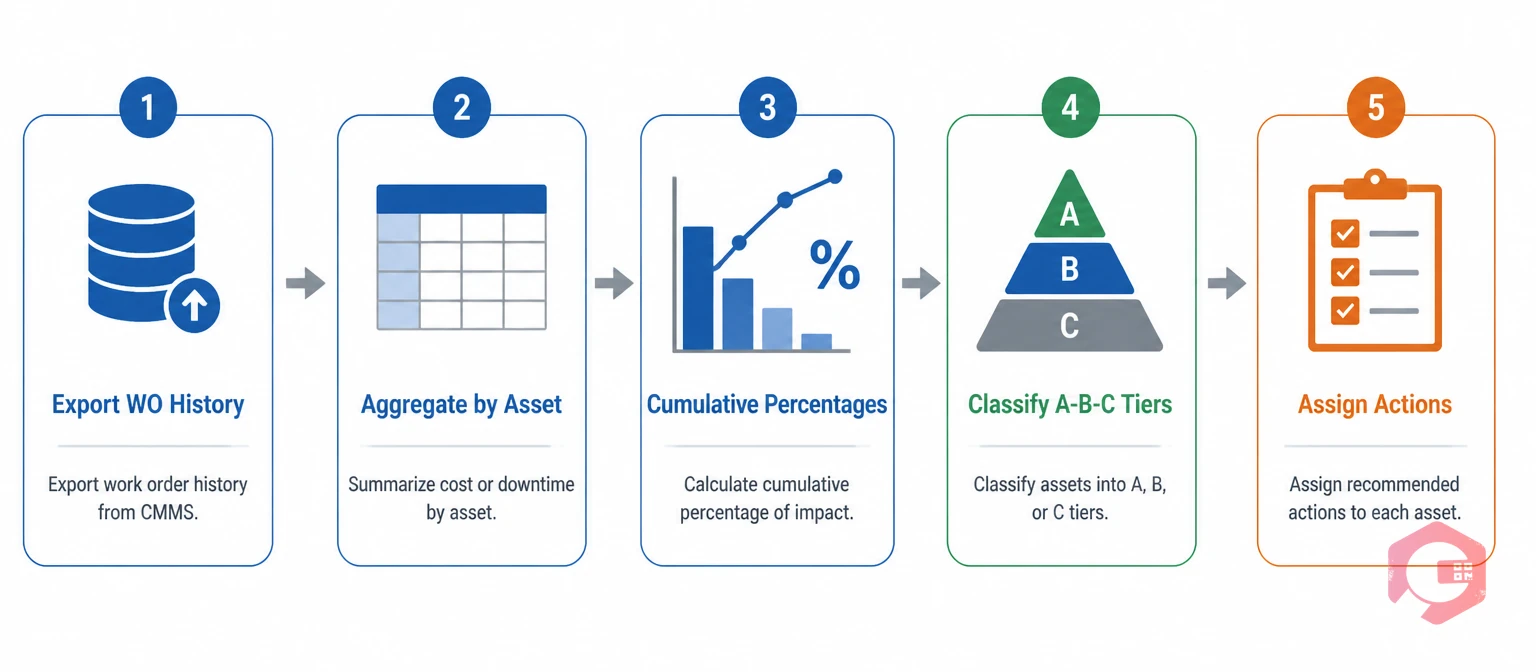
The analysis follows a five-step process that takes a morning to complete when your work order data is clean and accessible. The quality of the output depends almost entirely on the quality of the input data — which is why consistent work order closure discipline matters long before any analysis is attempted.
Pareto analysis on poor quality data produces a misleading picture that can direct maintenance investment to the wrong assets. Three data quality problems consistently invalidate the output.
The first is inconsistent asset coding in work orders. If different technicians refer to the same asset as "Compressor 4," "C-04," and "comp. unit east," the aggregation by asset ID produces three separate records that each understate the actual impact. The real Pareto A-class asset does not appear as such because its work orders are split across three codes. This is the single strongest argument for mandatory asset QR code scanning at work order creation — when technicians scan the asset rather than typing its name, the code is always consistent.
The second is unrecorded downtime. If technicians repair assets without logging a work order — a common pattern when reactive maintenance is handled informally via WhatsApp or verbal instruction — those downtime hours disappear from the dataset entirely. The Pareto analysis then understates the impact of the assets most prone to informal reactive fixes, which are often the exact A-class assets that need the most attention. Use Cryotos's downtime tracking module to capture every asset stoppage against the correct asset record, whether the job is planned or reactive.
The third is missing cause codes. If work orders close without a cause code, the failure mode dimension of the analysis is unavailable. You can see which assets cause the most downtime, but you cannot identify whether those failures cluster around a single root cause (which would point to a design-out solution) or represent multiple different failure modes (which would point to broader PM enhancement). According to Reliable Plant's research on maintenance data quality, operations with cause code completion rates above 85% on reactive work orders identify actionable root cause patterns 3× more often than those with completion rates below 50%.
The output of a Pareto analysis is a prioritised action list, not a static report. Each A-class asset needs an owner, a specific investigation or intervention, and a follow-up review date. Without these three elements, the analysis produces insight without change.
For each A-class asset, the maintenance engineer or reliability lead should review the work order history in detail — not just the aggregated totals. What failure modes are recurring? Do failures cluster at a consistent interval, suggesting a PM frequency gap? Do they follow a specific operational pattern, suggesting a process or operator behaviour root cause? Use the Overall Equipment Effectiveness data alongside the Pareto findings to understand whether the asset's downtime impact shows up primarily in Availability (breakdowns stopping the asset), Performance (degraded output), or Quality (defects generated). Each OEE component points to a different type of intervention.
The follow-up review is what transforms a one-time analysis into an ongoing reliability improvement programme. Schedule a quarterly repeat of the Pareto analysis and compare the A-class rankings to the previous quarter. An A-class asset that moves to B-class after a PM enhancement or root cause correction validates the intervention. An A-class asset that remains at the top of the ranking despite an intervention suggests the root cause has not been correctly identified or the intervention was inadequate. According to Plant Maintenance Resource Center, facilities running quarterly Pareto reviews consistently reduce their total unplanned downtime by 20–30% over 18 months by systematically working through the A-class asset list.

Pareto analysis requires three things from your maintenance system: consistently structured work order data, reliable asset identification on every record, and reporting tools that aggregate that data by asset without manual export and manipulation. Cryotos's CMMS delivers all three.
The asset register ensures every work order is linked to a specific, consistently identified asset — eliminating the naming inconsistency problem that corrupts manual data collection. QR code scanning at work order creation enforces this linkage at the point of logging, before any data quality problem can accumulate. Mandatory work order fields — including cause code, downtime hours, and parts consumed — ensure the dimensions needed for multi-axis Pareto analysis are present in every record by the time the report is run. The BI Dashboard surfaces asset-ranked reports directly: downtime hours by asset, repair cost by asset, and work order frequency by asset are available as live views without any manual aggregation. Use the MTBF calculator alongside the Pareto rankings to understand failure frequency patterns on the A-class assets — combining the "which assets" insight from Pareto with the "how often" data from MTBF gives the maintenance engineer the complete picture needed to set an effective PM interval or justify a condition monitoring investment.
Pareto analysis in maintenance is the application of the 80/20 rule to asset failure data. It ranks assets by their contribution to total downtime, repair cost, or reactive work order frequency, identifying the small fraction of assets responsible for the large majority of maintenance losses. The analysis converts raw work order data into a ranked priority list that directs PM investment, condition monitoring resources, and capital planning decisions toward the assets where improvement delivers the greatest operational and financial return.
You need reactive work order history with consistent asset identification, downtime hours attributed to each work order, repair cost per work order (labour plus parts), and ideally cause codes on each closed work order. The minimum viable dataset is asset ID plus downtime hours per work order over a 12-month period — this is sufficient to identify your top downtime contributors. Adding repair cost and work order frequency enables a three-dimension analysis that reveals different priority assets for different types of intervention.
Quarterly is the optimal cadence for most maintenance operations. Annual analysis identifies the problem assets but provides no feedback loop on whether interventions are working. Monthly analysis adds administrative burden without enough new data to show meaningful change. Quarterly analysis gives enough time for PM enhancements and root cause corrections to influence failure patterns, while maintaining a tight enough feedback loop to identify when interventions are not working before another six months of avoidable downtime accumulates.
Each A-class Pareto asset needs a specific response based on its failure pattern. If failures cluster at a consistent interval, the PM schedule needs tightening. If failures share a common cause code, root cause analysis should be initiated to address the systemic cause. If failure modes are detectable before breakdown, condition monitoring should be added. If the total annual maintenance cost is approaching or exceeding replacement value, a replace-versus-repair case should be built for capital planning. A Pareto rank without an attached action plan for each top asset produces insight without improvement.
Pareto analysis turns your maintenance data from a historical record into a prioritisation engine — directing your PM investment, technician time, and capital planning decisions toward the assets where improvement delivers the most impact. Cryotos gives maintenance teams the consistently structured work order data, asset-level reporting, and dashboard tools to run quarterly Pareto reviews without spreadsheet work — and to track whether the interventions on each A-class asset are actually shifting the rankings. Schedule a free demo to see how leading maintenance teams use Cryotos to identify and systematically improve their worst-performing assets.


Cryotos AI predicts failures, automates work orders, and simplifies maintenance—before problems slow you down.


